PAM Review: Energy Science & Technology, Vol. 5
ISSN 2205-5231 | Published by UTS ePRESS | https://epress.lib.uts.edu.au/student-journals/index.php/PAMR/index
A comparative analysis on the impact of salinity on the heat generation of OTEC plants to determine the most plausible geographical location
Bradley Lynn1*, Alexander Medved2, and Timothy Griggs3
University of Technology Sydney, Faculty of Science, PO Box 123, Ultimo NSW 2017, Australia
1 Bradley.Lynn@student.uts.edu.au
2 samuel.bentley-1@student.uts.edu.au
3 Timothy.Griggs@student.uts.edu.au
Corresponding author: Bradley Lynn, University of Technology Sydney, Faculty of Science, PO Box 123, Ultimo NSW 2017, Australia; Bradley.Lynn@student.uts.edu.au
DOI: http://dx.doi.org/10.5130/pamr.v5i0.1500
Citation: Lynn, B., Medved, A. and Griggs, T. 2018. A comparative analysis on the impact of salinity on the heat generation of OTEC plants to determine the most plausible geographical location. PAM Review: Energy Science & Technology, Vol. 5, pp. 119-130. http://dx.doi.org/10.5130/pamr.v5i0.1500
© 2018 by the author(s). This is an Open Access article distributed under the terms of the Creative Commons Attribution 4.0 International (CC BY 4.0) License (https://creativecommons.org/licenses/by/4.0/), allowing third parties to copy and redistribute the material in any medium or format and to remix, transform, and build upon the material for any purpose, even commercially, provided the original work is properly cited and states its license.
Abstract
This meta-study aims to analyse how the salinity and temperature gradient of the ocean influences the efficiency of ocean-based power plants utilising Ocean Thermal Energy Conversion (OTEC) systems to recommend optimal geographical locations. A comparative analysis of relevant and up to date literature was conducted with pooled data collected by other researchers and utilised such that reasonable conclusions were drawn on how the factors above impact the efficiency of the system. Through the comparisons of the different outputs of the various operational OTEC facilities, it was concluded that seawater with a higher salinity has a negative impact on the heat generated by the OTEC system. By decreasing the salinity by 10% the heat generated increased by up to 0.4%. This information conveys that ideal locations for OTEC power generation lie within the tropics, in regions with lower sea-water salinity. These findings could positively impact the power output of future OTEC plants and highlight the potential for new sources of renewable energies for coastal regions.
Keywords
OTEC; Meta-Study; Temperature Gradient; Salinity; Open cycle; Closed cycle; Thermocline
Introduction
The International Energy Agency’s 2007 World Energy Outlook states that between now and 2030, “Global energy needs are expected to grow, with fossil fuels remaining the dominant source.” [1] However as fossil fuels are a finite resource, research into possible sources of sustainable power has also increased. One theorised solution to the problem of large-scale sustainable power production is Ocean Thermal Energy Conversion (OTEC). Radiation from the sun is stored as heat in the surface of the ocean, and this creates a temperature difference between the upper and lower layers, this is utilised by the OTEC process to generate thermal energy. The warm surface water is used to vaporise a working fluid, most often ammonia, which has a low boiling point. Once evaporated, the working fluid vapour expands and turns a turbine which is connected to a generator that produces electricity. OTEC systems generally utilise closed, open or hybrid cycle; this meta-study will examine open and closed cycle systems.
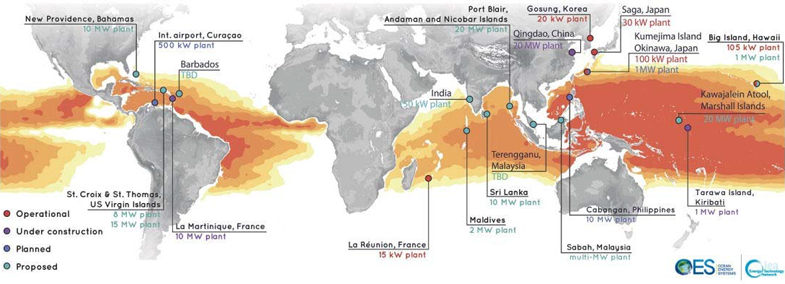
Figure 1 Operational OTEC plants as of 2017 [2]
Ocean thermal energy has a huge power potential; however, the thermal efficiency of the system is small, generally around 3 to 5% [3]. Thus, to maximise the energy output, it is critical to know conditions that will result in the most considerable difference between the two layers of ocean waters. Seeing as the efficiency of the cycle is quite low, there is quite a large room for improvement. Improvements could be potentially made by varying the geographical location.
OTEC systems are widespread in location, with high environmental variability and many differentiating factors, including differences in the configuration of the process, regarding working fluid or power lost running. It is therefore difficult to draw significant conclusions about efficiency from data obtained from a single OTEC plant. A meta-study analysis was applied to evaluate which environmental factors had the most significant impact on OTEC efficiency.
Ocean Surface Salinity
Ocean surface salinity was determined by pinpointing the location of found plants on the global salinity map obtained from the European Space Agency’s (ESA) SMOS satellite in 2017. Due to limited information on the salinity at each plant location, it was assumed based on the standard salinity profile [4] that the surface salinity was the maximum possible value and was used in calculations to determine if salinity impacts heat output.
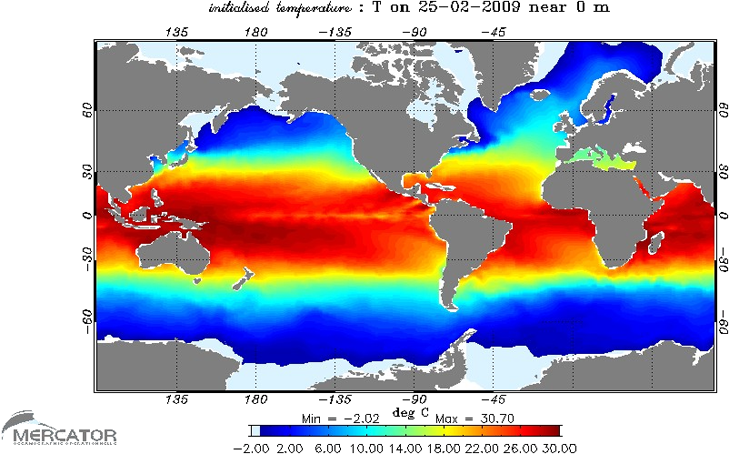
Figure 2 Map of Sea Surface Temperatures [5]
Ocean surface salinity varies between 28.52 PSU (Practical Salinity Unit) and 38.23 PSU; these units are equivalent to parts per thousand or g/kg. As the salinity changes so does the specific heat capacity (C) of the water [7] due to equation 1. This is because of seawater having a specific heat dependent on the percentage composition of different substituents heat capacities, e.g. CNaCl= 864 J/kg/°C Cwater= 4179 J/kg/°C [8] :

Thermocline and Surface Temperature
A thermocline is a relatively small layer found in a large body of a fluid, in this case, the Ocean. It separates a mixed (generally warmer) surface layer and the calm lower waters. In this region, the temperature changes rapidly with depth compared to the areas above and below it.
OTEC Closed Cycle System
A Closed Cycle OTEC System uses the natural temperatures of warm surface seawater and cold subsurface seawater to generate electricity. The warm surface water passes through a heat exchanger, which is in contact with a closed loop of working fluid; in this case Ammonia (𝑁𝐻5) and causes the working fluid to vaporise and expand, thus turning a turbine to generate electricity. After passing through the turbine, the working fluid enters a condenser, which is in contact with the cold subsurface seawater. The working fluid is then condensed back into a liquid which then travels back through the closed loop, and the cycle continues [10]. As the OTEC system is a thermal generator, an increase in heat generated will directly increase the power output.
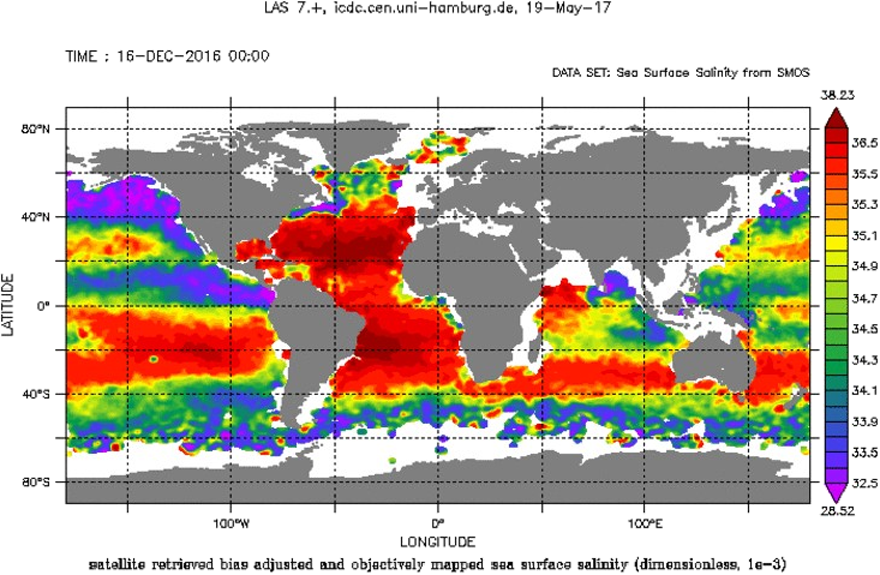
Figure 3 Sea surface salinity (SSS) from SMOS [6]

Figure 4 General graph of an ocean Thermocline, this changes with location and its properties vary with season, latitude, tides and currents [9]
OTEC Open Cycle System
The Open-Cycle OTEC System intakes warm surface seawater - which is also the working fluid – into an evaporator which maintains a lower pressure with a vacuum pump. The lower pressure in the evaporator causes the warm water to boil and produces steam. This steam is then passed through a turbine into a condenser, which is cooled by the cold subsurface seawater, and condensed back into a liquid. After the whole process, the worked seawater is now desalinated and is either pumped from the system back into the ocean or a storage tank and used as fresh water. [11]

Figure 5 Closed Cycle OTEC diagram [10]. The seawater is used to evaporate and condense the working fluid
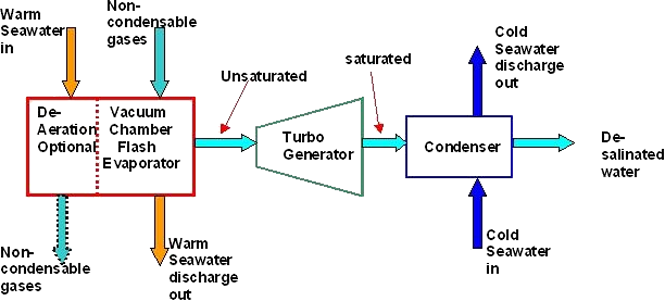
Figure 6 Open Cycle OTEC diagram [12]. The seawater is used as the working fluid
Methodology
A comparative analysis of relevant and up to date literature was conducted with pooled data collected by other researchers through databases such as ‘Scopus’, ‘Web of Science’, ‘SciFinder’ and ‘Google Scholar’. A broad search criterion was used, including the terms: OTEC, Salinity, Temperature gradient, with articles chosen restricted to those published after 2010 and no restrictions on language. By utilising modern world map of the current plants (Figure 1) searches also included the names of those locations, followed by OTEC, for example, “Reunion OTEC’. The references of all articles and reviews were checked for other relevant reports. Utilising this found information as to deduce a reasonable conclusion about the impact of different environmental factors on efficiency. Specific heat capacity values were calculated for each concentration of NaCl through extrapolation from a graph; this was done by utilising the WebPlotDigitiser tool [13] to create original figures to assist with calculations. The error was determined by calculating the standard error of the mean and salinity was converted from g/kg to percentage concentration of NaCl to be better analysed to a graph of percentage mass salinity. Due to limited data available, the original search parameters had to be expanded to incorporate the terms: heat capacity of NaCl, thermocline and halocline. Data was also obtained from the databases IEEE and Web of Science, while the parameters were expanded to incorporate articles published after 1980.
Results and Discussion
Proposed plant near Florida
The following table shows data found from a paper proposing an idea for an OTEC power plant near Florida [14]. This data has been selected because of its consistency in a localised area, and therefore we can assume there is no significant change in the salinity between readings, and also because the ΔTmax (Maximum temperature difference at that location) is being measured along with depth. With the nine different proposed locations, each with a different cold-water pipe depth, and the respective values for ΔTmax and Net Pmax (Maximum power obtained/calculated) at those locations/depths, thus the data is well suited for the investigation of the correlation between the two variables. The gross power for the conceptual plant was 150 MW.
| Depth (m) | Distance from US shore (km) | ΔTmax (°C) | Pmax (MW)(Net) | Location |
|---|---|---|---|---|
| 200 | 12 | 17.59 | 50.2 | 25°39.4′N, 80°02.4′W |
| 300 | 19 | 19.40 | 74.6 | 25°37.2′N, 79°57.6′W |
| 400 | 25 | 20.12 | 83.8 | 25°32.9′N, 79°55.2′W |
| 500 | 46 | 20.60 | 90.0 | 24°47.3′N, 80°07.2′W |
| 600 | 51 | 21.14 | 96.8 | 24°42.9′N, 80°07.2′W |
| 700 | 60 | 21.37 | 99.4 | 24°36.4′N, 80°07.2′W |
| 800 | 63 | 21.71 | 103.6 | 24°08.0′N, 81°00.0′W |
| 900 | 71 | 22.05 | 107.7 | 24°03.6′N, 81°07.2′W |
| 1000 | 98 | 22.41 | 112.2 | 23°41.6′N, 82°04.8′W |
Temperature Gradient
A major factor in determining a suitable location for an OTEC plant is a larger operating temperature gradient. To determine the exact correlation between temperature difference and power output, the data from Table 1, was used to produce a graph (Figure 7) which shows how an increase of temperature difference will affect the power production of the system.

Figure 7 Power Output (MW) against Temperature Difference (°C). Conveying a proportional increase in power output with increases in temperature difference
The graph exhibits a linear relationship between the two variables, which demonstrates that the power output of an OTEC plant has a direct proportionality with the temperature difference between the two depths as expected. In 2013 it was determined that an increase in the temperature gradient would directly increase the power output of the system [15], and this is consistent with our results that temperature difference impacts Pmax. Due to how the ocean acts as a thermocline, it is advised that cold water pipes only go to depths that lie below the thermocline as that is where temperature changes significantly with respect to depth. Hence when examining potential locations for OTEC plants, the range of temperatures available at different water depths must be heavily considered. Figure 8 demonstrates how an increase in depth would increase power output. It is important to note that this graph is unique to the Florida coast, due to its specific thermocline, and thus must not be considered as an accurate representation for all regions across the ocean.
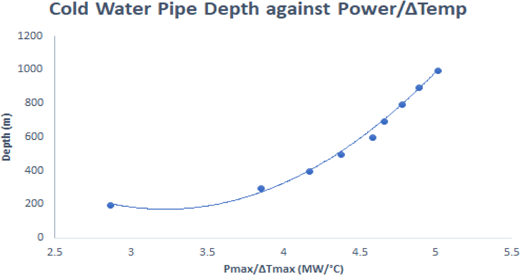
Figure 8 Power per Temperature difference (MW/°C) against Depth of the cold-water pipe
Salinity
It was found that as the concentration of NaCl increases in seawater, the specific heat capacity decreases (Fig.11). As the OTEC plants depend on generating larger amounts of heat to vaporise a working fluid, an increase in salinity will directly reduce the heat generated. As there can only be a fixed amount of seawater flowing through the plant at any given moment, the mass was assumed constant. This relation is shown in equation 2. The value for heat capacity at constant pressure was assumed to be the same at constant volume; this is due to the coefficient of thermal expansion for saline water being incredibly small and the ratio of the specific heat capacities being close to one [16].

The values for the effect of NaCl concentration were obtained and used to calculate its effect at different temperature differences on the heat generated within the system. The heat generated in the system decreases while the concentration of NaCl increases, this inverse relationship is shown graphically in Figure 10. Decreasing the NaCl concentration by 10% resulted in an average increase of 0.4% heat generated.

Figure 9 How increasing the salinity of water affects its specific heat capacity [17]

Figure 10 The impact of increasing salinity concentration on heat produced at multiple temperature differences (ΔT). The graph conveys an inverse relationship between the two parameters
Efficiency
The efficiency of each generator is dependent on their design. The factors required to be taken into consideration to determine the efficiency of an OTEC plant are numerous, and they further depend on the type of system, temperature gradient, depth of cold water pipe, heat exchangers and condensers. To overcome this, the ratio of net to gross power was used as a metric of the overall efficiency and is calculated through equation 3.

Heat energy
As the closed cycle OTEC system uses the heat generated by the temperature difference between the upper and lower layers of seawater to vaporise the working fluid, it was concluded that any increase or decrease in heat generated will directly impact the power generated. The temperature difference and heat capacity at different salinities was directly related to the heat calculated by equation 2 and shown in Figure 10.
OTEC power stations, Existing and Proposed
Table 2 is comprised of the majority of real or conceptual OTEC plants that researchers have experimented with or investigated and on which research papers are available for at present. However, it must be stated that only papers which included a full dataset for their respective plants are included, this is due to some articles only mentioning one or two variables and not containing a complete set of data, and thus no possible conclusions can be drawn using the minimal data present. The table includes information on where the plant is located/proposed as well as power outputs, pipe depths and temperature difference. It also consists of the estimated values for salinity and the calculated values of power ratio and heat energy.
| Location | System | Gross Output(kW) | Net Output(kW) | Depth (m) | ΔT (oC) | Salinity (g/kg) |
|---|---|---|---|---|---|---|
| Republic of Nauru [18] | Closed Cycle,Actual | 120 | 31.5 | 580 | 22 | 35.5 |
| Iran, Oman Sea [19] | Closed Cycle,Conceptual | 5x10³ | 3.52x10³ | 1000 | 22 | 37 |
| Kailua-Kona, Hawaii [20] | Open Cycle,Actual | 210 | 103 | 600 | 20 | 35 |
| Reunion Island [21] | Closed Cycle,Conceptual | 16x103 | 10.1x10³ | 1000 | 23 | 34 |
| Kona Coast of Hawaii [22], [23] | Closed Cycle,Actual | 50 | 15 | 670 | 21 | 34.5 |
| Tuticorin, South India [24] | Closed Cycle,Conceptual | 1x10³ | 500 | 1200 | 22 | 32.5 |
| Location | Q (J) | Power Ratio (η) | Depth/ΔT (m/oC) | QNaCl (J) | ΔQNaCl (J) |
|---|---|---|---|---|---|
| Republic of Nauru [18] | 88150 | 0.26 | 26.36 | 88400 | 250 |
| Iran, Oman Sea [19] | 87875 | 0.70 | 45.45 | 88200 | 325 |
| Kailua-Kona, Hawaii [20] | 80190 | 0.49 | 30.00 | 80600 | 410 |
| Reunion Island [21] | 92200 | 0.63 | 43.48 | 92700 | 500 |
| Kona Coast of Hawaii [22], [23] | 84350 | 0.30 | 31.90 | 84650 | 300 |
| Tuticorin, South India [24] | 88450 | 0.50 | 54.55 | 88800 | 350 |
Conclusion
In conclusion, the higher the concentration of NaCl in seawater, the lower the heat capacity, resulting in less energy generated per unit mass per degree Celsius change, decreasing the rate the working fluid vaporises and turns a turbine to generate electricity. It was also confirmed that a higher temperature gradient is critical to the potential output of the system and optimal cold-water pipe depths is roughly 1000 All of these points indicate that the optimal locations for OTEC power generation would be regions with a higher temperature difference across its depths as well as areas with lower salinity.
Using the prior statement as an outline, and making use of the findings in Figure 2 and Figure 3 the following locations were determined to be the most suitable for new OTEC plants:
- South-west section of the Bay of Bengal, which has a salinity of around 33.5g/kg [6] and a temperature around 27-29°C [5]
- South of the coast of Jakarta, as its salinity is approximately 33.5g/kg [6] and its surface temperature is close to 30°C [5]
- Directly south of Costa Rica, as it maintains a salinity of approximately 32.5-33 g/kg [6] with a surface temperature between 26-30°C [5]
However, due to lack of experimental data, no accurate predictions can be made for the power output of these systems. For a more precise understanding of how heat energy affects the net power of the system, more research should be conducted on the efficiency of the pumps used to draw up the deep ocean water and to what extent an increase of heat energy will increase the vaporisation rate of the working fluid. As the average efficiency of OTEC systems is below 5%, it is vital to be maximising the potential output of all variables that affect net power to increase overall power production.
Acknowledgements
The authors would like thank to Dr Jurgen Schulte for the insight into heat engines and the knowledge required to formulate this meta-study. We would also like to thank Blake Regan, Dr Martin Bell and Joshua Pritchard for their insight and experience in writing meta-studies.
References and Notes
1. Reasons for increase in demand for energy. Available at: https://www.bbc.com/education/guides/zpmmmp3/revision. Accessed May 20, 2018.
2. Global map of OTEC plants comes to light. Available at: https://marineenergy.biz/2017/06/19/global- map-of-otec-plants-comes-to-light/. Accessed Apr 29, 2018.
3. Yasuyuki Ikegami, Takeshi Yasunaga, Takafumi Morisaki. Ocean Thermal Energy Conversion Using Double-Stage Rankine Cycle. Journal of Marine Science and Engineering 2018 Jan 1,;6(1):21.
4. https://doi.org/10.3390/jmse6010021
5. Standard Salinity Profile. 2018; Available at: https://www.windows2universe.org/earth/Water/salinity_depth.html&edu=high. Accessed 22 May, 2018
6. ESA Earth Online. Available online: https://envisat.esa.int/live/envisat_live_09.html. Accessed 18/05/2018
7. Sea surface salinity (SMOS). Available at: https://icdc.cen.uni-hamburg.de/1/daten/ocean/smos-sss/. Accessed May 14, 2018.
8. 30 N, Announcement 2|. Rule of Mixtures Calculator - Find Specific Heat Capacity of a Mixture. 2017; Available at: https://thermtest.com/rule-of-mixtures-calculator. Accessed Apr 29, 2018.
9. Specific Heat. Available at: http://www.iun.edu/~cpanhd/C101webnotes/matter-and- energy/specificheat.html. Accessed May 21, 2018.
10. Thermocline. 2018; Available at: https://en.wikipedia.org/w/index.php?title=Thermocline&oldid=837106448. Accessed May 16, 2018.
11. Closed Cycle Ocean Thermal Energy Conversion (OTEC): New Energy Portal. Available at: https://newenergyportal.wordpress.com/2009/12/15/closed-cycle-ocean-thermal-energy-conversion- otec/ Accessed 29/04/2018
12. Azhim A, Jaafar AB, Musa M, shaikh salim s,ahmad zaki, Dzulkafli NF. Ocean Thermal Energy Conversion: The Promise of a Clean Future. ; 2013.
13. otecex.jpg. Available at: http://www.esru.strath.ac.uk/EandE/Web_sites/02- 03/ocean_thermal_energy/group%20project/exports/otecex.html. Accessed May 22, 2018.
14. Rohatgi A. WebPlotDigitizer. 2018 Jan,;4.1.
15. VanZwieten JH, Rauchenstein LT, Lee L. An assessment of Florida’s ocean thermal energy conversion (OTEC) resource. Renewable and Sustainable Energy Reviews 2017 /08/01;75:683-691.
16. https://doi.org/10.1016/j.rser.2016.11.043
17. Experimental studies on a closed cycle demonstration OTEC plant working on small temperature difference. Renewable Energy 2013 /03/01;51:234-240.
18. https://doi.org/10.1016/j.renene.2012.09.041
19. Physical Properties of Seawater; Available at: http://www.kayelaby.npl.co.uk/general_physics/2_7/2_7_9.html. Accessed 18/05/2018
20. Sodium Chloride and Water; Available at: https://www.engineeringtoolbox.com/sodium- chloride-water-d_1187.html. Accessed 18/5/2018
21. Mitsui T, Ito F, Seya Y, Nakamoto Y. Outline of the 100 kW OTEC pilot plant in the republic of nauru. IEEE Trans Power Appar Syst 1983;PAS-102(9):3167-3171
22. https://doi.org/10.1109/TPAS.1983.318124
23. Hamedi A, Sadeghzadeh S. Conceptual design of a 5 MW OTEC power plant in the Oman Sea. Journal of Marine Engineering & Technology 2017;16(2):94-102.
24. https://doi.org/10.1080/20464177.2017.1320839
25. The 210 kW Open Cycle OTEC Experimental Apparatus: status report. ; 1995.
26. Sinama F, Martins M, Journoud A, Marc O, Lucas F. Thermodynamic analysis and optimization of a 10 MW OTEC Rankine cycle in Reunion Island with the equivalent Gibbs system method and generic optimization program GenOpt. Applied Ocean Research 2015 /10/01;53:54-66.
27. https://doi.org/10.1016/j.apor.2015.07.006
28. Owens WL, Trimble LC. Mini-OTEC Operational Results. Lockheed Ocean Systems 1981 April 29,:233-240. https://doi.org/10.1115/1.3266245
29. Operational Experience of the OC-OTEC Experiments at NELH. ASME Annual Solar Energy Division Conference; 2 - 5, April 1989; San Diego, California: SERI; February 1989.
30. The Indian 1 MW demonstration OTEC plant and the development activities. ; 29-31 Oct. 2002; Biloxi, MI, USA: IEEE; 29-31 Oct. 2002.