PAM Review: Energy Science & Technology, Vol. 7, 2020
ISSN 2205-5231 | Published by UTS ePRESS | https://epress.lib.uts.edu.au/student-journals/index.php/PAMR/index
Increasing the efficiency of a Peltier device by assessing the thermal performance of liquid-cooled microchannel heat sinks
Lauren Sharpe1,*, Navil Burhan Uddin2, Tiana Majcan3, Jonathan Rebolled4
University of Technology Sydney, Faculty of Science, PO Box 123, Ultimo NSW 2007, Australia
1lauren.sharpe-1@student.uts.edu.au
2navil.burhanuddin@student.uts.edu.au
3tiana.c.majcan@student.uts.edu.au
4jonathan.e.rebolledo@student.uts.edu.au
* Author to whom correspondence should be addressed.
DOI: https://doi.org/10.5130/pamr.v7i0.1592
Citation: Sharpe, L., Uddin, N.V., Majcan, T., Rebolledo, J. 2020. Increasing the efficiency of a Peltier device by assessing the thermal performance of liquid-cooled microchannel heat sinks. PAM Review: Energy Science & Technology, 7, Article ID 1592. https://doi.org/10.5130/pamr.v7i0.1592
© 2020 by the author(s). This is an Open Access article distributed under the terms of the Creative Commons Attribution 4.0 International (CC BY 4.0) License (https://creativecommons.org/licenses/by/4.0/), allowing third parties to copy and redistribute the material in any medium or format and to remix, transform, and build upon the material for any purpose, even commercially, provided the original work is properly cited and states its license.
Abstract:
Water is, arguably, Earth’s most valuable and vital resource. Devices that extract water from the atmosphere have been intensely researched as a means of harvesting potable water in environments where it is otherwise scarce. One such device is a Thermoelectric Cooler (TEC); a device that utilises the Peltier effect to cool a system. TECs are a promising solution for atmospheric water generation (AWG) over their competitors due to their simplicity and refrigeration capabilities. Despite these advantages, TECs are still considered mostly inefficient as they demand relatively high costs and energy consumption. This meta-analysis focuses on optimising the efficiency of small-scale Peltier devices. It explores the means of optimising the liquid cooled heat sink by using a specific flow field microchannel configuration such that less pumping power is required to push the coolant and more energy can be saved. A combination of optimal operating current of the Peltier device and of a novel flow liquid-cooled microchannel heatsink configuration with bifurcated fins using Galinstan as a coolant promises a significant increase in water production per unit of energy consumption for the AWG system.
Keywords:
atmospheric water generation; Peltier device; thermoelectric cooler; heat sink; efficiency; bifurcation
Nomenclature
1. Introduction
Atmospheric water generation has become increasingly popular in the developing world where potable water is scarce and electricity production is limited [1–6]. In these climates, Thermoelectric Coolers (TECs) are commonly used as they provide a feasible and sustainable solution to the growing demands of the inhabitants [3–5, 7–9]. In response to the dwindling of fresh water supplies due to climate change, many countries are researching alternate solutions for potable water production.
A common alternative are desalination plants, due to their capability of efficiently transforming undrinkable water into potable water. Whilst they are effective, the technology they operate on is expensive to produce and maintain, suggesting that they are not a feasible, long-term solution to the world’s water scarcity dilemma [1, 6].
Unlike desalination plants, however, Atmospheric Water Generators (AWGs) not only provide a feasible method for obtaining potable water, but they also provide mobility as they source humidity from the surrounding air. AWGs are currently categorised into two main water production methods: cooling condensation and wet desiccation [2, 5]. The latter method involves the use of salts as humidity absorbers, where the water produced in the brine solution is extracted and purified for consumption [2]. In the case of cooling condensation, a compressor circulates coolant through a system, which reduces the temperature at a capture surface where water can condense onto [5]. Modern investigations explore the cooling condensation method, however, rather than a refrigerant circulating, the system utilises the Peltier effect to more efficiently cool the water capture surface [4, 5, 10].
The Peltier effect is the observed phenomenon whereby heat is exchanged at the junction of two dissimilar metals when an electric current is applied [8, 11–13]. This effect drives the basic function of a TEC, which behaves as a heat pump redistributing heat from the cold side to the hot side [13]. A TEC typically features a p-n semiconductor array (junction) encased in ceramic plates on both the top and the bottom frames for the hot and cold sides of a Peltier device, illustrated in Figure 1. The flow of direct current through the device will produce a temperature gradient between the two plates which in turn, generates a thermal flux, transferring heat from one side to another [10, 14]. To prevent overheating, a heatsink must be attached to the hot side to dissipate the heat produced by the module and the Joule heat produced consequence of the electricity supply [13, 14].
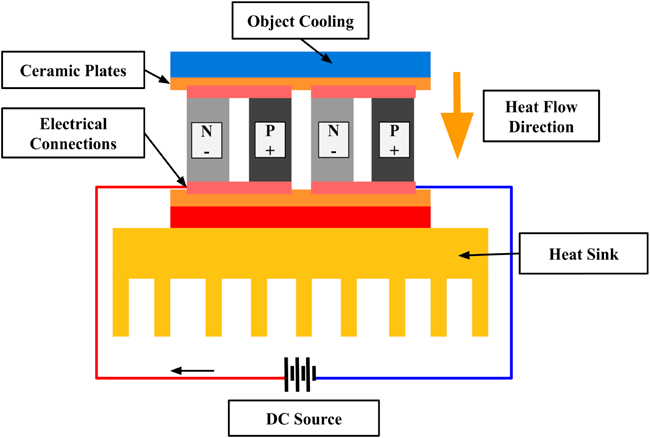
Figure 1 Simplified schematic of a thermoelectric cooler, where the object being cooled and the heat sink are encasing ceramic plates (orange) and electrical connections (pink), attached to the semiconductor p-n junctions. The current flow direction from positive to negative is shown next to the power source, and the heat flow direction is shown next to the semiconductor.
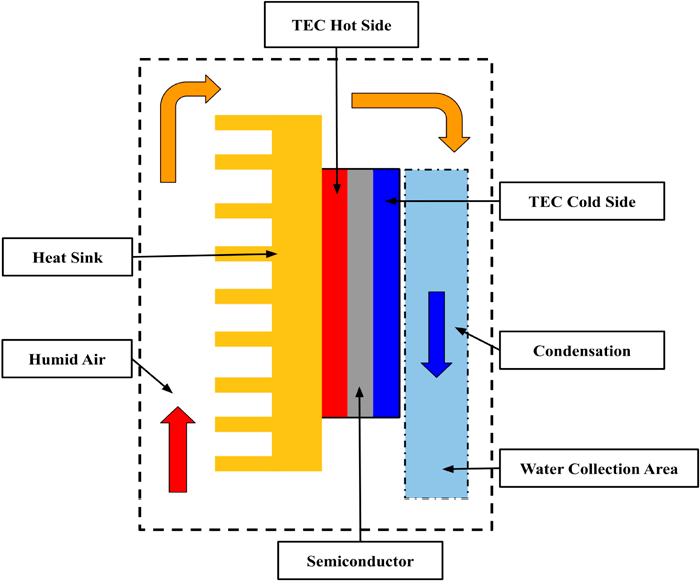
Figure 2 Simplified schematic of an Atmospheric Water Generator where a thermoelectric cooler drives the heat from the Cold Side to the Hot Side, allowing for water condensation and collection. Hot, humid air is passed over the heat sink, creating an electric current that further cools the opposite side. The water vapour in the hot air is cooled to its dew point and allowed to condense. Power input is connected to the semiconductor array.
When the cold side of the device reaches the ambient dew point, the contacting water vapour condenses into water droplets [10, 15]. Figure 2 illustrates a simplified schematic of an AWG based on a TEC module, showing the main components and the direction of air flow.
The temperature distribution of the TEC’s hot side is impacted by the design of the microchannels [16]. The standard topology is a Parallel network design; however, benefits have been noted in U-Shaped and S-Shaped designs that surpass those of the former [16]. Although these shapes generate somewhat even temperature distributions on the surface, they also reduce the temperature gradient across the device [17]. Overcoming this, river-like microchannel designs with bifurcations have been shown to not only normalise the temperature across the TEC more evenly but also reduce the change in pressure from the inlet to the outlet, removing the need for extra work in the form of pumping power to be applied to the system [17]. The performance of a river-like microchannel design is more effective than that of a Parallel, U-Shaped, or S-Shaped network as it reduces the thermal resistance R, cooling the cold side more efficiently [17].
Thermoelectric cooling applications have specific heat sink requirements. Often, there will be different mechanical necessities that convolute the design. Considering each case is unique, it is impractical to propose the same heat sink design for both, large and small Peltier devices. Nevertheless, the most common applications are based on forced convection, whereby fans are used to move air around the system [14]. Cooling air is passed through the length of the heat sink and directed to the focal point of the fins, egressing it through both open ends, similar to the large Peltier device in Figure 2. Most experiments that model realistic scenarios use a temperature range like that of what a TEC may experience in a desert environment; between 296 K and 388 K. Ultimately, determining the efficacy of the TEC’s cooling process is the Coefficient of Performance (COP). It is defined as the ratio of cooling capacity, Qc, to the total power input, Win [5]:

1.1 Liquid-Cooled Heat Sink
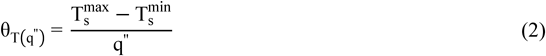
Liquid cooled heat sinks provide the highest thermal performance per unit volume and, when optimally designed, can exhibit a very low thermal resistance. Among all the various types of heat sink modules, the microchannel heat sink has garnered attention for its ability to remove high heat flux density ranging from 100 to 1000 W cm-2 [18]. To quantify the cooling performance of a heat sink, its performance is evaluated by the ratio of the difference between the maximum and minimum surface temperature, Ts, against the heat flux, q˝, applied as shown in Eq. 2 [19], where is the maximum temperature difference on a heating surface per unit of heat flux (K W-1m-2).
However, a more accurate analysis of the heat sink can be obtained when using the average temperatures rather than individual data points. The average low temperature is an important variable and should be monitored, and as a result, a parameter forms as shown in Eq. 3 [19].
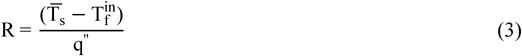
R represents thermal resistance and is the ratio of the difference between the average surface temperature, Ts, and the temperature of the input fluid, Tfin against the applied heat flux, q˝. An efficient heat sink will provide better heat transfer, resulting in a lower average surface temperature and in turn a lower thermal resistance [19]. An ideal sink with the greatest heat transfer will have both θT(q˝) and R at the lowest possible values [19]. Nonetheless, achieving both minima is practically impossible due to both variables strongly influencing each other. Therefore, to optimise the efficiency of a heat sink without any drawbacks, other design elements should be studied carefully, such as the input pumping power required to drive the coolant through the heat sink. Where v is the volumetric flow rate of the coolant in the heat sink and Δp is the pressure drop across the microchannel, the pumping power P is [17]:

The smaller the microchannels the greater the heat transfer area, however, if the flow distribution of the fluid is not facilitated appropriately, the heat sink’s efficiency decreases due to the thermal stress and increase in pumping power [19]. The local heat coefficient is:

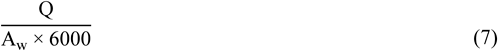
where hm(i) is the local heat transfer coefficient of the microchannels (W m-2 K-1), Q is the heat flux (W), Aw represents the heat transfer area (m2). T(i) is the local temperature of the microchannel wall surface, and Tf is the local mixed-mean fluid temperature between the inlet and the outlet, both measured in degrees Kelvin [17].
1.2 Microchannel Topology
In microchannel topology, Parallel, U-Shaped, and S-Shaped patterns are very practical to manufacture, however, their designs produce high temperature gradients and high hydraulic resistance, two factors that negatively impact heat transfer [20]. To overcome these disadvantages to the heat exchange process, non-uniform microchannels can be used as they prove more efficient in heat dissipation than conventional uniform microchannel designs [20, 21]. Additionally, multistage bifurcations improve thermal performance, whereas nil stage bifurcations do not as they require large pumping forces when compared to natural flow designs, and at higher Reynolds numbers [16]. In order to maximise the heat transfer across a heat sink, the heat exchange area must be increased [22]. This process is most effectively done by creating organic microchannel topologies that, by extension, create small islands that redistribute the heat to areas of the heat sink being underutilised or not utilised at all [22].
1.3 Reynolds Number
The Reynolds number (Re) is the ratio of inertial forces to viscosity, both pertaining to a liquid [23]. Where u is the flow speed (ms-1), L is the characteristic linear dimension (m), and v is the kinematic viscosity (m2s-1), the Reynolds number can be calculated as follows [23]:

This ratio is significant in deducing the efficiency of a liquid-cooled heat sink as it describes how a fluid will flow through the microchannels, and by extension, how heat will be transported out of the system [23]. A lower Reynolds number, in the order of hundreds, suggests laminar flow and a stable flow rate [23]. Both flow resistance and heat transfer increase with the flow rate, and in maximising these properties, so does the efficiency, as the improvement of heat exchange is more cost-effective when compared to the reduction in power consumption [20].
1.4 Objective
A forced convection technique is not viable for smaller heat sinks as there is simply not enough space. Here, a liquid cooled microchannel heat sink can be advantageous as it requires a much smaller space, is suitable for high flux heat dissipation, and offers a higher heat capacity and thermal conductivity when compared to generic convection methods [19, 24]. Investigations have been conducted on microchannel heat sinks, however, there is limited focus on the distribution of flow within the microchannels [19]. Less uniform flow distribution of the microchannels not only decreases the heat sink’s efficiency by raising local thermal stress, but also generates high pressure losses between the inlet and the outlet requiring greater pumping power consumption for operation [19]. Considering this, our meta-study investigates the optimal coolant fluid and flow distribution design for an efficient Peltier device, whilst also comparing microchannel topologies.
2. Method
The aim of this meta study is to aggregate results and conclusions from multiple studies regarding the optimisation of liquid cooled heat sink that are used in TEC modules, synthesising an analysis. Information was obtained from academic sources such as, SCOPUS, Science Direct, IEEE Xplore, and INSPEC, with a publishing date within the past decade. Imposing this limitation provides contemporary solutions from contemporary technologies.
Furthermore, the research scope was restricted to thermodynamics, utilising keywords such as thermoelectric cooling, thermoelectric generators, and atmospheric water generation, eliminating the possibility of using irrelevant information. Combining these limitations ensured that the sources used are of adequate quality, presenting theoretical information and experimental data with the following benchmarks: it contains theoretical knowledge of the thermodynamic process in a Peltier module, it contains experimental data which quantifies the translation and distribution of heat in the heat sink, and it explores the implication of optimisation in real-world application. The data presented in Figure 9(a) was calculated using Eq. 5, where Q is 300W, and the data Figure 8. Each hm was calculated as an average of each bifurcations’ respective parameters, (area and temperature difference), and presented as a line graph. Figure 9(b) also represents averages, presenting the average temperature difference across the microchannels in each case. Figures 3 – 6, 8, and 10 were derived by manually reading the data points from the actual graphs in the respective paper hence there may be slight discrepancies with the position of the plot points but the trends for each case are carefully preserved. Figure 7 was adapted from the simulations run by Li et al. and Koga et al. It should be noted that the impact of the heat sink’s material has been ignored for this study and is a variable recommended by the authors for further study.
3. Results and Discussion
3.1 Single vs Bifurcated Microchannel Heat Sinks
To understand the significance of microchannel topology in the design and performance analysis of a heat sink, the experimental study of heat sinks with and without bifurcations in the microchannel is referred to [17]. It can be stated that bifurcation poses a potential advantage when designed properly. To explore this, four cases of bifurcations along with one case of non-bifurcation (single continuous microchannel), as shown in Table 1, were investigated [17].
The microchannel length and the number of microchannels in the 1st and 2nd segments are given by L1 & L2 and N1 & N2 respectively. The ratio of the lengths, ΨL and the ratio of the number of microchannels ΨN is also given. Variables such as the microchannel height, substrate thickness, cover plate thickness, and wall thickness are all constant in each case [17]. To understand the significance of improving the design of bifurcation three constructal designs of inlet bifurcation microchannel are also considered for comparison as described in Table 2 [25].
The heat transfer coefficient, hm, of the microchannel increases with the increase in flow rate as per Eq. 5 [17]. However, at a high inlet velocity, the drop in the pumping pressure also increases. According to Figure 3(a), Case 5 has the highest pressure drop with Case 1 being the lowest. This is because at the first segment of the junction the pressure decreases slowly and linearly but then increases at the position of split and then again decreases sharply and linearly. This happens since velocity gradually becomes smaller before approaching the bifurcated position and then gradually becomes larger after reaching the bifurcation position [17]. Hence, the flow pressure in the bifurcated heat sink is always higher than the singular continuous microchannel. As a result, according to Eq. 4 the bifurcated microchannel requires a greater pumping power for generating this high pressure to push the coolant through the microchannels.
Furthermore, the experimental result with the constructal inlet design also supports the fact that the velocity gradually reduces before approaching the bifurcation position and then gradually increases after passing it [25]. This can be seen in Figure 3 (b) where it is found that the pressure-drop of the two-stage bifurcation microchannel (Cond. 2, 3 & 4) is higher than that of the one-stage bifurcation microchannel (Cond. 1). Moreover, for the two-stage bifurcation microchannel where the shorter plate is inserted at the front (Cond. 3) of the entrance region, the pressure drop is slightly less than that for the other type of the two-stage bifurcation microchannel.
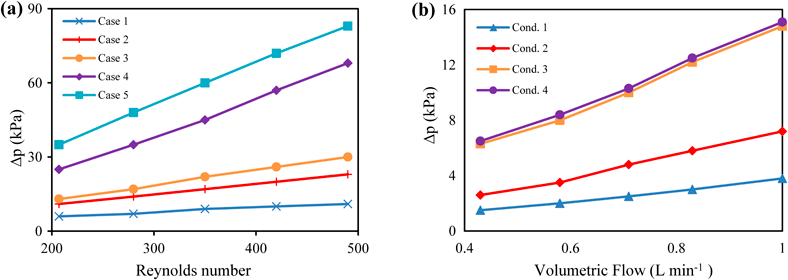
Figure 3 Correlation of pressure drop in kPa versus (a) Reynolds number for 5 experimental cases and (b) volumetric flow rate for 4 experimental conditions [25].
Referring to Figure 4 below, the local pressure in Cond. 1 decreases linearly as expected. For one stage bifurcation (Cond. 2) the decrease in the pressure is sharp and linear until the merging point where it forms a straight microchannel. Cond. 3 which has a short plate at the entrance region of the inlet follows this trend as well. On the contrary, when the plate is present at the back of the sub-microchannel (Cond. 4), the flow pressure decreases slightly initially and then at the location of split it decreases sharply and linearly.
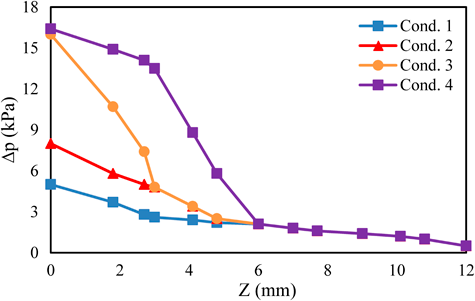
Figure 4 Local pressure changes in kPa along the stream-wise (z-axis) direction for 4 experimental conditions [25].
To assess the thermal capability of the microchannel heat sinks at a fixed Re value, the average thermal resistance is taken into consideration. The connections between the average thermal resistance and Re are given in Figure 5. From Figure 5(a), it is indicative that the average thermal resistance is inversely proportional to the Re for all cases. Likewise, for a constant microchannel length ratio, ΨL, the thermal resistance is also inversely proportional to the bifurcation ratio, ΨN. In addition, Figure 5 represents the relationship between thermal resistance and pumping power P. According to Figure 5(b), the thermal resistance decreases within increasing pumping power for all cases. For a given microchannel number ratio, ΨN, the overall thermal resistance of the bifurcating microchannel with a shorter length of the first segment (Cases 4 and 5) is always lower than that with a longer length of the first segment (Cases 2 and 3) at identical pumping power.
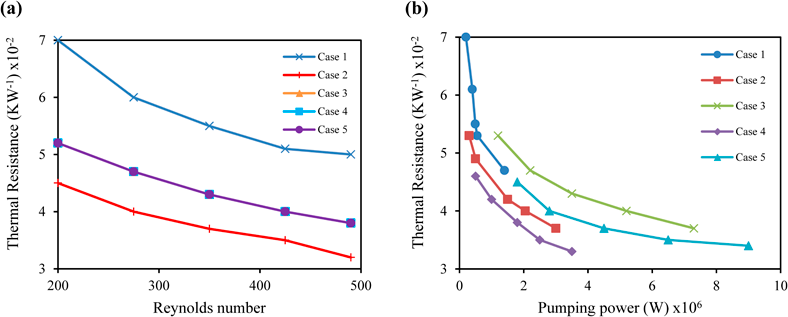
Figure 5 Overall thermal resistances (KW-1) of microchannel heat sinks with (a) the inlet Reynolds Number from 200 to 500 and (b) the required pumping power [17]. The thermal resistance values are multiples of 10-2 and the pumping power values are multiples of 106.
This analysis indicates that the thermal performance of the microchannel heat sink operates more efficiently with bifurcations, as splitting the flow will reduce more the thermal resistance when compared to a singular continuous microchannel. However, this justification is only applicable if the bifurcations are designed considering other variables, such as the pumping power. As the demand for pumping power increases, the overall thermal performance of the inlet design can be assessed to identify an ideal bifurcation design i.e. an ideal balance between a low thermal resistivity and a low required pumping power [25]. From Figure 6, we can conclude that at a constant pumping power, the two-stage bifurcation microchannel with shorter plate at the back (Cond. 4) of the sub-microchannel provides lower overall thermal resistance than the other type of two-stage bifurcation microchannel.
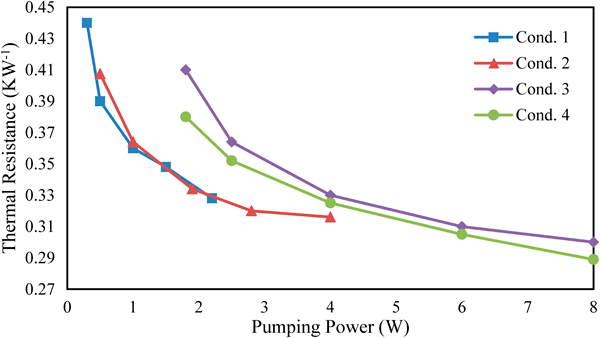
Figure 6 Overall thermal performance in KW-1 of various constructal inlet designs for bifurcated microchannels [25].
To summarise, bifurcated microchannel heat sinks with a larger bifurcation ratio may be better for heat dissipation given the length ratio is fixed [17]. The drawback of this attribute is the requirement of a greater pumping power which invalidates the initial purpose of optimisation. To avoid this drawback, the implementation of two bifurcation by placing a short plate at the back of the microchannel which splits the flow into two can reduce the pumping pressure required as shown in Cond. 4 in Figure 6 [25]. Therefore, an amalgamation of a larger bifurcation ratio and an optimal constructal inlet design will result in an idealised heat sink.
3.2 Non-Uniformly Structured Microchannels & Heat Transfer Performance
In reference to Eq. 6, when u and v are unchanging across iterations, the Re becomes dependant on bifurcation length only. From Figure 3(a), Figure 5(a) and (b), it can be noted that a lower Reynolds number implies less pumping power and input voltage is needed, creating an overall more thermodynamically efficient system, particularly if energy efficient fins are attached to the heat sink. Across the investigated experiments, a Reynolds number at or between 150 and 200 performed best. The topologies that correspond to these Reynolds numbers are non-uniformly structured, having branched microchannels, and small islands throughout, as can be seen in Figure 7(a) and (b). The organic shape arrangements led to a lower maximum surface temperature, Tsurface, when compared to inorganic shape designs, e.g. parallel microchannels, shown in Figure 7(c).
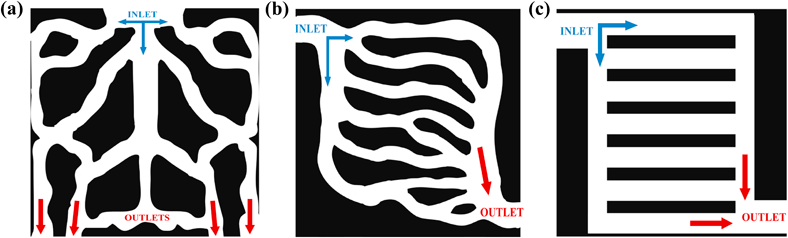
Figure 7 (a), (b) and (c) are schematics of competing microchannel designs, indicating coolant flow direction from inlet to outlet. Considered here are the conventional, parallel microchannel design in (c), and the non-periodic river-like microchannel designs in (a) and (b) [20, 22].
In the case of Figure 7(a) versus Figure 7(c), the Tsurface of (a) maximised at 349.38 ºK, which is 8.1% lower than that of the uniform parallel microchannel, which maximised at 380.16 ºK. Agreeing further, in the case of Figure 7(b) versus Figure 7(c), the Tsurface of (b) maximised at 335.65 ºK, which was 11.7% lower than that of the uniform parallel microchannel. These promising results can be attributed to the improved flow rate that non-uniform microchannels can provide. The lack of an organic-like flow design in Figure 7(c) results in heat accumulation along three of the seven parallel microchannels. This heat does not egress out of the system via the coolant, but rather, transfers out of the system through the surroundings as waste heat. Although the fin design of the heat sink is also very important in redirecting waste heat, these investigations have showed that an average 9.9% reduction in surface heat is achievable when adjusting solely the microchannels’ topology. From this, it can be understood that, both the quantity of and length of bifurcations, positively impact the thermal performance of the heat sink module.
Figure 8 below illustrates the temperature changes of six cases where bifurcations have been added to the microchannels along the streamwise direction Z. The complete length of the microchannels from left to right is 35 mm, with a constant width of 1.3 mm. Where a vertical is present on the horizontal axis, there is a bifurcation in the microchannel. Note that not all cases utilise all bifurcations. In Case 1, there is no bifurcation present, i.e. a single flow microchannel. For Cases 2 and 3, a single bifurcation is added but the distance from the inlet is altered. Cases 4 and 5 apply the same conditions however with two bifurcations. Finally, Case 6 has three bifurcations, evenly spread along the microchannel. The results from this experiment imply that when fluid flow is disrupted within the microchannels, i.e. bifurcated, the local heat transfer coefficient is increased.
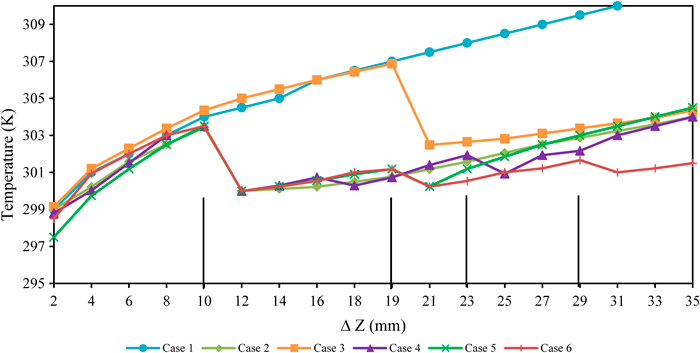
Figure 8 Recorded temperatures along the streamwise direction Z, from inlet on the left to outlet on the right, for six different cases. The horizontal axis ∆Z, represents the distance away from the inlet. The width of each microchannel is 1.3 millimetres. The bifurcations are represented on the horizontal axis as vertical bars [16].
When utilising Eq. 5, we can analyse how the topology of the microchannel improves thermal performance. Taking the average hm from each case, where the areas and temperatures are calculated per section, with an overall Q of 300 W, a positive trend is attained as is shown in Figure 9(a) below. The cases are defined as follows: Case 1 had no bifurcations (single continuous microchannel), Case 2 had 1 bifurcation with a length ratio of 3:7, Case 3 had 1 bifurcation with a length ratio of 6:4, Case 4 had 2 bifurcations with a length ratio of 3:4:3, Case 5 had 2 bifurcations with a length ratio of 3:3:4, and Case 6 had 3 bifurcations with a length ratio of 3:3:3:1. An R2 value of 0.9833 is attained from the data for Figure 9(a), suggesting that there may be an outlier. However, the information is only calculated over six data points, implying that the expected hyperbolic fit may be correct should more data be obtained. Quick comparison of Figure 8 and Figure 9(a) shows that cases with lower temperature gradients do produce higher heat transfer coefficients, agreeing with Eq. 5. However, further study is required to observe more valid results.
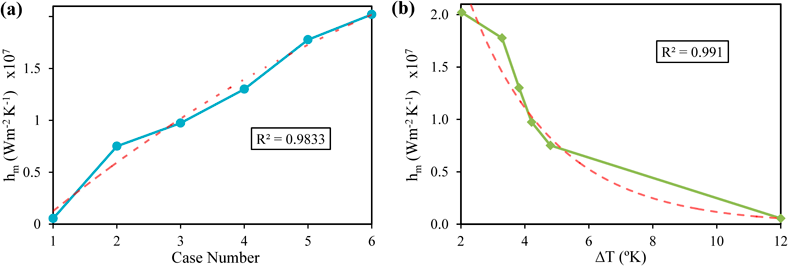
Figure 9 (a) illustrates the heat transfer coefficient versus case number. The cases are defined as follows: Case 1 had no bifurcations (single continuous microchannel), Case 2 had 1 bifurcation with a length ratio of 3:7, Case 3 had 1 bifurcation with a length ratio of 6:4, Case 4 had 2 bifurcations with a length ratio of 3:4:3, Case 5 had 2 bifurcations with a length ratio of 3:3:4, and Case 6 had 3 bifurcations with a length ratio of 3:3:3:1. Figure 9. (b). illustrates the temperature gradient across each bifurcation and the corresponding heat transfer coefficient. As expected, it follows a hyperbolic curve, implying that the smaller the difference between the inlet and outlet temperatures, the greater capacity of the system to dissipate heat. The heat coefficients values are multiples of 107.
As illustrated in Figure 9(a), the heat transfer coefficient hm increases with the number of bifurcations, and the more evenly spread out they are along the microchannel. Revisiting Eq. 5, it can be assumed that the increase in the thermal performance is attributed to the redistribution of heat that occurs when a fluid flow is disrupted. This can be seen in Figure 8, where the coolant temperature immediately drops at a bifurcation in the microchannel.
Not only is hm dependant on contact area, but it is also dependant on the temperature difference across the bifurcation. Considering hm follows a hyperbolic curve in Figure 9(b), it can be assumed that as the temperature difference across the microchannel approaches 0, the coefficient increases exponentially. Realistically, the temperature difference cannot be exactly 0 as the laws of thermodynamics disallow this, hence, there must be a limit to the heat dissipation capacity of the system. An R2 value of 0.991 is attained from the data for Figure 9(b), suggesting that Eq. 5 correctly models this system. More data points are needed to further validate the experiments.
Combining the information from Figures 7 – 9, and Eq. 5, the bifurcations and microchannel topology heavily influence the overall thermal performance of the heat sink. Furthermore, when accounting for the Reynolds number in Eq. 6 and knowing that a lower Re improves thermal performance, should the kinematic viscosity of the fluid (v) be constant, the Re will reduce when the length L of the microchannel reduces, and/or when the fluid velocity (u) reduces. Qualitatively, the data agrees with and is coherent with the theory provided by the literature.
3.3 Coolant
Coolants are passed through a heat sink at a constant rate to collect the heat and then remove it from the system. As mentioned previously, the heat sink in the AWG system is placed at the hot side of the TEC in order to dissipate and remove some of the waste heat from the system. The ideal coolant would have a low thermal resistance and a high thermal conductivity and viscosity such that liquid would absorb the waste heat and carry it away from the TEC. A high inlet flow velocity increases the performance of the heat sink; however, it also requires a higher pumping power. The pumping power also increases as the viscosity of the coolant increases, due to a liquid with low viscosity not being able to flow as quickly as one with a higher viscosity. Seven different coolants have been compared through analysing the aforementioned properties utilising experimental data from five articles.
| Coolant Type | Density(kg m-3) | Specific Heat Capacity(J kg-1 K-1) | Thermal Conductivity(W m-1 K-1) | Dynamic Viscosity(kg m-1 s-1) |
|---|---|---|---|---|
| Water | 998.00 | 4181.0 | 0.6060 | 0.9580 |
| Galinstan | 6440.0 | 295.00 | 16.500 | 2.4000 |
| Nanofluid | 1393.4 | 2963.5 | 0.6870 | 0.8500 |
| TiO2/H2O Nanofluid | 4250.0 | 686.20 | 8.9530 | - |
| Al2O3/ H2ONanofluid | - | - | - | - |
| Transcritical CO2 | - | - | - | - |
| Supercritical CO2 | - | - | - | - |
Table 3 demonstrates that the coolants TiO2/water nanofluid [28], nanofluid [27] and EGalSn [27], all possess properties which should allow them to perform as a more superior coolant than water. Galinstan has the highest thermal conductivity of all the coolants with data provided making it a better coolant than the nanofluid tested in the same paper. The TiO2/H2O nanofluid coolant also has a high thermal conductivity although still not as high as that of Galinstan. The Galinstan has a much higher dynamic viscosity than the water and nanofluid meaning the pumping power required to effectively pump the coolant through the system would be greater. The TiO2/H2O nanofluid’s dynamic viscosity was not provided and thus, it cannot be concluded from this data whether it is a more suitable coolant than the Galinstan.
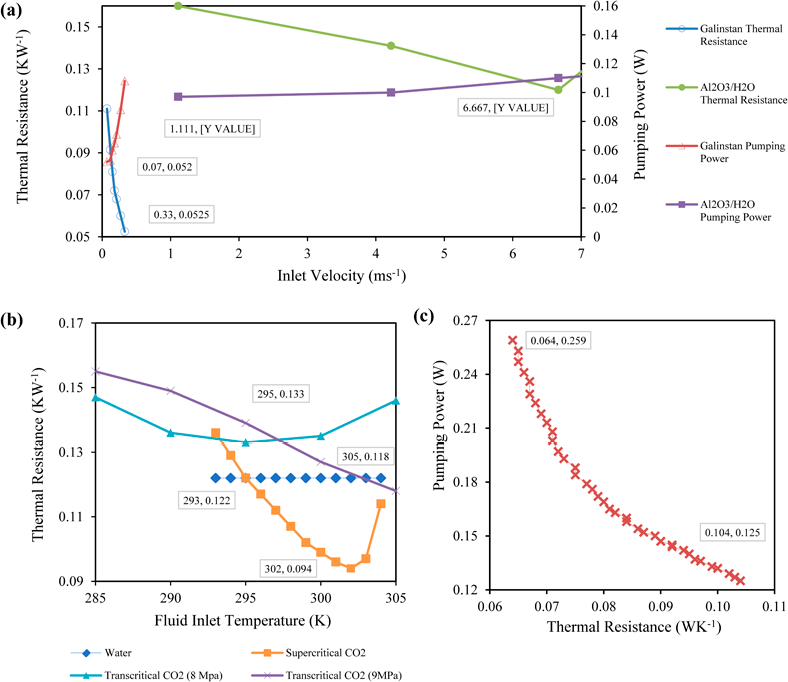
Figure 10 (a) The maximum and average pumping power required and thermal resistances of Al2O3/water nanofluid coolant and Galinstan are plotted against the liquid flow rate [29] [27] (b) The thermal resistance of water, supercritical CO2, transcritical CO2 at 8 MPa, and transcritical CO2 at 9 MPa, are plotted against the fluid inlet temperature [26, 30] (c) The required pumping power of supercritical CO2 is plotted against the thermal resistance [30].
In Figure 10(a) above, the cross-sectional area of the microchannel is stated as 1 x 1.5 x 50 mm = 0.0075 cm3 for the Al2O3/H2O Nanofluid coolant [29]. The fluid flow rate can be converted to the velocity by executing the following equation:
This allowed for a more direct comparison of the effect of the coolant’s velocity of the thermal resistance for Figure 10(a). Figure 10(a) demonstrates that as the velocity is increased, the thermal resistance of the coolant decreases and whilst the comparison cannot be completely direct as the velocities at which the thermal resistance was tested were vastly different, the thermal resistances recorded for the Galinstan coolant were far lower than that of the Al2O3/H2O Nanofluid coolants. As previously mentioned, the lower the thermal resistivity in the heat sink, the more efficient the heat sink. Thus, through this comparison of the thermal resistivity of Al2O3/H2O Nanofluid and Galinstan as depicted in Figure 10(a), it can be determined that Galinstan, with a minimum recorded thermal resistance of approximately 0.054 K W-1, would act as a superior coolant to Al2O3/H2O Nanofluid which has a minimum recorded thermal resistance of approximately 0.08 K W-1. Conversely, the pumping power increases as the velocity increases however, a low pumping power is ideal for a high efficiency heat sink. Although the minimum point of thermal resistance corresponds with the higher velocity and pumping power for Figure 10(a), the Galinstan coolant remains the better coolant with a lower maximum pumping power of 0.001 W than Al2O3/H2O Nanofluid at all concentrations with a maximum pumping power of 0.11 W.
Figure 10(b) above illustrates the effect of the fluid inlet temperature on the thermal resistance of water, supercritical CO2, transcritical CO2 at a pressure of 8 MPa and transcritical CO2 at a pressure of 9 MPa. From this direct comparison it is demonstrated that the thermal resistance of water is unaffected by change in the coolant inlet temperature while all variations of CO2 coolant are. This result suggests that supercritical CO2 would be the most suitable coolant in for the heat sink with the lowest recorded thermal resistivity of 0.094 K W-1.
Figure 10(c) depicts the effect of the thermal resistance on the pumping power of supercritical CO2 at a velocity of 2 m s-1 [30] and thus can be compared against Figure 10(b) to determine whether supercritical CO2 or Galinstan is the most superior coolant for the heat sink. In Figure 10(b), at the lowest point of thermal resistance, 0.054 K W-1 for Galinstan, the pumping power is at a maximum of 0.001 W. From Figure 10(c), the lowest point of thermal resistance for supercritical CO2 is 0.064 K W-1 where the pumping power is also at a maximum, at approximately 0.277 W. These values demonstrate that to achieve a low thermal resistivity, supercritical CO2 requires approximately 0.276 W more pumping power than the Galinstan coolant.
3.4 Optimal operation characteristics of Peltier device
The experimental results from the below studies show that the ambient temperature and relative humidity of the air around the Peltier device are the largest factors which determine the water production rate. Trends indicate higher relative humidity and higher airflow rate leads to an increase in water production [5, 9]. This leads to the explanation that the cold side temperature of the Peltier device, Tc, is lower with increasing airflow, which is demonstrated by the works of Shourideh et al., Kadhim et al. and Eslami et al. [5, 9, 10].
Comparing experimental data from Jradi et al. and Joshi et al. [31, 32] show the water production rate is clearly shown to increase with increasing current. Figure 11 displays this relationship. Due to the difference in cold side area and number of TEC’s used in experimentation, the nominal rate of water production is drastically different however the trend remains relatively similar.
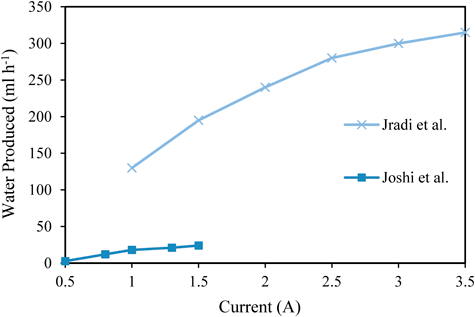
Figure 11 Water production in ml h-1 with regards to varied current for two experimental cases. Jradi et al. used 20 5 x 5cm area TEC modules at an ambient temperature Ta = 28 ºC, while Joshi et al. used 10, 4 x 4 cm TEC modules at Ta = 30 ºC. Both results show a similar trend in that water production increases with increasing current [31, 32].
Figure 12 shows COP versus input current to two difference Peltier device models. The trend remains similar across models, with the COP peaking at lower input currents and slowly dropping off as current increases. The COP has a dramatically smaller peak for larger difference in temperature across the Peltier device, denoted ΔT, demonstrated by Eslami et al. [9] in Figure 12(a) and (b). The cooling capacity slowly increases with current and is increased with a decrease in . These results indicate it is imperative to achieve the smallest ΔT to improve the overall efficiency as both the cooling capacity and power efficiency increase with decreasing ΔT.
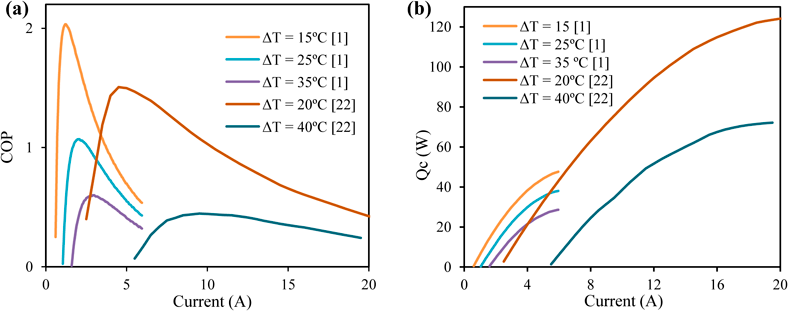
Figure 12 The (a) COP and (b) Qc trend versus input current for a range of ΔT based off simulated data from Shourideh et al. and Eslami et al. [5, 9], using different TEC module parameters.
Furthermore, both Figure 11 and Figure 12 suggests an optimal current should be verified experimentally on a case by case basis. While the COP decreases with increasing current, an optimal operational current can be determined by finding a midpoint between the peak of the COP and peak of Qc.
4. Conclusions
This meta-analysis was conducted with the aim of investigating how the efficiency of a heat sink for Peltier devices could be optimised for use in Atmospheric Water Generators. A review of various experimental results established that decreasing the temperature differential between the TEC hot and cold sides (ΔT), in conjunction with cooling the hot side close to the ambient temperature, is directly related to achieving higher water production. Therefore, the characteristics of a high performing liquid-cooled microchannel heat sink has been investigated to increase the efficiency of TEC based AWGs. The optimisation suggestion is based on three parameters: microchannel topology, bifurcation geometry, and coolant type. Additionally, the operating characteristics, such as the pumping power, of the TECs used in AWGs is assessed.
Xie et al. [17] found that the increase in bifurcation ratio of the microchannel at a fixed length provided better heat dissipation results. However, the increased ratio also demanded greater pumping power, defeating the purpose of optimisation. Our study found that the addition of a short plate at the back of the sub-microchannel i.e. the constructal design as described by Zhang et al. [25] lowers the thermal resistance within the microchannel.
This meta-study has also shown that the topology of the heat sink is directly linked to the thermal performance of the Peltier device. Non-periodic microchannel designs have shown an impressive ability to redistribute and regulate heat more efficiently than conventional designs. Li et al. [20] suggest that a Reynolds number between 150 and 200 is most efficient, and by extending on this suggestion, this investigation has shown that fluid flow velocity and bifurcation dimensions are responsible for the topology’s thermal performance. This led to the conclusion that the heat transfer coefficient hm of non-periodic designs, on average, will decrease the surface temperature of the Peltier device by 9.9% and significantly improve efficiency.
An investigation into how water, Al2O3/H2O Nanofluid, TiO3/H2O Nanofluid, nanofluid, Transcritical CO2, Supercritical CO2 and Galinstan performed as a heat sink coolant in microchannel heat sinks was conducted by analysing data from various papers graphically. Through this analysis, it was found that Galinstan is the most efficient coolant type of those studied. This is due to its high viscosity (2.4 kg m-1s-1), and high thermal heat conductivity (16.5 W m-1K-1), when compared to a range of typical coolants, surpassing them by 7.547 W m-1K-1. Moreover, Galinstan requires extremely low pumping power (0.001 W) to achieve its minimal thermal resistance. This coolant proffers a significant addition to the optimised bifurcated heat sink microchannels, greatly enhancing the cooling ability and thus, the overall efficiency of the AWG.
Conclusively, this study suggests that the novel combination of a multi-bifurcated topology, utilising Galinstan for the liquid coolant, at a maximum flow rate, will produce a highly efficient heat sink for use in an AWG system.
Acknowledgments
We, the authors, would like to thank for, and acknowledge the invaluable support and guidance provided to us by Dr. Jurgen Schulte, Blake Regan, and Brendan Boyd-Weetman, from the School of Mathematical and Physical Sciences at The University of Technology Sydney.
References
[1] Salehi AA, Ghannadi-Maragheh M, Torab-Mostaedi M, et al. A review on the water-energy nexus for drinking water production from humid air. Renewable and Sustainable Energy Reviews 2020; 120: 1–20. https://doi.org/10.1016/j.rser.2019.109627
[2] Milani D, Abbas A, Vassallo A, et al. Evaluation of using thermoelectric coolers in a dehumidification system to generate freshwater from ambient air. Chemical Engineering Science 2011; 66: 2491–2501. https://doi.org/10.1016/j.ces.2011.02.018
[3] Bortolini M, Gamberi M, Graziani A, et al. Refrigeration System Optimization for Drinking Water Production Through Atmospheric Air Dehumidification. 2015, pp. 259–280. https://doi.org/10.1007/978-3-319-16709-1_18
[4] He W, Yu P, Hu Z, et al. Experimental Study and Performance Analysis of a Portable Atmospheric Water Generator. Energies; 13. Epub ahead of print 2020. DOI: 10.3390/en13010073.
[5] Shourideh AH, Ajram WB, Lami J al, et al. A comprehensive study of an atmospheric water generator using Peltier effect. Thermal Science and Engineering Progress 2018; 6: 14–26. https://doi.org/10.1016/j.tsep.2018.02.015
[6] Alhaj M, Al-Ghamdi SG. Why is powering thermal desalination with concentrated solar power expensive? assessing economic feasibility and market commercialization barriers. Solar Energy 2019; 189: 480–490. https://doi.org/10.1016/j.solener.2019.07.046
[7] Suryaningsih S, Nurhilal O. Optimal design of an atmospheric water generator (AWG) based on thermo-electric cooler (TEC) for drought in rural area. In: AIP Conference Proceedings. Epub ahead of print 2016. DOI: 10.1063/1.4941874.
[8] Tijani IB, al Hamadi AA, ASS Al Naqbi K, et al. Development of an automatic solar-powered domestic water cooling system with multi-stage Peltier devices. Renewable Energy 2018; 128: 416–0. https://doi.org/10.1016/j.renene.2018.05.042
[9] Eslami M, Tajeddini F, Etaati N. Thermal analysis and optimization of a system for water harvesting from humid air using thermoelectric coolers. Energy Conservation and Management 2018; 174: 417–429. https://doi.org/10.1016/j.enconman.2018.08.045
[10] Kadhim TJ, Abbas AK, Kadhim HJ. Experimental study of atmospheric water collection powered by solar energy using the Peltier effect. In: IOP Conf. Series: Materials Science and Engineering 671 0212155. 2020. Epub ahead of print 2020. DOI: 10.1088/1757-899X/671/1/012155.
[11] Stewart JW. Peltier effect. AccessScience. Epub ahead of print 2019. DOI: 10.1036/1097-8542.495500.
[12] He W, Zhang G, Zhang X, et al. Recent development and application of thermoelectric generator and cooler. Applied Energy 2015; 143: 1–25. https://doi.org/10.1016/j.apenergy.2014.12.075
[13] Venkatesan K, Venkataramanan · M. Experimental and Simulation Studies on Thermoelectric Cooler: A Performance Study Approach. International Journal of Thermophysics; 41. Epub ahead of print 2020. DOI: 10.1007/s10765-020-2613-2.
[14] Nandy A, Saha S, Ganguly S, et al. A Project on Atmospheric Water Generator with the Concept of Peltier Effect. International Journal of Advanced Computer Research 2014; 4: 481–486.
[15] Fulks JR. Dew point. AccessScience. Epub ahead of print 2019. DOI: 10.1036/1097-8542.189700.
[16] Xie G, Zhang F, Sundén B, et al. Constructal design and thermal analysis of microchannel heat sinks with multistage bifurcations in single-phase liquid flow. Applied Thermal Engineering 2013; 62: 791–802. https://doi.org/10.1016/j.applthermaleng.2013.10.042
[17] Xie G, Chen Z, Sunden B, et al. Numerical Analysis of Flow and Thermal Performance of Liquid-Cooling Microchannel Heat Sinks with Bifurcation. Numerical Heat Transfer, Part A: Applications 2013; 64: 902–919. https://doi.org/10.1080/10407782.2013.807689
[18] Muhammad A, Selvakumar D, Wu J. Numerical investigation of laminar flow and heat transfer in a liquid metal cooled mini-channel heat sink. International Journal of Heat and Mass Transfer 2020; 150: 1–9. https://doi.org/10.1016/j.ijheatmasstransfer.2019.119265
[19] Ramos-Alvarado B, Li P, Liu H, et al. CFD study of liquid-cooled heat sinks with microchannel flow field configurations for electronics, fuel cells, and concentrated solar cells. Applied Thermal Engineering 2011; 31: 2494–2507. https://doi.org/10.1016/j.applthermaleng.2011.04.015
[20] Li H, Meng F, Jing D, et al. Optimal design and thermal modelling for liquid-cooled heat sink based on multi-objective topology optimization: An experimental and numerical study. International Journal of Heat and Mass Transfer 2019; 144: 1–18. https://doi.org/10.1016/j.ijheatmasstransfer.2019.118638
[21] Ghani IA, Sidik NAC, Kamaruzaman N. Hydrothermal performance of microchannel heat sink: The effect of channel design. International Journal of Heat and Mass Transfer 2017; 107: 21–44. https://doi.org/10.1016/j.ijheatmasstransfer.2016.11.031
[22] Koga AA, Comini E, Lopes C, et al. Development of heat sink device by using topology optimization. International Journal of Heat and Mass Transfer 2013; 64: 759–772. https://doi.org/10.1016/j.ijheatmasstransfer.2013.05.007
[23] Benson T. Reynolds Number. National Aeronautics and Space Administration, United States of America, https://www.grc.nasa.gov/WWW/BGH/reynolds.html (2014, accessed April 27, 2020).
[24] Klein D, Hetsroni G, Mosyak A. Heat transfer characteristics of water and APG surfactant solution in a micro-channel heat sink. International Journal of Multiphase Flow 2005; 31: 393–415. https://doi.org/10.1016/j.ijmultiphaseflow.2005.01.007
[25] Zhang R, Chen Z, Xie G, et al. Numerical Analysis of Constructal Water-Cooled Microchannel Heat Sinks with Multiple Bifurcations in the Entrance Region. Numerical Heat Transfer, Part A: Applications 2014; 67: 632–650. https://doi.org/10.1080/10407782.2014.937286
[26] Leng C, Wang X-D, Yan W-M, et al. Heat transfer enhancement of microchannel heat sink using transcritical carbon dioxide as the coolant. Energy Conversion and Management 2015; 110: 154–164. https://doi.org/10.1016/j.enconman.2015.12.006
[27] Muhammad A, Selvakumar D, Wu J. Numerical investigation of laminar flow and heat transfer in a liquid metal cooled mini-channel heat sink. International Journal of Heat and Mass Transfer 2020; 150: 1–9. https://doi.org/10.1016/j.ijheatmasstransfer.2019.119265
[28] Ghasemi SE, Ranjbar AA, Hosseini MJ. Forced convective heat transfer of nanofluid as a coolant flowing through a heat sink: Experimental and numerical study. Journal of Molecular Liquids 2017; 248: 264–270. https://doi.org/10.1016/j.molliq.2017.10.062
[29] Ho CJ, Chen W-C, Yan W-M, et al. Contribution of hybrid Al2O3-water nanofluid and PCM suspension to augment thermal performance of coolant in a minichannel heat sink. International Journal of Heat and Mass Transfer 2018; 122: 651–659. https://doi.org/10.1016/j.ijheatmasstransfer.2018.01.121
[30] Sarkar J. Improving thermal performance of micro-channel electronic heat sink using supercritical CO2 as coolant. Thermal Science 2019; 23: 243–253. https://doi.org/10.2298/tsci161110030s
[31] Joshi VP, Joshi VS, Kothari HA, et al. Experimental investigations on a portable fresh water generator using a thermoelectric cooler. In: International Conference on Recent Advancement in Air Conditioning and Refrigeration. Bhubaneswar, 2017, pp. 161–166. https://doi.org/10.1016/j.egypro.2017.03.085
[32] Jradi M, Ghaddar N, Ghali K. Experimental and theoretical study of an integrated thermoelectric–photovoltaic system for air dehumidification and fresh water production. International Journal of Energy Research 2012; 36: 963–974. https://doi.org/10.1002/er.1848