PAM Review: Energy Science & Technology, Vol. 6
ISSN 2205-5231 | Published by UTS ePRESS | https://epress.lib.uts.edu.au/student-journals/index.php/PAMR/index
A Meta Study of the Relationship Between Phase Change Material Parameters and Temperature Reduction in Fire Fighter Protective Clothing
Josef Richmond1*, Lesley Spencer2, Tommy Tran3 and Evan Williams4
University of Technology Sydney, Faculty of Science, PO Box 123, Ultimo NSW 2017, Australia
1Josef.Richmond@student.uts.edu.au
2Lesley.P.Spencer@student.uts.edu.au
3Tommy.Tran@student.uts.edu.au
4Evan.Williams-1@student.uts.edu.au
*Corresponding author: Josef Richmond, University of Technology Sydney, Faculty of Science, PO Box 123, Ultimo NSW 2017, Australia; Josef.Richmond@student.uts.edu.au
DOI: https://doi.org/10.5130/pamr.v6i0.1545
Citation: Richmond, J., Spence, L., Tran, T., and Williams, E. 2019. A Meta Study of the Relationship Between Phase Change Material Parameters and Temperature Reduction in Fire Fighter Protective Clothing. PAM Review: Energy Science & Technology, 6, Article ID 1545. https://doi.org/10.5130/pamr.v6i0.1545
© 2019 by the author(s). This is an Open Access article distributed under the terms of the Creative Commons Attribution 4.0 International (CC BY 4.0) License (https://creativecommons.org/licenses/by/4.0/), allowing third parties to copy and redistribute the material in any medium or format and to remix, transform, and build upon the material for any purpose, even commercially, provided the original work is properly cited and states its license.
Abstract
Firefighters are exposed to high risk scenarios in which the prevention of extreme heat injuries is largely dependent on the effectiveness of their protective clothing. The following meta-study examines contemporary literature to determine the usefulness of phase change materials (PCM’s) in improving the effectiveness of the current firefighter protective clothing (FFPC) model in order to better protect firefighters. The time-temperature for multiple PCM’s in environments with low, medium and high heat fluxes (taken as 2.5-5 kW/m2 for 700 seconds, 10-15 kW/m2 for 300 seconds and 20-40 kW/m2 for 30 seconds respectively) were compared in terms of the rate of temperature increase and final temperature. The study found that PCM I produced the best temperature reduction in a low flux, PCM K did so in a medium flux, and PCM B did so in a high flux. The study also found that overall the PCMs were most effective in a low flux, therefore further study should be directed towards creating PCMs that are more effective in high-flux environments.
Keywords
Phase Change Material; Fire Fighter Protective Clothing; Heat Flux
Glossary
1. Introduction
1.1 Firefighter Protective Clothing
Classified by Gupta [1] as environmental hazard protective functional clothing, FFPC or turnout gear typically consists of 3 layers; the thermal liner, the moisture barrier and the outer shell. The thermal liner is closest to the skin and is a blend of facecloth and batting [2]. See Figure 1. It is responsible for keeping the firefighter from overheating, and typically consists of multiple layers of woven cloth with the batting sewed onto it [3]. The moisture barrier functions as protection against liquid hazards such as fuel while also allowing moisture to move away from the wearer and is often made from an engineered membrane laminated to a substrate [3]. Firefighter protective clothing must fulfil two main roles: physical protection and thermal protection. The physical aspect of FFPC is relevant to hazards such as debris, chemical spills and other sources of mechanical damage. Thermal protection refers to reducing negative effects of prolonged exposure to high temperature environments and is the more important factor in terms of preventing heat-related injuries [4]. Between 2011-2015 there was an average of 70,000 global fire-related injuries and deaths, according to the International Association of Fire and Rescue Services (CTIF) [5], which improvements to the FFPC model will help reduce.
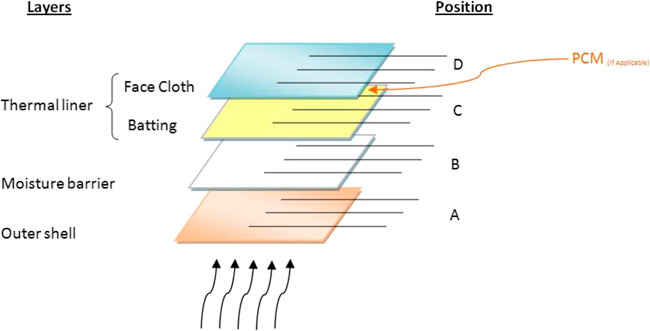
Figure 1 FFPC structure, including thermocouple positions for measuring temperature [2].
1.2 Current Research
Current research into the application of phase change materials in the FFPC system is still in the initial stages and seeks to determine the effectiveness of the material’s inclusion compared to traditional firefighter protective suits. The experimental methods and categories of data collected by PCM researchers are not standardized, so comparison and extrapolation of future directions is not a simple task, and this meta-study aims to in part to rectify this by comparing a simple yet important relationship: temperature as a function of time. A large portion of the data used in this meta study has been produced by numerical models, see Figure 2, for a representative example of the regions through which heat transfer is numerically modelled by the finite difference approximation method. [6][7]

Figure 2 Diagram of the FFPC regions modelled with the finite difference approximation method. The specific method is the Crank-Nicolson method used to numerically approximate the governing second order partial differential heat transfer equation [6]. Figure adapted from [6].
1.3 Phase Change Materials
The term phase change refers to the transition of matter state for a substance and a material is referred to as a PCM when it either naturally possesses, or is designed to have, a high latent heat [8]. The phase change referred to throughout this study is from solid to liquid. During a phase change, energy is used purely for transition, meaning there is a period of time where no temperature change occurs [9]. When applied to the FFPC this buffer period of constant temperature has the benefit of both decreasing the rate of body temperature rise and potentially increasing the amount of time an operator can remain in the aforementioned environments [10].
In order for PCMs to be viably implemented, the specific phase change explored in this meta-study is the solid-to-liquid transition for several reasons. The first is that for conventional PCM bases such as paraffin and group 1 & 2 metal salts (thermodynamic data has been collated in Appendix A for reader convenience), the melting point is closest to the temperatures experienced by firefighters during their activities [11][See Appendix A]. The second consideration is spatial in nature, as PCM’s incorporated into a FFPC system must be “encapsulated or bound by a thin layer of polymeric or any other material so that the phase transition can be accomplished inside a controlled environment” [12].
2. Methodology
The data collected as part of this study was sourced through the UTS Library database hub, which includes journals such as SCOPUS, Springer, Web of Science and ProQuest. Sources were found by using combinations of the keywords “phase change material”, “firefighter”, “FFPC”, “thermal” and “extreme environment clothing”. To ensure that our sources were relevant, the search was constrained to technical publications that were produced in the period 2009-2019. Papers with relevant quantitative data were refined to include on those with time temperature profiles for PCM Containing FFPC exposed to the three classes of heat flux. Literature with qualitative information on modelling methods and classifications/standards was also incorporated into this meta-study.
Each paper has a unique definition for each of the three classes of fire environments, whilst they all fall within the previously mentioned ranges, this has necessitated a method for standardizing the data from each publications result. Temperature values for specific times – 5 minutes for low flux, 2.5 minutes for medium flux and 0.5 minutes for low flux – have been extracted from graphs provided for each paper and their associated PCM’s. An online data point extractor “WebPlotDigitiser” which allows for the extraction of specific data points from pictures of graphs was used for this collection. The final temperature at the end of the PCM’s exposure to each heat flux is then graphed against three material parameters – latent heat, specific heat and melting temperature. This enables the identification of possible relationships between the aforementioned parameters and their performance in each of the heat environments.
3. Results and Discussion
In the low flux environment, the impact of the phase change is typically evident. Starting at 100-200s for the majority of samples, the phase change reduces the gradient of the time temperature curve. This effect agrees with the assumption that the constant temperature period produced by the PCM will result in a lower final temperature. In this case PCM C has the highest final temperature, conversely, PCM I has the lowest final temperature, excluding PCM K.
The time-temperature profiles for PCM’s exposed to a medium heat flux similarly show the signature gradient decrease when the phase change begins at 25-50s. In this environment the phase change begins in approximately half the time it takes in the low flux environment, however the reduction in slope is also less pronounced. PCM K shows the lowest final temperature, less than half of PCM E-A. This may be a result of PCM K’s substantially higher latent heat.
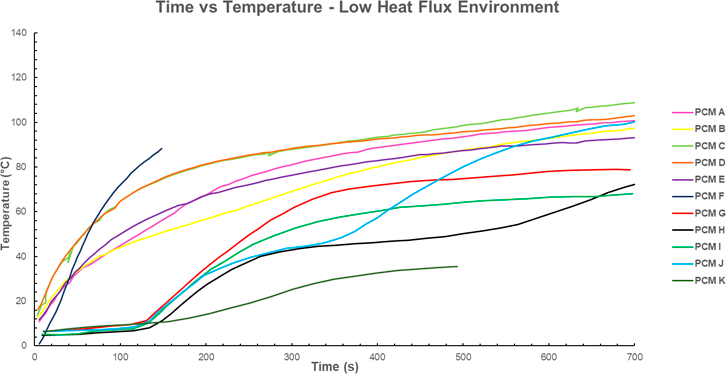
Figure 3 Time temperature profile for various PCM’s. Low Flux (2.5-5 kW/m^2 for 700s). Data for PCM A-E from [6]; PCM F sourced from [13], data for PCM G-J sourced from [14], Data for PCM K sourced from [7]. Note that PCM F has been exposed to the heat flux for only 150s. When comparing the temperatures at 150s, PCM F is significantly hotter (≈90ºC) than the alternatives. Similarly, the exposure for PCM K only lasts for 490s. When comparing PCM’s at this time, PCM K hast the lowest temperature (≈35-40ºC).
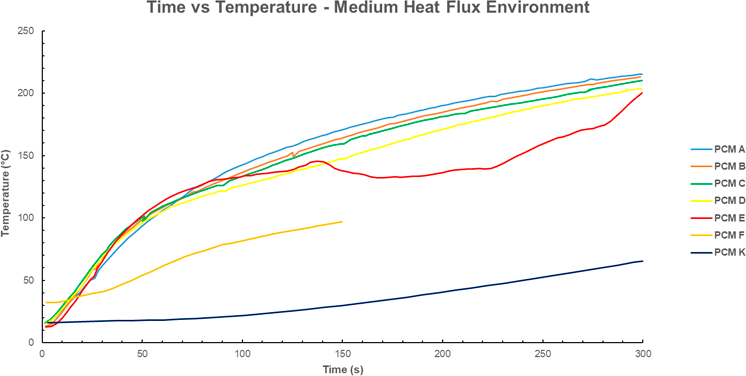
Figure 4 Time temperature profile for various PCM’s. Medium heat flux (10-15 kW/m^2 for 300 seconds). Data for PCM A-E from [6]; data for PCM F sourced from [13], Data for PCM K sourced from [7]. Note that PCM F has been exposed to the heat flux for only half the time as PCM A-E. When comparing the temperatures at 150s, PCM F is significantly cooler (≈100ºC) than the alternatives. Note that PCM G-M have not been plotted as there is no time temperature profile for the medium flux in the source document.
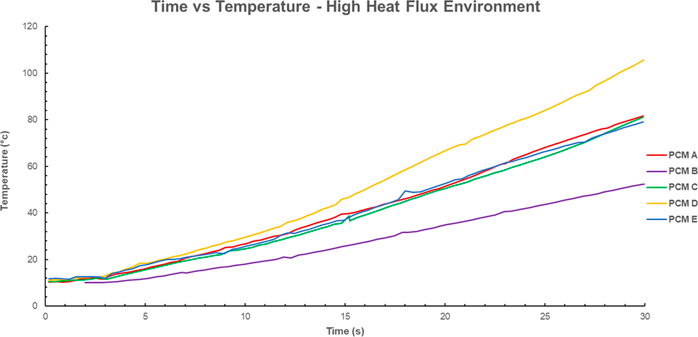
Figure 5 Time temperature profile for various PCM’s. High heat flux (20-40 kW/m^2 for 30 seconds). Data for PCM A-E from [6]. Note that PCM F-N have not been plotted as there is no time temperature profile for the high flux in the source document.
The time-temperature profiles in the high flux environment show no apparent effect of the phase change, rather the slope begins to increase with time. This corroborates the assumption the PCM’s are less effective in high heat fluxes and demonstrates that higher latent heats are required to make an impact on the heat transfer behavior of FFPC in this environment.
The inversely proportional relationship between the specific heat and final temperature of the PCM’s is evident only in the medium heat flux. There appears to be no correlation between the two quantities when considered in the low and high flux environments, see Figure 6. This indicates that the only contribution of specific heat to the effectiveness of the PCM is the addition of mass increasing the heat required for a temperature rise. Considering that no trend is obvious in the low and high flux environments, more data is required to confidently determine a relationship between the two quantities.
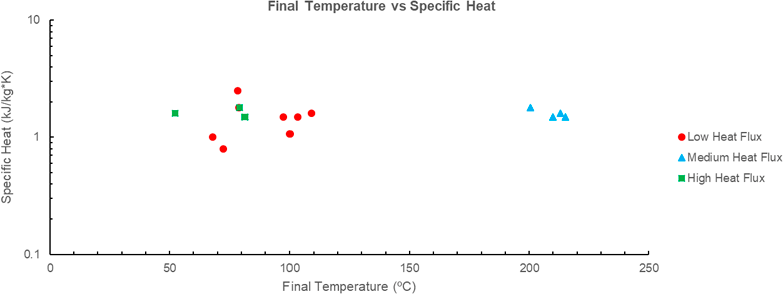
Figure 6 Comparison of final temperature (ºC) vs specific heat (kJ/kg*K) for various PCM’s. Data for PCM A-E sourced from [6]; PCM F sourced from [13], PCM G-J sourced from [14]. Note that various PCM’s have not been included as there is no given latent heat or time temperature profile in the source document.
The relation between final temperature and latent heat is the most evident of the material parameters considered within the scope of this study. In both the low and medium flux environments an increase in latent heat results in a decrease in the final temperature, see Figure 7 [14]. This corroborates the theoretical implication that increasing the amount of energy required to change and thus lengthening the period of time without temperature increase will result in a lower final temperature [6]. Furthermore, this trend is far more evident than the relationship between specific heat and final temperature shown in Figure 6, this is expected as the latent heat required to change phase is far higher than the sensible heat resulting in temperature change. The high heat flux case does not feature any correlation between two quantities which indicates that the mass of PCM, and therefore heat required to change phase, is too small to be effective in the high flux environment. This is further evidenced by lack of impact the phase change on the slope of the time-temperature profile shown in Figure 5.
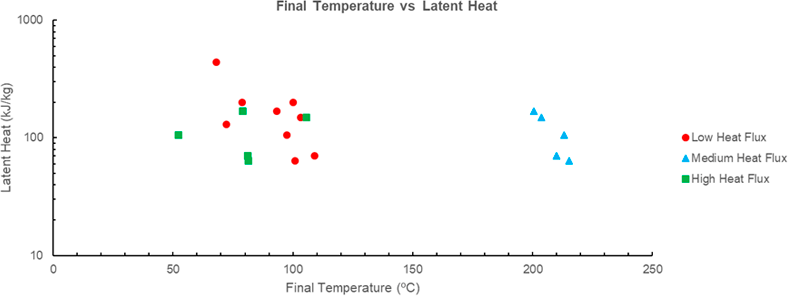
Figure 7 Final temperature (ºC) vs latent heat (kJ/kg) for various PCM’s. Note that various PCM’s have not been included as there is no given specific heat or time temperature profile in the source document. Data for PCM A-E sourced from [6], PCM G-J sourced from [14].
The trend of final temperature to decrease with an increasing melting point is apparent in both the low and medium fluxes, see Figure 8. This does not agree with the conclusion that a lower melting point would decrease the time until the phase change begins, and temperature becomes constant, thus reducing the final temperature. This may be the result of the difference in specific heat between solid and liquid phases of the PCMs. PCM’s with a lower specific heat in the liquid phase would experience a faster rate of temperature increase after phase change when compared with PCM’s with higher liquid specific heats. As such, a lower melting point and earlier phase change would result in a higher final temperature than if the phase change had occurred later in the testing period. Figure 8 cannot be used to verify this hypothesis as no data has been included on the liquid specific heats of the PCM’s.
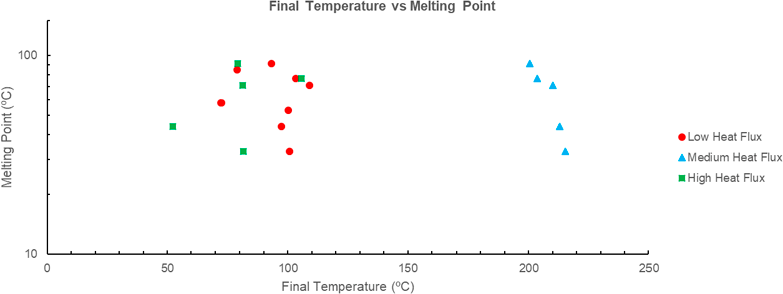
Figure 8 Final temperature (ºC) vs melting point (ºC) for various PCM’s. Note that various PCM’s have not been included as there is no given melting point. Data for PCM A-E sourced from [6], PCM G-J sourced from [14].
4. Conclusions
The trends identified show that melting point and latent heat of the PCM are the primary factors in reducing the final temperature of the FFPC apparatus. These quantities are both inversely proportional to the final temperature in the low and medium heat fluxes. Specific heat has the smallest impact on final temperature, which is a result of only small masses of PCM being tested. In general, the effectiveness of the PCM is manifested in the decrease in slope of the time temperature relationship and becomes less evident with increasing heat flux. The lack of correlation between any of the material parameters and final temperature in the high flux environment, as well as the negligible impact on the slope of the time-temperature profile infers that the tested set of PCM’s cannot be effectively judged in the high flux environment.
It is recommended that future studies test PCM’s over a broader range of latent heats and melting points to allow for the development of FFPC that is more effective in high heat fluxes. Furthermore, future research should explore the possibility of mixing multiple PCMs that are suited for different flux levels in order to create more versatile protective materials.
Acknowledgments
The authors would like to thank Dr Jurgen Schulte, Liam Martin, Blake Regan and Joshua Pritchard for their assistance in creating, refining and publishing this paper. The authors would also like to thank the UTS library staff for their providing and assistance in using the database and referencing services.
References
1. Gupta D. Functional Clothing - Definition and Classification. Indian Journal of Fibre and Textile Research [Internet]. 2011 Dec [cited 2019 Apr 20];36(4):321-6. Available from: https://www.researchgate.net/publication/296845630_Functional_clothing-Definition_and_classification.
2. Raimundo AM, Figueiredo AR. Personal Protective Clothing and Safety Of Firefighters Near A High Intensity Fire Front. Fire and Safety Journal [Internet]. 2009 May [cited 2019 Apr 20];44(4):514–21. Available from: https://www.sciencedirect.com/science/article/pii/S0379711208001458. doi: https://doi.org/10.1016/j.firesaf.2008.10.007.
3. MSA Safety. Selecting Your Gear: Learning About Materials. Cranberry Township, Pennsylvania; MSA Safety; 2015 [updated 2019, cited 2019 Apr 15]. Available from: https://globe.msasafety.com/selecting-your-gear/materials
4. Alptekin E, Ezan EA, Gül BM, Kurt H, Ezan AC. Numerical Investigation of Thermal Regulation Inside Firefighter Protective Clothing. Journal of Textiles and Engineering [Internet]. 2017 Jun [cited 2019 Apr 20];24(106): 94-100. Available from: http://www.tekstilvemuhendis.org.tr/en/2017_-volume-24-/106/numerical_investigation_of_thermal_regulation_inside_firefighter_protective_clothing--doi-_10-7216-1300759920172410606. doi: 10.7216/1300759920172410606.
5. Brushlinsky N.N, Ahrens M, Sokolov S.V, Wagner P. World Fire Statistics. World Fire Statistics Magazine. 2017;22(22): 25-6.
6. McCarthy L. Evaluation of the Thermal Performance of Fire Fighter Protective Clothing with the Addition of Phase Change Material. 2012 Oct;48(4):841–64. Available from: https://search.proquest.com/docview/1039255529
7. Phelps H, Watt S, Sidhu H, Sidhu L. Using Phase Change Materials and Air Gaps in Designing Fire Fighting Suits: A Mathematical Investigation. Fire Technology [Internet]. 2019 Jan [cited 2019 Apr 20];55(1):363-81. Available from: https://link.springer.com/article/10.1007/s10694-018-0794-z.
8. Pause B. Phase Change Materials and Their Application in Coatings and Laminates for Textiles. Smart Textile Coatings and Laminates. 2010;1(1): 236-50. https://doi.org/10.1533/9781845697785.2.236
9. Halliday D, Resnick R, Walker J. Fundamentals of Physics. 10th ed. Hoboken, NJ: John Wiley & Sons; 2014. p. 522-6
10. Yazdi MM, Sheikhzadeh M, Dabirzadeh A, Chavoshi E. Modelling the Efficiency and Heat Gain of a Phase Change Material Cooling Vest: The Effect of Ambient Temperature and Outer Isolation. Journal of Industrial Textiles [Internet]. 2015 Jun 11 [cited 2019 Apr 20]; 46(2): 436–54. Available from: https://journals.sagepub.com/doi/abs/10.1177/1528083715589746. doi: https://doi.org/10.1177/1528083715589746.
11. Chemical Book. Paraffin wax(8002-74-2). Chemical Book; 2015[updated 2017, cited 2019 May 15]. Available from https://www.chemicalbook.com/ProductMSDSDetailCB2854418_EN.html
12. Babu VR, Arunraj A. Thermo Regulated Clothing with Phase Change Materials. J Textile Eng Fashion Technol [Internet]. 2018 Oct 17 [cited 2019 Apr 20];4(5):344–7. Available from: https://medcraveonline.com/JTEFT/JTEFT-04-00162.pdf.
13. Rossi RM, Bolli WP. Phase Change Materials for Improvement of Heat Protection. Advanced Engineering Materials [Internet]. 2005 Mar 31 [cited 2019 Apr 20];7(5):368-73. Available from: https://onlinelibrary.wiley.com/doi/abs/10.1002/adem.200500064. doi: https://doi.org/10.1002/adem.200500064.
14. Buhler M, Popa AM, Scherer LJ, Lehmeier FK, Rossi RM. Heat Protection by Different Phase Change Materials. Applied Thermal Engineering [Internet]. 2013 May 30 [cited 2019 Apr 20];54(2):359-64. Available from: https://www.sciencedirect.com/science/article/pii/S1359431113001300. doi: https://doi.org/10.1016/j.applthermaleng.2013.02.025.
Appendix A
Collated thermodynamic data for the PCMs analysed in this paper. We did not include it in the paper as it does not directly influence our results or analysis but appended it as additional information. Chemical formulae for several PCMs are missing as they were either not included by the authors or are proprietary information.
| PCM ID | PCM Materials | Melting Temperature (°C) | Latent Heat (kJ/kg) | Specific Heat (kJ/K) |
|---|---|---|---|---|
| PCM A [6] | Information Withheld | 33 | 64 | 1.5 |
| PCM B [6] | Information Withheld | 44 | 105 | 1.6 |
| PCM C [6] | Information Withheld | 71 | 70 | 1.5 |
| PCM D [6] | Information Withheld | 77 | 149 | * |
| PCM E [6] | Information Withheld | 91 | 168 | 1.8 |
| PCM F [14] | Information Withheld | 50 | * | * |
| PCM G [14] | 40 | * | * | |
| PCM H [14] | 85 | 200 | 0.8 | |
| PCM I [14] | 10 | 58 | 130 | 1 |
| PCM J [14] | * | 440 | 1.07 | |
| PCM K [7] | 53 | 200 | 2.5 |
Asterisks indicate no data was provided in source documents.