Efficiency Comparisons of Secondary Biofuels
Connor Day1,*, Yin-Chen Tseng2, Reuben Puyol3 and Jessica Nissan4
Faculty of Science, University of Technology Sydney, 15 Broadway, Ultimo NSW 2007.
1 University of Technology, Sydney, PAM; E-Mail: ConnorPeterson.Day@student.uts.edu.au
2 University of Technology, Sydney, PAM; E-Mail: Yin-Chen.C.Tseng@student.uts.edu
3 University of Technology, Sydney, PAM; E-Mail: Reuben.M.Puyol@student.uts.edu.au
4 University of Technology, Sydney, PAM; E-Mail: Jessica.Nissan-1@student.uts.edu.au
* Author to whom correspondence should be addressed; E-Mail: ConnorPeterson.Day@student.uts.edu.au
Received: 4 April 2014 / Accepted: 28 April 2014 / Published: 2 June 2014
Abstract: Biofuels are essential for the energy production of the future. This report is a meta-study of the efficiencies of first, second and third generation secondary biofuels used for transportation purposes. We present and compare data from several studies concerning the efficiency of converting raw biomass info biofuels. We also compare this data to the efficiencies of hydrogen and solar power transportation systems. The efficiency data was presented as percentages from ratios of different data types, primarily exergy and energy efficiency ratios, which are defined for each study throughout the report. The highest efficiency percentages were displayed by second-generation wood knot rejects that did not require pretreatment input energy and resulted in high-energy ethanol output. The lowest efficiency percentages were from quasi-solar thermophotovoltaic radiator technology, heightening the reputation of biofuels as the efficient, renewable transportation energy source of tomorrow.
Keywords: biofuels; efficiency; energy; exergy; ethanol; lignocellulose; Fischer-Tropsch; microalgae; meta-study
Copyright: © 2014 by the authors. This article is distributed under the terms and conditions of the Creative Commons Attribution license (https://creativecommons.org/licenses/by/4.0/).
DOI: http://dx.doi.org/10.5130/pamr.v1i0.1386
1. Introduction
Biofuels are sources of energy composed of or derived from biomass, which is biological material made of living or recently living organisms, most commonly plants [1]. Two major types of biofuels exist: primary and secondary. Primary biofuels are used in an unprocessed form mainly for heating, cooking, and electricity. They include things like wood chips or pellets and firewood. Because of their unrefined tendencies, primary biofuels are generally harmful to the environment and inefficient. Secondary biofuels are produced through methods of processing raw biomatter. They can be used in vehicles and various industrial processes. These biofuels are further categorized as either first, second, or third generation biofuels based upon the type of raw material and production technologies used. First generation biofuels are produced from edible crops such as sugars, grains, or seeds. Second generation biofuels come from nonfood biomass, including lignocellulosic feedstock comprising of byproducts, wastes, and some dedicated feed stock. Third generation biofuels are produced from microorganisms like microbes and microalgae [2].
Biofuels are based upon the ultimate renewable energy source: solar irradiation [3]. Biofuels offer a long-term promise of sustainability as a natural fuel source. With the growing demand for alternatives to our quickly depleting supply fossil fuels, scientists are starting to focus on the efficiency improvement of biofuel production technologies [1]. One of the largest challenges for biofuel production systems is the development of efficient conversion technologies which are economically comparable to fossil fuels [4].
More energy efficient technologies are being developed by the transportation industry, including hybrid vehicles, hydrogen-based vehicles, all-electric vehicles, solar-powered vehicles, and the usage of biofuels [5]. This meta-study focuses on the efficiency of the processes involved in the production of different types of secondary biofuels used for transportation. We present and compare data from several studies concerning the efficiency of converting raw biomass to fuel. The data we have researched from literature is organized by the three generations of biofuels. We will also compare the efficiency data of these biofuels to competing alternative energy systems involving the usage hydrogen power and solar power in transportation.
2. Methods
We have chosen to use efficiency as our main parameter for comparison. It is a very important factor in assessing the value of the biomass to biofuel conversion process because consumers and scientists alike are extremely concerned with getting the maximum amounts of fuel out of our resources. As it is a unit-less ratio, efficiency comparison provided the ability to compare many different data types from the entirety of the biofuel research field. The literature we have included in our meta-study use different ways of calculating the efficiency ratio. Most of the literature we have referred to in our meta-study define efficiency as an energy ratio (η):

Exergy is another parameter used in the calculation of efficiency. Exergy analysis is a thermodynamic tool that expresses energy quality, while energy analysis describes quantities. Both are equally important and are comparable when discussing process efficiency since so many factors in fuel production processes can be included in the efficiency calculation [4]. Sections 3.1.2 and 3.2.2 include exergy efficiency analysis.
For studies that provided parameters from which the efficiency percentages were calculated, we have provided that data for comparison. These parameters were mainly energy and exergy inputs and outputs measured in joules per unit biomass (kilogram, hectare, ton, etc.).
Our information was gathered from an unrestricted range of databases accessed through the UTS library as well as open source articles on the Internet. The main databases used were Academic Search Complete (EBSCO), ProQuest Science & Technology, and Science Direct. The studies concerning the processes discussed are from articles predominantly written within the past ten years, so we are reporting on recent studies and research done within the scientific community. The information included in this meta-study comes from a worldwide range of researchers and scientists in countries including China, the United States, New Zealand, and the Netherlands.
3. Results
3.1. First Generation Biofuels
3.1.1. Biomass-to-fuel Efficiency
Wei-Dong Huang and Y-H Percival Zhang performed a study published in 2011 that analysed the production energy efficiency of multiple types of biofuel used in powertrain transportation systems. In the first step of their study, they calculated the biomass-to-fuel (BTF) efficiency in biorefineries and power stations without significant inputs or outputs of other energy. The BTF efficiency was defined as the ratio of the energy in the fuel produced (EF) to the chemical energy of the biomass before production (EB):

The types of first generation biomass they studied that produced liquid transportation biofuels were corn and glucose. Corn was fermented into ethanol at an efficiency of 48.6%, and glucose was fermented into butanol and ester micro-diesel at efficiencies of 46.7% and 36.5%, respectively [5].
3.1.2. Exergy Analysis
J. Dewulf and other researchers at Ghent University collected data through a study of the efficiency of the production of three first-generation biofuels: rapeseed methyl ester (RME), soybean methyl ester (SME) and corn-based ethanol (EtOH). Ethanol is a flexible biofuel that can be produced from many different crops through fermentation, including sugar cane, sugar beet, corn, and cellulosic materials (see section 3.2). Methyl esters are similar to diesel fuel and are produced through chemical trans-esterification from crops built from a large amount of triglycerides. The authors use an exergy analysis to compare efficiencies [3].
The exergy inputs and outputs of the production processes are shown in Table 1. The researchers took into account not only the input of the crops themselves, but also the power inputs for processing the crops into fuel. The outputs reported include both the fuel exergy and the exergies of the useful byproducts of the process.
Utilizing the researchers’ data, efficiency percentages were calculated from the exergy data and added to the table. The total process efficiency is the ratio of the total sum of the outputs and inputs. The crop to fuel efficiency is the ratio of the exergy of the output biofuels to the exergy of the input agricultural product, not including the additional input exergies and the byproduct output exergies. Both are presented as percentages.
3.2. Second Generation Biofuels
3.2.1. Lignocellulosic Knot Rejects
Lignocellulose is a material that encompasses the majority of the structural mass of plants. Lignocellulosic biofuels can come from virgin biomass (uncultivated trees, bushes, grasses), waste biomass (agricultural or wood-processing byproducts), or crops dedicated to producing biomatter. This is a particularly advanced biofuel technology because it can be made from non-food biomass, which means it is not in competition with food supplies [2]. A great variety of biofuels can be produced from lignocellulose biomass, including cellulosic ethanol, butanol and/or long chain alcohols, electricity, bioalkanes, fatty acid esters, hydrogen, hydrocarbons, and waxes [5].
Huang and Zhang’s BTF efficiency study (see section 3.1.1) also included information on the efficiencies of three second generation biomass types: corn stover, wood, and lignocellulose (the non-edible feedstocks). Corn stover was fermented into cellulosic ethanol at an efficiency of 52.0%. Methanol was produced through the gasification of wood and lignocellulosic material at efficiencies of 50.9% and 54.9%, respectively [5].
| Feedstocks: | Rapeseed | Soybean | Corn |
| Inputs | |||
| Agricultural product | 86.0 | 53.8 | 134 |
| Fuels | 0.17 | 2.97 | 0.32 |
| Electricity | 0.46 | 0.69 | 2.85 |
| Steam | 1.00 | 0.77 | |
| Chemicals | 3.63 | 1.30 | 1.79 |
| TOTAL INPUT | 91.3 | 59.5 | 139 |
| Output biofuels | |||
| RME | 47.5 | ||
| SME | 16.4 | ||
| EtOH | 68.8 | ||
| Output byproducts | |||
| Glycerol | 2.10 | 1.31 | |
| Meal | 32.7 | 37.3 | |
| DDGS | 43.4 | ||
| TOTAL OUTPUT | 82.3 | 55.0 | 112 |
| Total process efficiency (%) | 90.1 | 92.4 | 80.6 |
| Crop to fuel efficiency (%) | 55.2 | 30.5 | 51.3 |
The variety of raw materials available to create cellulosic ethanol is much greater as compared to corn and sugar based ethanol; however, a larger amount of pretreatments is required in cellulosic ethanol production in order to modify the internal structure of the raw materials to a form that can be broken down through fermentation. Each method of pretreatment comes with its own problems. Physiochemical pretreatment forms unwanted chemicals and require very high temperatures and pressures, creating a need for a high energy input, and forms unwanted waste chemicals. Biological pretreatment is very time consuming and requires precisely control conditions. Because of these issues, the use of cellulosic wastes that already have been treated through the production of other materials has been appointed as a better option to increase the energy efficiency of the conversion process.
A collaboration among scientists at labs at Shandong Polytechnic University in China and the USDA Forest Service produced results comparing the bioconversion efficiency of rejects from pulp mill waste to physiochemically pretreated wood chip substrates of lignocellulose into ethanol. The rejected waste used mainly included under-cooked wood chips and wood knots. Aspen wood chips were used as the directly pretreated material. One pretreatment method used dilute sulfuric acid (DA) and two other pretreatments used sulfite pretreatment to overcome recalcitrance of lignocelluloses (SPORL). Substrate SPORL3 represents the substrate pretreated with a concentration of sodium bisulfate of 3%, and substrate SPORL1.5 used a concentration of 1.5%. Both the chemically treated wood chips and the knot rejects were then ground in a disk refiner and made into slurry. The knot rejects went through the deconstruction process at three different levels of blade gap: 0.15 inch (KR-15), 0.40 inch (KR-40), and 0.80 inch (KR-80). The next step involves enzymatic hydrolysis in which the glucan in the substrate is converted to fermentable glucose, which is then converted to liquid ethanol [7].
Table 2 shows the details concerning the pretreatment methods, the ethanol output, and the efficiency of the process. The study’s efficiency of bioconversion was defined as the ratio of net energy output and the total input energy:
For our purposes, we have used the information provided from this study to calculate an efficiency ratio of the output energy of the ethanol divided by the Net Calorific Value (NCV) of wood chips, 12.5 GJ ton-1 [6]. These results are also shown in Table 2 [7].
| Substrate | KR-15 | KR-40 | KR-80 | SPORL3 | SPORL1.5 | DA |
| Ethanol yield (%)* | 83 | 80 | 78 | 77 | 61 | 58 |
| Ewood chipping & Ethermal pretreatment (GJ ton-1) | 0 | 0 | 0 | 1.43 | 1.43 | 1.43 |
| Ephysical refining (GJ ton-1) | 1.479 | 1.285 | 1.006 | 0.056 | 0.105 | 0.228 |
| SSF ethanol production (L ton-1) | 372.4 | 361.7 | 351.0 | 243.4 | 182.7 | 178.9 |
| Eethanol (GJ ton-1) | 8.726 | 8.476 | 8.226 | 5.703 | 4.281 | 4.192 |
| η (%) | 490.0 | 559.6 | 717.7 | 283.7 | 178.9 | 152.8 |
| Efficiency (NCV/Eethanol) (%) | 69.8 | 67.8 | 65.8 | 45.6 | 34.2 | 33.5 |
| *The ethanol yield is the percentage of substrate glucan fermented into ethanol after 120 hours of quasi-simultaneous enzymatic saccharification and fermentation (SSF). | ||||||
3.2.2. Energy Process Comparison
Sohel and Jack, researchers at Scion Research New Zealand, have applied a thermodynamic exergy analysis to compare two major conversion pathways for turning lignocellulosic biomass into biofuels. One is a biochemical route using enzymes, and the other is a thermochemical route using gasification. The biochemical process analysed is the National Renewable Energy Laboratory (NREL) process for the production of lignocellulosic feedstock into ethanol. This process is then compared to an analysis of a thermochemical process previously published by M.J. Prins and others in 2005 [4,8].
The NREL production process converts wood chips into ethanol through simultaneous saccharification and co-fermentation (SSCF). The process uses byproducts enriched with lignin to create the heat required, but such a plant actually produces more energy than required for the process. Thus, some electricity is also produced. The wood chips go through the major chemical conversions of biochemical ethanol production processes of pretreatment, enzymatic hydrolysis, and fermentation. The NREL process creates 5.5 kg/s of ethanol from 44.44 kg/s of biomass on average.
The researchers measured the overall efficiency as

where EX,fuel is the chemical exergy of the fuel, Wnet is the net amount of electricity available for sell to power grids, EX,biomass is the input chemical energy of biomass, and ∑EX,ch is the sum of all chemical exergies added to the process.
The thermochemical process utilizes sawdust as a feedstock instead of wood chips. This sawdust is dried and autothermally gasified at the very high temperature of 900°C. The gas is then cleaned, compressed, catalytically shifted, and fed into a Fischer-Tropsch reactor to be converted to both gaseous and liquid hydrocarbons by Fischer-Tropsch synthesis (see section 3.2.3). The products from this reaction are cooled and the hydrocarbon liquids condense from the gas. The process creates 1.54 kg/s FT diesel from 10.19 kg/s biomass. The overall efficiencies of the biochemical and thermochemical production processes were 34.7% and 36.4%, respectively. The power generation for the processes is the top cause of loss of exergy. The second largest exergy loss in the thermochemical process is from gasification due to high temperatures. The second largest exergy loss in the biochemical process is from the SSCF process [4].
3.2.3. Fischer-Tropsch Diesel
Fischer-Tropsch (FT) fuels have been produced in various forms using a wide range of feedstock to accommodate different needs, since the inception of this process in the 1920s. The process in general is a reference to the conversion of feedstock, most commonly solid in nature, to a refined synthetic gas (syngas) comprising of a predetermined ratio of hydrogen (H2) and carbon monoxide (CO) gas, which can be adjusted to suit the preferred ratio of approximately 2, through a Water Gas Shift Reaction. This H2/CO blend undergoes the FT process where the syngas interacts with a catalyst converting it to a mixture of CH4 and H2O which becomes the ingredients for further processing (hydrocracking) to create the desired aliphatic (long chain) hydrocarbon that is desired (C9 - C22).
FT diesel (FTD) is an attractive alternative to fossil fuel over other biofuel sources due to its ability to be integrated into existing diesel management and transportation systems, and the ability for it to be introduced into engines as a primary or as a blend designed to run on fossil fuels with no engine modification due to its equivalent energy density and viscosity. FTD contains virtually no sulfur, since sulfur removal is an integral step in its synthesis, to facilitate the longevity of the catalytic devices used in the FT reaction process (syngas to fuel). It is also very low in aromatic compounds such as benzene and toluene which produce toxic emissions during the combustion process. A review of publications into the combustion characteristics of FTD in comparison to conventional diesel, showed a high percentage of publications reporting on the effective power output being similar, 50% of publications reporting an increase in thermal efficiency and between 60 and 100% of the reviewed publications reporting a reduction of the formation of harmful emissions such as nitrous oxides (NOx), particulate matter (PM), and greenhouse gases such as CO, and CO2, often producing a biofuel with a neutral carbon footprint [9-11].
The FT process begins with the selection and pretreatment of feedstock. Two current and commercially viable FTD production plants work by converting coal mining byproducts, coal to liquid (CTL), at the Sasol production plant in South Africa and natural gas byproducts, gas to liquid (GTL), at the Shell Malaysia facility, but theses feed stocks requires lower energy input during the pretreatment process due the feedstock’s inherent similar composition to the syngas to be produced. Since the main drive behind biofuel production is to recycle unwanted matter (such as recycling of byproducts from other processes) and to reduce a dependence on natural resources such as fossil fuels and food crops, we will focus on the conversion of biomass derived from the byproducts produced from existing agricultural, industrial and municipal processes. Since the biomass created from these processes vary, so does the pretreatment. To facilitate a more cost effective production of FTD, it has been suggested that the pretreatment of the biomass to be used for FTD production to be carried out close to the facility that creates the waste. This is considered to be an efficient step in the FTD production since dehydration and pyrolysis of the feedstock results in a reduction of weight and volume, making transportation more cost effective [12,13].
The general steps of the FT process are;
- Pre-Treatment - The preparation of the biomass includes sorting and reworking the feedstock to the required size, dehydration through various methods such as dehydration (approximately 100°C), pyrolysis (the removal of volatile elements in the biomass - between 200 - 300°C) and combustion (occurring as volatile compounds react with oxygen during pyrolysis). Some feedstock enables the ability to bypass certain steps due to composition and degree of processing the feedstock has undergone in previous processes [14].

- Gasification - The conversion of a selected feedstock into a synthetic gas predominantly comprised of hydrogen and carbon monoxide and often containing considerable levels of carbon dioxide. The choice of feedstock and the methods adopted during pretreatment determine the H2/CO ratio. There is also a need for the purification of the syngas produced to eliminate byproducts of the gasification process from “poisoning” the catalyst used in the FT reaction process. Common reagents that are extracted during the gas purification phase include hydrogen sulfide, ammonia, tar and PM.
- Water -Gas Shift Reaction - An efficient method adopted to convert the unprocessed syngas from the initial gasification to a syngas consisting of the desired components for a higher yield during the FT reaction phase of production.
- Fischer Tropsch Reactor - The FT reaction is a process where the syngas interacts with to produce the mixture of hydrocarbons that will later be refined into the anticipated final hydrocarbon compounds. This process involves high pressures and mid-range temperatures, within a certain range, where the exact temperature and pressure facilitates the type of hydrocarbons that will be favored in the FT reactor.

- Upgrading - When the intended biomass is FTD, the resultant yield of hydrocarbon within the intended range (C9 - C22) is of a considerable percentage. To further enhance the FTD yield, the hydrocarbon mixture resultant from the FT reactor is then either hydrotreated, hydrocracked or both, to create higher yields of FTD, continuing the conversion process of byproducts such as FT waxes and gasoline into a typical final yield of FTD as high as 85% [12].
FTD production efficiencies are dependent on the type and availability of feedstock, as well as the market price comparison to the cost per barrel (CPB) of crude oil. The analysis into FTD production by van Vliet determines the production of FTD to be economically comparable to conventional diesel. GTL production is cheapest with a CPB is $36, CTL when CPB reaches $60, and BTL when CPB reaches $75 [12].
| Plant Configurationa | CTL 2000 | GTL 2000 | BTL 300CGP |
| Feedstock Material | Coal | Gas | Eucalyptus Chips |
| Feed to Fuel Energy Conversion (%) | 52 | 39 | 52 |
| a The CTL 2000MW plant resembles the Sasol plant, GTL 2000MW plant resembles the Shell Bintulu plant, and the BTL 300MW plant resembles a demonstration plant created by CHOREN | |||
3.3. Third Generation Biofuels
3.3.1 Microalgae-based Biofuels
Algae, particularly green unicellular microalgae, are competitive candidates for biofuel feedstock. Microalgae are microscopic organisms that can grow in freshwater, saline bodies of water as well as harsh, nutrient-filled waste water. Growing microalgae does not use up any crop land or feedstock and this advantage classifies biofuels produced from microalgae as third generation biofuels [2,15]. The oil that can be produced from microalgae is more than 30% of the oil production rate of other oil-rich feedstock such as oil palm, coconut and canola, making it a viable candidate to other biofuels [16]. Biodiesel, ethanol, bio oil and syngas are among the many biofuels that can be produced from microalgae biomass [17].
Microalgae can be grown in either open or closed systems. Open systems refer to natural, open ponds whereas closed systems refer to uniquely designed structures such as photobioreactors. Photobioreactors offer the advantage of protecting against contamination, pathogens, and predators [15]. However, the overall energy required to maintain a closed system (729 GJ/yr) is much higher than an open system (450 GJ/yr), mainly due to pumping requirements. [2,17]. A superior system is a combination of the two: an open system under greenhouse cultivation conditions [17].
Another factor that determines productivity of microalgae biomass is the culture condition it is grown in. In heterotrophic culture, microalgae feed on other organisms and organic wastes to reproduce. Phototrophic culture involves sunlight as the sole energy input for the reproduction of microalgae [17]. Microalgae exhibit differing characteristics when grown under each condition. A species of microalgae, Chlorella Protothecoides, can be grown with oil content of 55.2% (dry weight) in heterotrophic conditions compared to 14.5% in autotrophic conditions. The addition of organic carbon in the heterotrophic culture was the main contribution to this yield [18]. However, addition of organic carbon can largely limit the success of microalgae production. A sustainable method to overcome this is to use nutrient-rich wastewater from agricultural, municipal and industrial processes. The nitrogen, phosphor and potassium levels can provide an efficient medium for effective microalgae production while microalgae can, in turn, treat wastewater instead of added chemicals. This dual use process is an effective way of increasing microalgae efficiency as it subtracts the input of water, nutrients, land and other factors [19].
Important factors that determine the potential of microalgae include the biomass productivity and the lipid content of the produced microalgae [18]. The lipid content of microalgae can reach up to 80% and its biomass productivity can be up to 7.3 grams/litre/day (g/l/d) based on the dried weight of biomass (DW). This was the case with Chlorella Protothecoides cultivated in a 5L Bioreactor at 28 degrees Celsius [17]. Another significant yield was cultivated in municipal waste: Chlamydomonas reinhardtii produced a biomass productivity of 0.505 g/l/d [19]. The aeration of carbon dioxide at 2% further yields a biomass productivity of 0.48 g/l/d of the Nannochloropsis species. An alternative to carbon is a glucose concentration of 0.5-8%, producing a lipid content of 44.48% in the Chlorella species. Also, sweet sorghum juice as the carbon source was highly productive, producing a lipid content of 73.4% in comparison [17].
In addition to culture conditions and culture systems, harvesting techniques affect the efficiency of biofuels produced from microalgae. There are a few methods of extracting oil from microalgae biomass; conventional and non-conventional methods. Dewatering before extraction is a conventional method that extracts 70-75% of the oil from microalgal biomass. The only other conventional method that is more efficient is a recently developed one by the OriginOil Company. This method, which involves breaking the cell walls of the microalgae, has a 94-97% efficiency. Non-conventional methods are faster: the Ultrasonic technique increases yield by 50-500% and reduces time by tenfold. The Microwave technique takes only 30 minutes to extract 76-77% of the total recoverable oil [17].
3.4. Non-Biofuel Renewable Energy Sources
3.4.1. Hydrogen
Five hydrogen fuel cell technologies were compared by a team of American researchers in 2011: gaseous 350 bar hydrogen, gaseous 700 bar hydrogen, cold gas at 500 bar and 200 K, cryo-compressed liquid hydrogen (CcH2) at 275 bar and 30 K, and a metal-organic framework still in experimental stages (MOF 177) at 250 bar and 100 K. Three production options were studied: steam methane reforming (SMR), electrolysis, and biomass gasification. Almost all hydrogen produced today comes from SMR, though electrolysis is also used commercially at a very small scale, and the small amount of biomass gasification used is mainly for the production of electric hydrogen power. The energy efficiencies and volumetric efficiency of the storage systems are presented in Table 4. The researchers calculated their efficiencies on a well-to-wheel basis, starting from the initial production stage as the input energy and ending with the energy produced out of a chosen hydrogen fuel cell vehicle. They also presented data on the useful energy in the fuel cell in the units of kWh/kg H2. We have converted these values to GJ/ kg H2 for comparison purposes [20].
3.4.2. Solar
Three Taiwanese researchers published data in 2012 involving the efficiency of a solar powered Stirling engine at maximum power output. This type of engine consists of a spherical reflector and an absorber that acts as a heat source for a collector. Some heat is lost to the environment by radiation and convection. The collector surface’s heat absorption efficiency was defined as:

where qin is the collector heat that is applied to the engine, Isun is the solar intensity of the sun, and Ac is the area of the collector. Table 5 presents the parameters and efficiency results of the study. The original data was presented in units of Watts, but for easier comparison to the rest of the data we have gathered, we have provided equivalents in MJ/hr [21].
Research results in the development of thermophotovoltaic (TPV) converter systems with improved heat conversion efficiency were published by American scientists in 2005. TPV systems are similar to photovoltaic systems except that they use a converter radiator instead of the sun as their source of heat. Radiant heat conversion efficiency was defined as the ratio between maximum output power by the system and the heat flux absorbed by the system. The researchers were able to create TVP modules that produced 0.3 W/cm2 at an efficiency of 22% while maintaining a radiator temperature of 1228 K and a module temperature of 325K. By using this data, it was projected that when using a radiator and module temperature of 1373K and 325
K, respectively, a production of 0.9 W/cm2 at an efficiency of 24% would be possible [22].
| Storage Systems | 350 bar | 700 bar | Cold Gas-500 bar | CcH2-275 bar | MOF 177 |
| Energy use in fuel cell (kWh/kg H2) | 58.8 | 61.2 | 63.8 | 78.0 | 78.0 |
| Energy use in fuel cell (GJ/kg H2) | 0.212 | 0.220 | 0.230 | 0.281 | 0.281 |
| Energy efficiency (%) | 56.7 | 54.4 | 52.2 | 42.7 | 42.7 |
| System Parameters: | Values: |
| Collector Area | 1 m2 |
| Solar intensity | 4000 W = 14.4 MJ/hr |
| Power accumulated by collector | 3600 W = 12.96 MJ/hr |
| Radiation heat loss | 621 W = 2.24 MJ/hr |
| Convection heat loss | 1337 W = 4.81 MJ/hr |
| Collector efficiency | 41% |
| Input power of heat engine | 1642 W = 5.91 MJ/hr |
| Power generated by heat engine | 596 W = 2.15 MJ/hr |
| Total system power loss | 3404 W = 12.25 MJ/hr |
4. Discussion
Table 6 presents all of the efficiency percentages mentioned in the results section of this meta-study. This data is also visually presented as a bar graph in Figure 1. The second generation knot rejects display the highest range of efficiency (65.8-69.8%). These rejects are an excellent substrate for bioconversion because of their ability to produce a high amount of ethanol (8.226-8.726 GJ per ton of biomass). This output energy value was much higher than the chemically pretreated substrates they were directly compared to in the literature (4.192-5.703 GJ per ton) [7]. The substrate with the highest energy efficiency (KR-80) resulted from a balanced trade of energy input from processing and high output energy. Stable control of energy production and consumption in the biofuel process is an important factor to consider in the evaluation of different types of feedstocks and processes.
The next highest range of efficiencies fell into the 52-57% range. These fuels included the most efficient first-generation fuel of rapeseed methyl ether (55.2%), corn stover ethanol (52%), lignocellulosic methanol (54.9%), FT-diesel from coal and eucalyptus chips (both 52%), and three of the hydrogen fuel cells (350 bar at 56.7%, 700 bar 54.4%, and cold gas at 52.2%). The possibly surprising contender in this group would be the first-generation RME. DeWulf and others mentioned that the nature of photosynthesis in plants has limits in efficiency and time periods due to different growing seasons for crops, which puts biomass at a disadvantage to other fuel sources that can be produced year-round [3]. This particularly affects first-generation crops that are only grown at certain times of the year. However, rapeseed proved to be an efficient biomass, producing 47.5 GJ RME per hectare from 86.0 GJ per hectare of feedstock. The second highest first-generation fuel, corn ethanol, did not fall far behind in efficiency (50%). With producing 68.8 GJ per hectare of fuel from 134 GJ per hectare feedstock, despite the slight downgrade in efficiency, corn ethanol production would create larger amounts of energy per hectare of land than rapeseed. If the corn ethanol production efficiency could be improved, it would surpass rapeseed as the leading first-generation biofuel.
The three most efficient hydrogen fuel cells serve as significant competitors to biofuels as an efficient alternative renewable fuel. It is important to note that these efficiency percentages were calculated on a well-to-wheel basis, meaning that the output energy was from the vehicles the fuel cells were used in, creating an additional efficiency loss. This being said, the true efficiency of the creation of the fuel cells should be higher than the reported values (52.2-56.7%). Despite their high efficiency, the hydrogen fuel cells contain less than 0.3 GJ per kilogram H2 used to create them. This is a small fraction of the energy produced from first-generation rapeseed (per hectare) or even the biochemically pretreated lignocellulosic substrates (per ton).
Despite the high efficiency of their knot reject cousins, the thermochemically gasified and NREL processed wood chips were shown to have efficiencies in the lower half of the spectrum (36.4% and 34.7% respectively). Because these efficiencies were calculated from exergy values, they represent the maximum amounts possible in certain environments. This is conclusive evidence to show that the thermochemical biomass conversion process used for the knot rejects and pretreated substrates was the more efficient process choice.
The lowest efficiency values were from the TPV converter radiator. The solar Stirling engine converter did quite well with an efficiency of 41%. The major difference between the solar processes is that the Stirling engine converter used photovoltaic cells that used heat from the sun directly. The TPV converter simply used its radiator as its heat source. A large difference between biofuel production and solar energy production is that the efficiency of solar power can be changed and maximized by manipulating the temperature of the solar collector. The efficiency of biofuel production relies on the type process technologies used, minimization of input resources, and maximization of output. Despite this apparent advantage to solar power, over half of the biofuel processing efficiencies in this meta-study surpass the efficiencies of all three solar power processes.
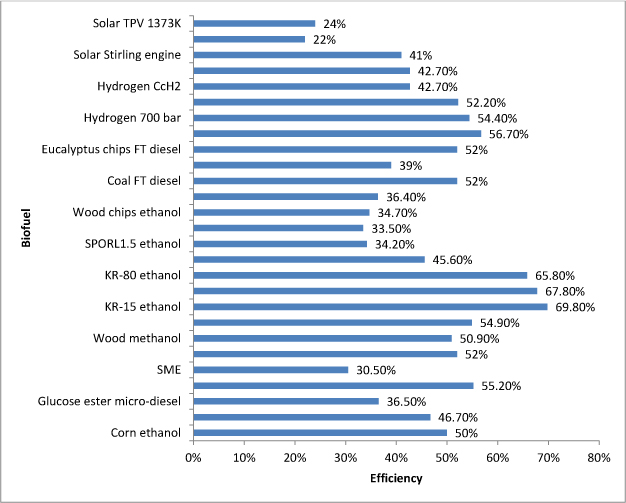
Figure 1. Bar graph of the efficiency percentages in Section 3 (see Table 6 for references).
5. Conclusion
The strength of current commercial and industrial demands requires that the introduction of an alternative to energy derived from fossil fuels needs to be of a comparable cost, volume of supply and contain an equal amount if not greater ability to provide energy. As scientists, we have a responsibility to enhance an awareness of current trends within this research field, such as the potential our waste has to become a significant source of renewable energy. Advances in second and third generation biofuels have tapped into the extraction of energy from product that is otherwise considered to be useless to society. This meta-study has presented the efficiency of recent and current technologies available to produce biofuels from renewable and sustainable resources. As technologies become more and more advanced, these efficiency percentages will only continue to improve until biofuels are a major source of worldwide transportation energy.
| Source Number | Feedstock | Biofuel | Technology | Efficiency (%) |
| [3,5] | Corn1,2 | Corn ethanol | Fermentation | 50.0 |
| [5] | Glucose | Butanol | Fermentation | 46.7 |
| [5] | Glucose | Ester micro- | Fermentation | 36.5 |
| [3] | Rapeseed2 | Methyl ester | Chemical trans-esterification | 55.2 |
| [3] | Soybean2 | Methyl ester | Chemical trans-esterification | 30.5 |
| [5] | Corn stover | Cellulosic | Fermentation | 52.0 |
| [5] | Wood | Methanol | Gasification | 50.9 |
| [5] | Lignocellulose | Methanol | Gasification | 54.9 |
| [7] | KR-15 | Ethanol | Pretreatment and SSF | 69.8 |
| [7] | KR-40 | Ethanol | Pretreatment and SSF | 67.8 |
| [7] | KR-80 | Ethanol | Pretreatment and SSF | 65.8 |
| [7] | SPORL3 | Ethanol | Pretreatment and SSF | 45.6 |
| [7] | SPORL1.5 | Ethanol | Pretreatment and SSF | 34.2 |
| [7] | DA | Ethanol | Pretreatment and SSF | 33.5 |
| [4] | Wood chips2 | Ethanol | NREL SSCF | 34.7 |
| [4] | Wood chips2 | FT diesel | Thermochemical gasification | 36.4 |
| [12] | Coal | FT diesel | FT process | 52.0 |
| [12] | Gas | FT diesel | FT process | 39.0 |
| [12] | Eucalyptus | FT diesel | FT process | 52.0 |
| [20] | Hydrogen | 350 bar fuel cell | SMR | 56.7 |
| [20] | Hydrogen | 700 bar fuel cell | SMR | 54.4 |
| [20] | Hydrogen | Cold gas fuel | SMR | 52.2 |
| [20] | Hydrogen | CcH2 fuel cell | SMR | 42.7 |
| [20] | Hydrogen | MOF 177 fuel | SMR | 42.7 |
| [21] | Solar | Heat flux | Stirling engine collector | 41.0 |
| [22] | Solar | Heat flux | TPV converter radiator @ 1228 K | 22.0 |
| [22] | Solar | Heat flux | TPV converter radiator @ 1373 K | 24.0 |
| 1Averaged from two data points mentioned in two sections 3.1.1 and 3.1.2. | ||||
| 2Efficiency percentage based on exergy ratio. | ||||
Acknowledgments
The authors would like to thank Dr. Jurgen Schulte for his helpful guidance, mentoring, and understanding through the entire progress of this report.
References
1. Biofuels 1. What are biofuels? Available online: http://www.greenfacts.org/en/biofuels/l-2/1-definition.htm (accessed on 25 May 2014).
2. Chakraborty, Sudip; Aggarwal, Varun; Mukherjee, Debolina; Andras, Koris. Biomass to Biofuel: a review on production technology. Asia-Pacific Journal of Chemical Engineering 2012, 7, 254-262.
3. Dewulf, J.; van Langenhove, H.; van de Velde, B. Exergy-Based Efficiency and Renewability Assessment of Biofuel Production. Environmental Science & Technology 2005, 39, 3878-3882.
4. Sohel, M.I.; Jack, M.W. Thermodynamic analysis of lignocellulosic biofuel production via a biochemical process: Guiding technology selection and research focus. Bioresource Technology 2011, 102, 2617-2622.
5. Huang, Wei-Dong; Zhang, Y-H Percival. Energy Efficiency Analysis: Biomass-to-Wheel Efficiency Related with Biofuels Production, Fuel Distribution, and Powertrain Systems. PLoS ONE 2011, 6, 1-10.
6. Typical calorific values of fuels. Available online: http://www.mdpi.com/files/word-templates/MDPI.ens (accessed on 26 May 2014).
7. Wang, Z.; Qin, M.; Zhu, J.Y.; Tian, G.; Li, Z. Evaluation energy efficiency of bioconversion knot rejects to ethanol in comparison to other thermochemically pretreated biomass. Bioresource Technology 2013, 130, 783-788.
8. Prins, M.J.; Ptasinski, K.J.; Janssen, F.J.J.G. Exergetic optimisation of a production process of Fischer-Tropsch fuels from biomass. Fuel Processing Technology 2005, 86, 375-389.
9. Gill, S.S.; Tsolakis, A.; Dearn, K.D.; Rodríguez-Fernández, J. Combustion characteristics and emissions of Fischer–Tropsch diesel fuels in IC engines. Progress in Energy and Combustion Science 2011, 37, 503-523.
10. Takeshita, T.; Yamaji, K. Important roles of Fischer–Tropsch synfuels in the global energy future. Energy Policy 2008, 36, 2773-2784.
11. Hamelinck, C.N.; Faaij, A.P.C.; den Uil, H.; Boerrigter, H. Production of FT transportation fuels from biomass; technical options, process analysis and optimisation, and development potential. Energy 2004, 29, 1743-1771.
12. van Vliet, O.P.R.; Faaij, A.P.C.; Turkenburg, W.C. Fischer–Tropsch diesel production in a well-to-wheel perspective: A carbon, energy flow and cost analysis. Energy Conversion and Management 2009, 50, 855-876.
13. Prins, M.J.; Ptasinski, K.J.; Janssen, F.J.J.G. Exergetic optimisation of a production process of Fischer–Tropsch fuels from biomass. Fuel Processing Technology 2005, 86, 375-389.
14. Bulushev, D.A.; Ross, R.H.J.; Catalysis for conversion of biomass to fuels via pyrolysis and gasification: A review. Catalysis Today 2011, 1-13.
15. Maity, J.P.; Bundschuh, J.; Chen, C.-Y.; Bhattacharya, P. Microalgae for third generation biofuel production, mitigation of greenhouse gas emissions and wastewater treatment: Present and future perspectives – A mini review. Energy.
16. Singh, Nirbhay Kumar; Dhar, Dolly Wattal. Microalgae as a second generation biofuel. A review. Agronomy Sustainable Development 2011, 31, 605-629.
17. Suali, E.; Sarbatly, R. Conversion of microalgae to biofuel. Renewable and Sustainable Energy Reviews 2012, 16, 4316-4342.
18. Cheng, J.J.; Timilsina, G.R. Status and barriers of advanced biofuel technologies: A review. Renewable Energy 2011, 36, 3541-3549.
19. Pittman, Jon K.; Dean, Andrew P.; Osundeko, Olumayowa. The potential of sustainable algal biofuel production using wastewater resources. Bioresource Technology 2011, 102, 17-25.
20. Paster, M.D.; Ahluwalia, R.K.; Berry, G.; Elgowainy, A.; Lasher, S.; McKenney, K.; Gardiner M. Hydrogen storage technology options for fuel cell vehicles: Well-to-wheel costs, energy efficiencies, and greenhouse gas emissions. International Journal of Hydrogen Energy 2011, 36, 14534-14551.
21. Chen, Chieh-Li; Ho, Chia-En; Yau, Her-Terng. Performance Analysis and Optimization of a Solar Powered Stirling Engine with Heat Transfer Considerations. Energies 2012, 5, 3573-3585.
22. Wernsman, B.; Mahorter, R.G.; Siergiej, R.; Link, S.D.; Wehrer, R.J.; Belanger, S.J.; Fourspring, P.; Murray, S.; Newman, F.; Taylor, D.; Rahmlow, T. Advanced Thermophotovoltaic Devices for Space Nuclear Power Systems. AIP Conference Proceedings 2005, 746, 1441-1448.