Practice Paper
Achieving ‘best value’ for the community by deployment of risk based cost estimation using Monte-Carlo Simulation to rate-payer-funded capital intensive road projects.
Mahender Rao and Harshavardhan V. Ranade
Maribyrnong City Council, Victoria, Australia
DOI: http://dx.doi.org/10.5130/v1i1.4112
Abstract
This paper presents the application and validation of a new tool developed by the first author for accurate risk-based estimation of project budgets. Typical capital intensive projects to which this tool can be applied include road reconstruction, road resheet and road rehabilitation projects. Quantitative risk analysis and stochastic modeling using MonteCarlo simulation is embedded in the algorithms of the computer code. The tool forecasts a range of possible project costs and the probability of the occurrence of those costs by taking into account uncertainties and associated risks. Application of the tool to capital intensive road projects designed by the second author and constructed in 2011 & 2012 demonstrates its validity and utility. Comparisons of forecasted estimates using this tool with actual costs and with traditional deterministic methods of cost estimation (such as --point base-case estimates inclusive of contingency) provide valuable insights that can aid management in evaluating alternatives and in making informed decisions when estimating and allocating budgets to a portfolio of road projects.
Keywords: Risk-based cost estimation, road projects, Monte Carlo simulation, budget forecasting, infrastructure capital projects
Organisational Project Management
Vol 1 No 1 (2014) 74-95
Licensed: CC-BY (4.0)
Introduction
The traditional process of cost estimation of capital projects in local government relies on preparing single point base case estimates inclusive of an additional contingency amount. This single point base case estimate is based on the level of a project’s scope and design, historical data, current contractor rates and preliminary quotes from sub-contractors and other vendors (Nolder n.d). An additional amount known as CPI (Consumer Price Index) is added to each cost item every year to allow for inflation of labor, material and equipment costs. The contingency amount is often a fixed percentage, which is added to the overall project to allow for other costs that may be uncertain and/or beyond the control of the project team. The total figure is often considered the ‘estimate’ that is used for budgeting purposes for the capital project. For a portfolio of projects, it is easy to see the challenge this poses to accurately predict the project cost estimate and budget(s) that takes into account the risks and uncertainties capable of causing cost overruns.
This traditional process of cost estimation is a deterministic one that can be improved by correctly applying quantitative risk analysis techniques such as Monte Carlo simulation. Monte Carlo simulation is a stochastic process that relies on repeated random sampling and has been used successfully in a variety of industries including infrastructure for accurate and reliable prediction of project budgets and associated probability. The work carried out by Tan and Makwasha (2010) — in which they attempt to ‘draw the attention of transport agencies to the ‘Best Practice Cost Estimation’ (‘the Standard’) in the preparation of cost estimates for any proposed project(s)’ — is a classic example in an Australian context. There has, however, been very little or no application of estimation tools and techniques based on Monte Carlo simulation to infrastructure improvement projects in local government within Australia. The objective of this work therefore was to achieve ‘best value’ for our community on ratepayer-funded, capital-intensive infrastructure improvement projects in local government. The application of this customized tool to road improvement projects at Maribyrnong City Council is demonstrated and benefits gained by achieving significant cost savings are presented. Key benefits of its application in local government include:
- Increased certainty of project cost;
- Improved budgeting;
- More efficient programming and prioritization of works;
- Communication to community.
Uncertainty, risk and contingency
In local government infrastructure projects, the risk of forecasted budgets being inconsistent with actual expenditures is a present day reality that poses challenges to senior management. The objective always is to achieve the match between the budgeted and actual cost figures. This inconsistency may be due to uncertainty not being properly considered in the estimation/budget preparation process.
What is uncertainty?
According to Elkjaer M (2000), assessment of cost items and generic risks, which he regards as stochastic variables in the budget, encompasses uncertainty. Uncertainty, according to Tan and Makwasha (2010) refers to ‘a range of values for a certain quantity where probabilities are unknown’ and risk refers to the ‘possibility of loss or gain as a result of uncertainty’. Kaplan & Garrick (1981) in Bedford & Cooke (2003) define risk to be a set of scenarios, si, each of which has a probability pi and consequence xi. Tan and Makwasha (2010) differentiate between inherent (or planned) risk and contingent (or unplanned) risk.
According to Lawrence (2007) any estimate, by definition, is imprecise and carries financial risks, the cost implications of which are reflected in the application of contingency to an estimate and in assigning an accuracy range to that estimate. He holds that excessive statistical terminology in literature only adds to the confusion and lack of understanding of the correct calculation and application of contingency. At Maribyrnong City Council, a flat 15% is used as contingency on top of the single point base estimate to cushion the impact of inherent and contingent risk.
In the GoldSim User’s Guide, when quantifying uncertainty, there are two fundamental causes that are important to distinguish between:
- That due to inherent variability of certain parameters; and
- That due to ignorance or lack of knowledge/adequate information that can be reduced by collecting more data and research.
They suggest that it is preferable to explicitly distinguish variability from ignorance so that the uncertainty in the impacts can be reduced. A classic example of point # 2 above in Council road improvement projects is the need for a thorough investigation of alternative drainage layouts (which is hardly done) in the feasibility stage of road improvement projects as this has impacts on several related cost components. The appendix contains information on such investigation performed by the second author for the case studies presented in this paper. Cost impacts associated with the quantity of materials required in a proposed pavement design for full-depth road reconstruction also require adequate economic analysis. Alternative pavement designs and associated construction methods need to be investigated thoroughly for potential cost implications rather than proceeding with just the one technical/design solution. Similarly, more than one civil design proposed for an urban road needs to be investigated for potential cost implications due to service alterations, quantity of rock encountered during excavations for underground drainage, construction costs anticipated and overall material costs (e.g. asphalt regulation tonnage etc in the case of road resheets) rather than relying solely on subjective assessment. Although knowledge of past projects in the area is helpful, a thorough analysis helps to reduce uncertainty and its cost impacts.
Hollman (quoted in Lawrence, 2007) elaborates on causes of uncertainty and project risk due to systemic and project-specific risks as well as on the two important drivers of cost growth:
- The level of completeness of the project front end definition (which is within the control of the project team);
- The project type (which is largely outside the control of the team).
In Council infrastructure projects, the cost estimator or designer prepares an estimate based on the scope of work supplied to him/her at the initial stage. Any items not picked up by the estimator or omitted from the scope of works will remain as potential risks to the project cost outcome. Similarly, clearly defined items of work will carry less risk than ill-defined or loosely defined items of work. If the scope itself is revised at a later date in the project lifecycle, then according to Lawrence (2007), a separate estimate needs to be prepared for the revised scope to account for the cost variations due to the new uncertainty and associated risks. Contingency and management reserves, terms excellently explained by Lawrence (2007), are not funds for scope changes.
As the design evolves and project progresses, the less risk and uncertainty there is in successive estimates of the project as more and more ‘unknowns’ become ‘knowns’, i.e. the uncertainty (or ranges of cost outcomes) is reduced and therefore the associated risks.
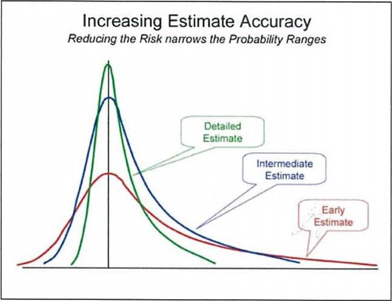
Figure 1. Reducing risk reduces the range and the contingency requirement (Lawrence 2007)
Therefore, how well developed the scope is for a project at the time of developing the estimate for budgeting purposes is paramount in the forecasting process. If no cost estimates are prepared for budgeting purposes and project budgets are allocated based on ‘guesstimate’ of quantities and subjective assessment then the allocated budget could be extremely misleading and often difficult to defend, as will be explained through the case studies in this paper. Subjective assessments are opinions and judgment based on historical data and experience/knowledge in a specific area. At Maribyrnong City Council, preliminary single point estimates are prepared by design engineers only after allocation of projects and project budgets.
Lawrence (2007) elaborates that the project type is also a systemic risk driver to the project cost outcome. In majority of Council infrastructure projects, the project type is not too different or complex (barring exceptions) from projects done the previous financial year.
Project-specific risks, says Lawrence (2007), ‘are those drivers that are unique to a given project’s scope or strategy’. These project-specific risk drivers are predominant in some local government projects and can only be identified through risk analysis. An authorization estimate may need to be prepared that tries to mitigate the project-specific risks through effective and clearly defined scoping and forward planning.
Traditional ways of risk mitigation
According to an IBM technical paper (n.d.), uncertainty, traditionally, is addressed in one of three ways:
- Point estimates,
- Range estimates,
- What-if scenarios.
Point estimates, which are the easiest, use the most likely values for the uncertain variables. This could give misleading estimates.
Range estimates typically show you a range of outcomes such as: the best case, the worst case and the most likely case, but not the probability of any of these outcomes. This approach considers only a few discrete outcomes, ignoring hundreds of thousands of others.
What-if scenarios are typically about exploring the effect of controllable things and are usually based on range estimates. What is the worst case? This form of analysis can be time consuming, and results in a great deal of data.
Austroads (2005), quoted in Tan and Makwasha (2010), describe the pros and cons of sensitivity analysis for considering uncertainty. Sensitivity analyses test if ‘designed’ or intended changes in key variables (inputs) have considerable impact on project cost. Sensitivity analysis has its drawbacks, which they elaborate further.
What is required?
An approach that considers the potential monetary effect of project risks on the project cost together with the likelihood of the occurrence of that risk is required. A probability distribution curve of the range of cost outcomes can then be developed. This leads us to the next section — Probabilistic risk analysis.
Probabilistic or quantitative risk analysis
The process of quantitative or probabilistic risk analysis involves the development of a ‘probabilistic model’ to identify and quantify project uncertainties. The model output provides a view of the risk and associated uncertainty with project costs (Tan and Makwasha, 2010).
Quantitative risk analysis usually follows qualitative assessment of projects. A qualitative assessment of projects may include assessment of potential consequences and treatment measures in which the probabilities are unknown. Through a qualitative assessment of projects a portfolio of projects is usually presented. Once projects are shortlisted, quantitative analysis may follow by preparation of base estimates. The base estimates may thus form the basis of the quantitative aspect of risk assessment. In the generation of base estimates there are typically a large number of uncertainties involved for a large project (Tan and Makwasha, 2010). Quantitative risk analysis attempts to take into account, understand and possibly manage these uncertainties.
The Goldsim User’s Guide categorizes four sources of uncertainty:
- Value or parameter uncertainty;
- Uncertainty regarding future events, e.g. weather conditions, strike(s) etc;
- Conceptual model uncertainty; and
- Numerical model uncertainty.
Agencies typically assess risk based on the upper and lower ranges of measured input items. This is a deterministic approach.
Probabilistic risk analysis instead permits ranges for values of inputs such as low, most likely or high values but gives the probability of the project cost being higher or lower.
Probabilistic risk assessment helps answer three basic questions (Source: http://en.wikipedia.org/wiki/Probabilistic_risk_assessment):
- What can go wrong?
- What and how severe are the adverse consequences?
- How likely to occur are these adverse consequences (i.e. what are their probabilities or frequencies)?
The conventional approach to quantification of uncertainty during budgeting of road improvement projects is to ‘guesstimate’ the quantities for all items of work involved based on similar past projects and using engineering judgment. Single point base case estimates inclusive of an additional contingency amount may be employed. Such single point base case estimates are deterministic models. In a deterministic model all mathematical and logical relationships between the elements are fixed. Consequently, these relationships completely determine the solutions (Rubinstein, 1981). It is easy to see the challenge this poses to accurately predict the project cost estimate and budget(s) that takes into account the risks and uncertainties capable of causing cost overruns. In some instances, as at Maribyrnong City Council, preliminary estimates are prepared by design engineers only after allocation of projects.
From a budgeting and planning perspective, the ideal situation is when the budgeted cost figures match the actual cost figures, but in the local government real-world this is achieved only occasionally on projects without the use of quantitative risk analysis. When the budgeted figures are less than the actual expenditures incurred, there is underestimation of the budgeted costs. This leads to a shortage of funds. Similarly, when the budgeted figures are more than the actual expenditures incurred, there is a surplus of funds implying under-expenditure, which results in fund carryovers between financial years. Understandably, both underestimation and under-expenditure is undesirable to senior management. Lawrence (2007) observes that it is ‘rational human desire to meet targets and avoid censure’. The objective always should be to achieve the match between the budgeted cost figures and the actual cost figures. This demonstrates the need for a customised tool that routinely incorporates quantitative risk analysis for budget forecasting and cost estimation of ratepayer-funded, capital-intensive infrastructure improvement projects to achieve ‘best value’ for our community. For the typical road improvement projects shown in this paper, a customised tool that adds probabilistic risk analysis capabilities to the deterministic single point base case estimate routinely used at Maribyrnong City Council was developed by the first author. The application of this tool to road improvement projects designed by the second author is demonstrated as case studies in this paper.
Probability function
A probability distribution is a mathematical representation of the relative likelihood of an uncertain variable having certain specific values (GoldSim User’s Guide). This mathematical representation is a function that could be discrete or continuous. There are many types of probability distributions. Vliet (2010), Nolder (n.d.), Kalos and Whitlock (1986) and Rubinstein (1981) provide detailed information on the many types of probability distributions. Common distributions are the normal, uniform and triangular distributions, illustrated in Figure 2 below.
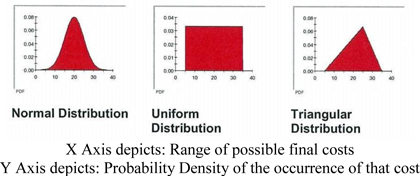
Figure 2.
Three of the common types of Probability Distributions (GoldSim User’s Guide n.d.)
The nature of an uncertain parameter, and hence the form of the associated probability distribution, can be either discrete or continuous (GoldSim User’s Guide). ‘A discrete probability function applies when a finite number of values can occur’ (Tan and Makwasha, 2010). A continuous probability distribution, on the other hand, is when any value within the range can occur. The normal, uniform and triangular distributions shown in Fig. 2 above are continuous probability distributions. For a continuous distribution,

Where f(x) is the probability density function (PDF) of the variable x and μ is the expected value (GoldSim User’s Guide).
This tool implements the triangular distribution in its algorithms. The triangular distribution assigns higher probabilities to values near some chosen point within the specified range and lower chances of occurrence to values near the boundaries of the range. The distribution can be described in terms of low, high or most likely values, which represent the minimum value (a), maximum value (b) and modal value (c) respectively. Note that that the ‘most likely’ value is the mode of the set.
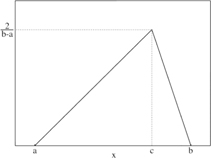
Figure 3.
Triangular distribution – probability density function
Source: http://en.wikipedia.org/wiki/Triangular_distribution
The triangular distribution lends itself well to Council road improvement projects, as will be demonstrated later through the case studies. This is because for many of the cost components involved in a typical project (i.e. for many of the line items in an estimate sheet) there will realistically be a ‘most likely’ value (e.g. asphalt tonnage, kerb length to be re-laid, number of pits and pipes required etc).
The triangular distribution function f(x) with lower limit a, mode c and upper limit b, implemented in this tool, is represented by Equation (2) as follows:
(Source: http://en.wikipedia.org/wiki/Triangular_distribution)
The output probability distributions can be graphically displayed in a number of ways, such as a probability distribution function or PDF (probability mass functions or PMF in case of discrete distributions), histograms or as a cumulative distribution function (CDF) in which the vertical axis is scaled from 0 to 1. The CDF answers the question: What is the chance (i.e. probability) that the cost will be below (or above) a certain value?
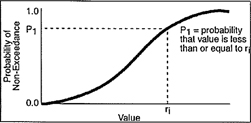
Figure 4.
Cumulative distribution function (GoldSim User’s Guide).
Quantiles or percentiles of the CDF are often used to describe the probability distributions. Percentiles divide the total frequency of occurrence into hundredths. For e.g., the 90th percentile (or P90) is that value of the parameter below which 90% of the distribution lies, implying 90% confidence level.
According to the GoldSim User’s Guide, ‘in order to compute the probability distribution of predicted performance, it is necessary to propagate (translate) the input uncertainties into uncertainties in the results. A variety of methods exist for propagating uncertainty’. One common method for propagating the uncertainty to the predicted performance is Monte Carlo simulation.
Modelling and Monte Carlo simulation
Literature abounds with a plethora of case studies in a variety of industries that prove risk analysis can greatly benefit from Monte Carlo simulation. Different authors distinguish between Monte Carlo simulation and the Monte Carlo method. There is no consensus on how it should be defined. Sawilowsky, in a wiki article on the Monte Carlo method, states that ‘the Monte Carlo method is a technique that can be used to solve a mathematical or statistical problem, and a Monte Carlo simulation uses repeated sampling to determine the properties of some phenomenon (or behavior)’. Rubenstein (1981) explains differences between the Monte Carlo method and simulation.
Monte Carlo simulation in the context of this work is a computer-based process involving repeated random sampling from probability distributions of the inputs, which are specified as a range of values, to obtain the expected value of a random variable — the budget forecast. The range of values is known as the ‘domain’. This provides an opportunity to quantify the uncertainty involved in quantities and rates for each line item of work in the project estimate. A deterministic computation is then performed on the inputs and the results are aggregated.
According to the GoldSim User’s Guide, if inputs are uncertain, the prediction of the future performance is necessarily uncertain, i.e. ‘the result of any analysis based on inputs represented by probability distributions is itself a probability distribution’. PDFs, CDFs and/or histograms are used to present/display the results of the analysis.
The purpose of employing a stochastic process in the form of Monte Carlo simulation in the context of this work is to depict the likely uncertainty of a fiscal result, and Monte Carlo simulation is probably the most easily usable form of probability analysis.
Like the input parameters, the results of Monte Carlo simulation models are also in the form of probability distributions that take into account all uncertainties and risks.
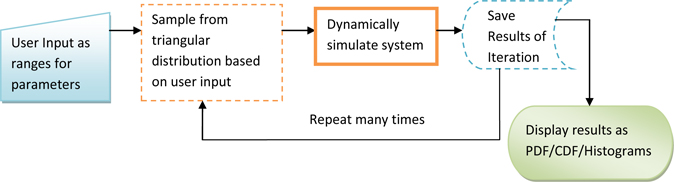
Figure 5.
Flowchart of the Monte Carlo simulation process implemented in this tool
Tool
Existing statistical and modelling software solutions have different methods for addressing risk analysis. Some modelling solutions, such as the tool presented in this article, work in the Microsoft Excel environment. The advantage of this approach is that Councils can easily incorporate risk management into everyday processes, as Microsoft Excel is a readily available tool. Monte Carlo simulation products available in the market today act as standalone solutions for risk management and either provide functions to simulate from all of the standard probability distributions or offer two-dimensional Monte Carlo simulations. Custom coding may be necessary if you want to use these solutions. For some tools, it is not clear how a model is built within their framework.
The Monte Carlo simulation implemented in this tool computes the full range of possible cost outcomes for each line item of work in the single point project estimate and assesses potential combinations of costs to develop a likely range of costs for the overall project. Random values from within the ranges specified by the user are fed as model inputs to the triangular probability distribution and the model runs 10,000 times to produce numerous possibilities of costs and probabilities instead of a few discrete scenarios.
The tool facilitates both approaches — deterministic and probabilistic analysis. If no ranges are specified then no simulation is performed and a deterministic solution is obtained. When displaying the results post-simulation, the tool also has the ability to compare the simulated (or forecasted) cost with the cost obtained through the deterministic single point estimate. This comparison should aid management in selecting the desired level of risk for the project at the budgeting stage.
The tool is designed to help practitioners in local government use Monte Carlo simulation routinely for risk-based cost estimation of capital-intensive road projects. The simulation process can be carried out at any time and any number of times. The user is not overloaded with the mathematical theory to use the program.
P50 & P90 cost estimation
Typically, the expected cost of a portfolio of projects is of more interest to management than individual projects costed separately. However, individual projects are required to be costed in the budget preparation process as well. As an initial first step and to demonstrate the application and validation of this tool, the work in this paper demonstrates examples of three individual projects designed and constructed between 2011 – 2012.
One obvious question that arose during the selection for comparison of the forecasted estimate with the actual cost and with traditional single point estimates was the choice between the P50 and the P90 value. The P50 cost value is an estimate of the project cost based on a 50% probability that the cost will not be exceeded. Similarly, The P90 cost value is an estimate of the project cost based on a 90% probability that the cost will not be exceeded.
Tan and Makwasha (2010) provide excellent information on P50 and P90 cost estimation, issues encountered by practitioners and how to deal with the current practice of ‘pricing contingencies’ in project cost estimation. Given the commercial and political exposure in respect of capital budgets it is understandable to prefer a P90 figure. The validation of the examples presented in this paper provides insight on the choice of the P50 or P90 value for cost estimation of typical Council road improvement projects.
According to Bedford and Cooke (2003), for consequence analysis, ‘the predictive quality of a model is the only thing that is important’.
Deterministic and probabilistic simulation approaches
In the deterministic approach, the user chooses single values for each parameter even though the uncertainty in the value of each parameter is implicitly recognized by the user. The outcome of a deterministic computation is a ‘single result’. This results in adoption of ‘best case estimates’ or ‘worst case estimates’, which can be extremely misleading and often difficult to defend. ‘Deterministic analyses also do not lend themselves directly to detailed uncertainty and sensitivity studies’ (GoldSim User’s Guide). Usually, a series of separate exercises are required to be carried out in which various parameters are varied. This is time consuming and results only in a limited analysis of uncertainty and sensitivity.
In probabilistic analysis, the uncertainty in the input parameters is explicitly represented as probability distributions and this uncertainty is propagated through to the result (using Monte Carlo simulation in this tool). The outcome of a probabilistic analysis is itself a probability distribution. This results in adoption of an estimate based on a desired level of risk or confidence level. Probabilistic analysis, however, is commonly perceived as too complex, too difficult or unrealistic. Although this sentiment is becoming less prevalent, it is important for tools developed based on probabilistic analysis to be simple to use, transparent and reliable, for routine application in local government offices, as is the case with this tool.,
Validation through case studies
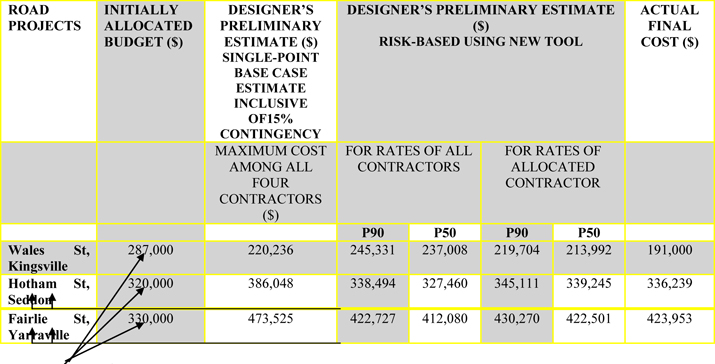
Note 1: The Maximum value of the estimate (between the four contractors on the panel) is Council’s conventional ‘worst case’ which was also the ‘Revised Budget’.
Note 2: All contracts are based on Council’s ‘Schedule of Rates’.
Note 3: Project details and photos are given in Appendix. To date, the tool was applied only to the three projects shown in the table above for which the second author was the allocated design engineer. The application of the tool to these projects was a joint initiative by both authors.
Table 1. Deterministic and risk-based project estimates — comparisons with actual final cost
Findings
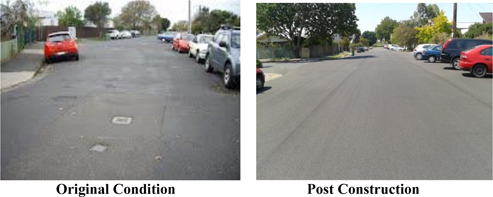
Wales St, Kingsville
- The P50 value predicted at the preliminary stage (when uncertainty is highest), considering only the rates of the allocated contractor, predicted the closest value for budgeting purposes when compared with the actual final cost. In the absence of contractor allotment at the preliminary stage, the P50 value considering the rates of all four contractors could have been chosen as the budget. The surplus amount would get balanced with deficits on other projects when managing finances/budgets across a portfolio of projects, it is anticipated.
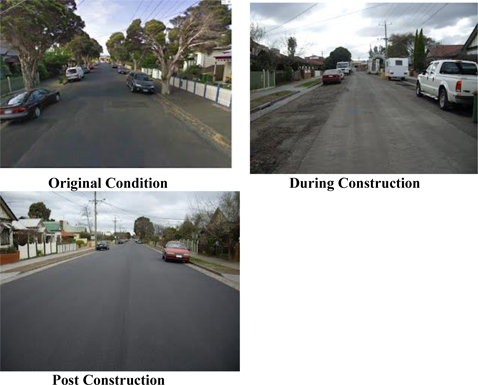
- The reason for the surplus amount was the substantial cost saving achieved by producing a good technical design that was mindful of the cost impacts. Careful design by the second author resulted in an optimal drainage layout thereby achieving significant savings in quantity of drainage required for the street and in the cost components that depended on the chosen drainage layout. Parameter studies in CivilCAD showed that offsetting the crown of the road would result in lesser asphalt regulation on site and this was verified to be true, during and post construction of the works and by the significant savings achieved. The ‘During construction photo’ in the Appendix clearly depicts the savings achieved by minimizing asphalt mill and fill as a result of keeping almost the entire middle portion of the road intact in design. This also helped to maintain the structural integrity of the existing pavement. This is an important aspect in design that, when considered and designed correctly, helps mitigate the uncertainty associated with quantity of asphalt regulation required on site. It assumes even more importance in the case of lump-sum contracts.
- The initially allocated budget was significantly higher (by $96,000) than the actual cost incurred.
Hotham St, Seddon
- The P90 value predicted after considering rates of ‘All Contractors’ at the preliminary stage (when uncertainty is highest) predicted the closest value to the actual final cost.
- The maximum project cost estimate among all four contractors in the single point base case estimate at the preliminary stage (which was Council’s ‘worst case’) significantly overestimated the project cost.
- The initially allocated funding for the project was inadequate.
Fairlie St, Yarraville
- The P90 value predicted at the preliminary stage (when uncertainty is highest) after considering rates of ‘All Contractors’ predicted a reasonably reliable value when compared with the actual final cost. It is anticipated that the minor deficit in the predicted amount would get balanced with anticipated surpluses on other projects when managing budgets and finances across a portfolio of projects.
- The maximum project cost estimate among all four contractors in the single point base case estimate at the preliminary stage (which was Council’s ‘worst case’) significantly overestimated the project cost.
- The initially allocated funding for the project was substantially inadequate.
Comments
- The traditional process of allocating budgets solely based on past experience and judgment has its pitfalls given the unique challenges and constraints each individual project presents, as demonstrated through the case studies.
- In the estimation process using this new tool, risks were integrated into the costing process thereby giving reliable results. Careful assessment and systematic judgment was exercised in the data that was fed to the model.
- It should be noted that the forecasts are dependent on the ranges specified by the user, the type of underlying distribution and the amount of iterations. Different figures are to be expected when employing different types of underlying distributions and data. The triangular distribution, for the case studies shown, has demonstrated its validity and appropriateness given these promising results.
- In the case of Wales St, the budget was significantly over-allocated. However, it must be noted that had care not been exercised in the design process in terms of value engineering the drainage layout and quantity of asphalt regulation, additional money could have easily been spent and the allocated budget would have proved correct. This also stresses the importance of incorporating value engineering processes during design. Wales St was the second author’s first major capital-intensive road project in local government and substantial cost savings were still achieved by producing a good technical design.
- In the case of Hotham St, the budget was marginally under-allocated. However, the under-allocation was nominal and it is expected that the deficit would have been balanced out when managing finances across a portfolio of projects.
- In the case of Fairlie St, the budget was severely under-allocated. Site constraints limited the amount of value engineering that could be done during design and this is a classic case justifying the need for an advanced, scientific tool for budget forecasting.
- Based on the findings, it is recommended that a P90 value be chosen for typical Council road improvement projects that are similar to the case studies shown. More rigorous application of this tool to a variety of projects is suggested for further confirmation.
- The tool demonstrated potential benefits of accurately forecasting project budgets when contractors were allocated to projects early on. This removes one uncertainty in the process and emphasizes the importance of proper programming of contractors with due consideration given to adequate lead time in obtaining design drawings. It is common knowledge that for typical projects, such as the ones illustrated, the construction time is significantly less than the time required for preparation of designs and drawings and associated project management. This needs to be factored in when programming contractor allocation to jobs with the necessity of reasonable lead time between jobs appropriately balanced and communicated to the respective contractors.
- The case studies show that quantities and risks due to uncertainties were correctly modeled and included in the estimation process by the design engineer/second author.
- The authors do not claim that this is the most appropriate or ultimate budgeting/cost estimation tool but it is an advance on current conventional deterministic processes, yielding reliable fiscal results as demonstrated through the promising outcomes achieved.
Conclusion
In local government infrastructure projects, the risk and uncertainty involved is limited to a few line items as compared to large-scale infrastructure projects. Fairlie St and Hotham St findings clearly demonstrate the benefits of using such a tool in the feasibility stage when budgets are allocated to projects. The benefits of the tool presented in this paper are anticipated to be even more on bigger projects where the uncertainty and risks involved are significantly greater. The demonstrated case studies are good precursors to the routine application of this tool to more complex projects. The risk-based estimation tool presented is definitely a useful tool that could be routinely applied in local government for budget forecasting of capital intensive infrastructure projects.
It should be emphasized that a forecast is only as good as the probabilistic model and the quality of data that is fed to the model. A probabilistic analysis does not necessarily imply precluding the use of a deterministic analysis. In fact, deterministic analysis is often required to provide input to probabilistic analysis. The key point is that deterministic analyses alone can have significant disadvantages and, in such cases, should be complemented by probabilistic analyses as is seen through the fiscal results of the case studies.
Estimation and forecasting (using either method) in isolation may not result in accurate prediction of projects costs and budgets. It is the synergy between design knowledge and construction knowledge that needs to come together in conjunction with value engineering in the design process and timely use of sound scientific tools such as the one presented in this paper to ensure success in accurate forecasting of project costs and budgets. The work presented in this paper is therefore an essential precursor to the application of this tool to a portfolio of projects in any given financial year. It clearly demonstrates the benefits gained for our community by applying advanced scientific tools that are simple to use and are based on sound theory to ratepayer-funded, capital-intensive infrastructure improvement projects in local government in Australia.
Acknowledgements
The authors would like to thank Maribyrnong City Council for the support and encouragement to attend the 2013 International Public Works Conference (IPWEA) in Darwin, Australia to present this paper. This paper was first published and presented in the International IPWEA Conference in August 2013 held in Darwin, Australia.
References
Appendix A Introduction to Probabilistic Simulation & Appendix B: Probabilistic Simulation Details, User’s Guide GoldSim, Online, Available: http://www.goldsim.com/Web/Downloads/UserManuals/ (Accessed 5 Jan 2013).
Bedford, T. & Cooke R. 2003. Probabilistic Risk Analysis – Foundations and Methods, Cambridge University Press, United Kingdom.
Course Notes. 2006. New York University Computer Science Department, Chapter 9 Monte Carlo Methods, Online, Available: http://www.cs.nyu.edu/courses/fall06/G22.2112-001/MonteCarlo.pdf (Accessed 15 Feb 2013)
Elkjaer, M. 2000. ‘Stochastic Budget Simulation’, International Journal of Project Management, vol. 18, pp. 139-147, [Online]. Available: http://140.118.5.28/OM_Notes/[7]%202000-Stochastic%20budget%20simulation.pdf [Accessed: 5 May 2013].
Evans and Peck Report for Department of Infrastructure, Transport, Regional Development and Local Government. 2008. Best Practice Cost Estimation for Publicly Funded Road and Rail Construction, Online, Available: http://www.nationbuildingprogram.gov.au/publications/administration/pdf/Best_Practice_Cost_Estimation.pdf (Accessed 10 Jan 2013)
Guerrero, H. 2010. Excel Data Analysis – Modeling and Simulation, Springer-Verlag Berlin Heidelberg. doi:http://dx.doi.org/10.1007/978-3-642-10835-8
IBM Software Business Analytics, Better Decision Making Under Uncertain Conditions using Monte Carlo Simulation, Monte Carlo Simulation and Risk Analysis Techniques in IBM SPSS Statistics, Online, Available: http://www-01.ibm.com/common/ssi/cgi-bin/ssialias?infotype=SA&subtype=WH&htmlfid=YTW03231GBEN (Accessed 18 Feb 2013)
Kalos, M H & Whitlock, P A. 1986. Monte Carlo Methods - Volume 1, New York University, John Wiley and Sons, United States of America. doi:http://dx.doi.org/10.1002/9783527617395
Lawrence, G. R. 2007. ‘Use and Misuse of Capital Cost Estimate Contingency – Why Deleting it Makes Projects More Expensive, Not Less’, PHARMACEUTICAL ENGINEERING: The Official Magazine of ISPE, vol. 27, no. 5, [Online]. Available: http://ap-networks.com/dmdocuments/2007-09-01-Pharmaceutical%20Engineering-Contingency.pdf [Accessed 2 May 2013].
Maher, M L J & McGoey-Smith, A D. 2006. ‘Risk based Cost and Schedule Estimation for Large Transportation Projects’, Association for European Transport and Contributors, Online, Available: http://dandelion-patch.mit.edu/afs/athena/course/11/11.951/oldstuff/albacete/Other_Documents/Europe%20Transport%20Conference/innovative_transport_i/riskbased_cost_and1510.pdf (Accessed 3 Mar 2013).
‘Monte Carlo Method n.d., Wikipedia, wiki article, Online, Available: http://en.wikipedia.org/wiki/Monte_Carlo_method (Accessed 12 Jan 2013).
Nolder, G., n.d., Improving cost estimation with Quantitative Risk Analysis”, Vose Consulting Technical Paper, Online, Available: <http://www.hearne.com.au/getattachment/1d404448-b762-426c-af13-999a56267105/Improving-Cost-Estimation-with-Quantitative-Risk-A.aspx> (Accessed 12 Dec 2012).
Palisade, Monte Carlo Simulation, Online, Available: http://www.palisade.com/risk/monte_carlo_simulation.asp (Accessed 18 Dec 2012).
Piyatrapoomi A, Kumar A, Robertson N and Weligamage J (2005) ‘Identification of critical input variables for risk-based cost estimates for road maintenance and rehabilitation’, 4th International Conference on Maintenance and Rehabilitation of Pavements and Technological Control, QUT Digital Repository, [Online]. Available: http://eprints.qut.edu.au/27200 [Accessed: 5 Jan 2013]
‘Probability Distribution’ n.d. Wikipedia, wiki article. Online. Available: http://en.wikipedia.org/wiki/Probability_distribution (Accessed 11 Jan 2013)
‘Probabilistic Risk Assessment’ n.d. Wikipedia, wiki article. Online. Available: http://en.wikipedia.org/wiki/Probabilistic_risk_assessment (Accessed 11 Jan 2013)
Research Note. 2010. ‘Risk based estimate Self-Modeling’, Washington State Department of Transportation, Online. Available: http://wsdot.wa.gov/Projects/ProjectMgmt/RiskAssessment/Information.htm (Accessed 25 Jan 2013)
Rubenstein, R Y. 1981. Simulation and the Monte Carlo Methods, Technion, Israel Institute of Technology, John Wiley and Sons, United States of America. doi:http://dx.doi.org/10.1002/9780470316511
Tan, F & Makwasha, T. 2010. ‘Best practice cost estimation in land transport infrastructure projects’, Australasian Transport Research Forum 2010 Proceeding, [Online]. Available: http://www.atrf.info/papers/2010/2010_Tan_Makwasha.pdf [Accessed 4 Jan 2013].
The beta-PERT distribution, RiskAMP: The beta-PERT distribution, Online. Available: http://www.riskamp.com/library/pertdistribution.php (Accessed 18 Jan 2013).
‘Three-point estimation’ n.d., Wikipedia, wiki article, Online. Available: http://en.wikipedia.org/wiki/Three-point_estimation (Accessed 11 Jan 2013).
‘Triangular Distribution’ n.d.. Wikipedia, wiki article, Online. Available: http://en.wikipedia.org/wiki/Triangular_distribution (Accessed 11 Jan 2013).
University of South Carolina Notes, Monte Carlo basics, Online. Available: http://cacs.usc.edu/education/phys516/01-1mcbasics.pdf (Accessed 20 Jan 2013).
Vliet, B.V. 2010. ‘Simulation with Financial Applications’, Online. Available: http://www.benvanvliet.net/Downloads/Simulation%20with%20Financial%20Applications.pdf (Accessed 16 Apr 2013).
‘What is Monte Carlo Simulation’ n.d., Online. Available: http://www.thumbstacks.com/files/RiskAMP%20-%20Monte%20Carlo%20Simulation.pdf (Accessed 16 Oct 2012).
Appendix — Case studies
Wales St, Kingsville (Constructed In 2011)
Project scope and photos
- Typical road rehabilitation project that involved the following components:
- Asphalt overlay of existing road pavement to new levels. This stretch of road between Geelong Rd Service Lane and Shackell St is approx 190 m in length and 8.5 m wide (between kerb lips).
- Removal and relaying of bluestone kerb and channel on both sides, to new levels.
- Replacement of existing asphalt footpath on one side with a charcoal coloured concrete footpath as per Council’s heritage guidelines.
- Removal and reconstruction of vehicle crossovers to new levels.
- Provision of underground drainage – pits and pipes (this section of road had no existing underground drainage infrastructure).
- Removal and replacement of some trees.
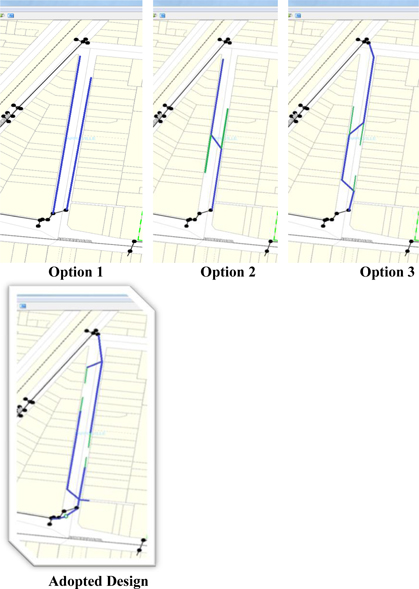
Drainage networks and associated costs investigated by designer in preliminary stage
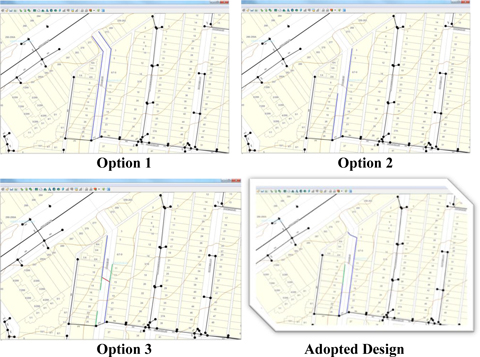
Note: Blue & green lines indicate proposed underground drainage that was investigated. The investigation for each option above involved producing preliminary kerb and road designs (long sections and cross sections), drainage designs, vehicle scraping checks for crossovers, tree issues, conflicts with service authorities if any and preparing risk based estimates to account for the uncertainty involved with each option shown above. All costs associated with each option were thoroughly investigated using the new tool prior to selection of the ‘adopted design’.
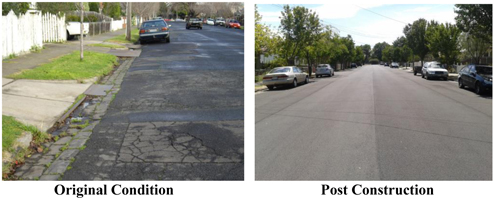
Hotham St, Seddon (Constructed In 2011)
Project scope and photos
- Typical road rehabilitation project that involved the following major components:
- Asphalt overlay of existing road pavement to new levels. This stretch of road between Perry St and Greig St is approx 225 m in length and varies in width from 7.2 m to 12.6 m (between kerb lips).
- Removal and relaying of bluestone kerb and channel on both sides, to new levels.
- Removal and replacement of existing asphalt footpath on both sides to a distance of 111 m.
- Removal and reconstruction of vehicle crossovers to new levels.
- Provision of underground drainage – pits and pipes (this section of road had no existing underground drainage infrastructure).
Drainage networks and associated costs investigated by designer in preliminary stage
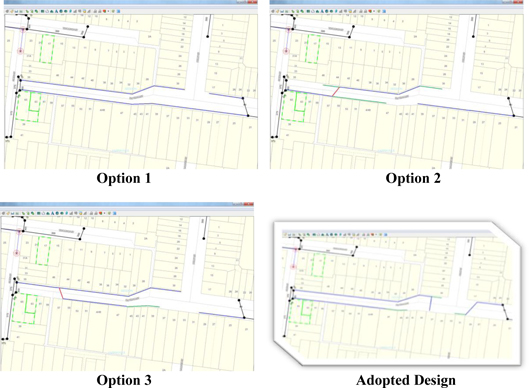
Note: Blue & green lines indicate proposed underground drainage that was investigated. The investigation for each option above involved producing preliminary kerb and road designs (long sections and cross sections), drainage designs, vehicle scraping checks for crossovers, tree issues, conflicts with service authorities if any and preparing risk based estimates to account for the uncertainty involved with each option shown above. All costs associated with each option were thoroughly investigated using the new tool prior to selection of the ‘adopted design’.
Fairlie St, Yarraville (Constructed In 2012)
Project scope and photos
Typical road rehabilitation project that involved the following major components:
- Asphalt overlay of existing road pavement to new levels. This stretch of road between Somerville Rd and Berry St is approx 270 m in length and 12.4 m wide (between kerb lips).
- Removal and relaying of bluestone kerb and channel on both sides, to new levels.
- Removal and reconstruction of vehicle crossovers to new levels.
- Provision of underground drainage – pits and pipes (this section of road had no existing underground drainage infrastructure).
- Liaison with City West Water regarding their water main renewal works in this section of the street.
Drainage networks and associated costs investigated by designer in preliminary stage
Note: Blue & green lines indicate proposed underground drainage that was investigated. The investigation for each option above involved producing preliminary kerb and road designs (long sections and cross sections), drainage designs, vehicle scraping checks for crossovers, tree issues, conflicts with service authorities if any and preparing risk based estimates to account for the uncertainty involved with each option shown above. All costs associated with each option were thoroughly investigated using the new tool prior to selection of the ‘adopted design’.
About the authors
Mahender Rao graduated as a Civil Engineer from Osmania University in India. He worked both as a construction and contracts engineer for Larsen & Toubro (L&T), one of the largest engineering firms in India having a turn-over of 13.5 billion US$. He specialized in activity based costing, tendering, contract management, etc. and won several prestigious residential, industrial and infrastructure contracts for the organisation. With a view to drive-in efficiencies in estimation practices he teamed up with private software experts and with their help, developed innovative Invoice Management, Project Finance Management and Risk Based Estimation Systems. Currently he is working for Maribyrnong City Council (MCC) as a Construction Engineer. He is now involved in testing those products by customizing them for MCC.
Harshavardhan V. Ranade holds a PhD in Structural Engineering from RMIT, Australia. He has a Master’s degree in Information Technology from Edith Cowan University in Perth, Western Australia and a Bachelors Degree in Civil Engineering from the University of Pune, India. He is a professional engineer with more than eight years of international experience in civil design of road and related infrastructure and structural design/analysis of buildings and bridges. He has worked in the public and private sectors in Australia and in the private sector in India. He currently holds the position of Design/Project Engineer at Maribyrnong City Council since 2009. He has developed new and innovative tools during and after his PhD which involved significant applied research, software development and finite element analysis of multi-storey buildings. The tools were validated on building designs for projects.