Commonwealth Journal of Local Governance
Issue 27
December 2022
RESEARCH AND EVALUATION (PEER REVIEWED)
Women, Ethnic Minorities and Local Electoral Success in Auckland, New Zealand

Karen Webster
School of Clinical Sciences, Auckland University of Technology, Auckland 0627, New Zealand, karen.webster@aut.ac.nz

Charles Crothers
School of Social Sciences and Public Policy, Auckland University of Technology, Auckland 1142, New Zealand, charles.crothers@aut.ac.nz
Corresponding author: Karen Webster, School of Clinical Sciences, Auckland University of Technology, Auckland 0627, New Zealand, karen.webster@aut.ac.nz
DOI: https://doi.org/10.5130/cjlg.vi27.8277
Article History: Received 14/07/2022; Accepted 07/10/2022; Published 20/12/2022
Citation: Webster, K., Crothers, C. 2022. Women, Ethnic Minorities and Local Electoral Success in Auckland, New Zealand. Commonwealth Journal of Local Governance, 27, 57–82. https://doi.org/10.5130/cjlg.vi27.8277
© 2022 by the author(s). This is an Open Access article distributed under the terms of the Creative Commons Attribution 4.0 International (CC BY 4.0) License (https://creativecommons.org/licenses/by/4.0/), allowing third parties to copy and redistribute the material in any medium or format and to remix, transform, and build upon the material for any purpose, even commercial, provided the original work is properly cited and states its license.
Abstract
This article examines the extent to which Auckland Council candidates and elected members have reflected the diversity of the unitary city’s population since the amalgamation in 2010 of eight former local authorities. The findings confirm that electoral candidates have become more ethnically and gender diverse at the local board level, but city-wide the trend away from New Zealand’s traditional European, male and older local representatives has been less pronounced. Overall the research presents an optimistic picture of post-reform representation in Auckland local democracy. There has been a significant increase in representation of women and Pacific and Asian people. However, the ongoing challenges facing Māori to achieve fair and effective representation in Auckland raise questions about the efficacy of the Local Electoral Act 2001, as the Auckland Council persistently chooses to retain first-past-the-post voting for its electoral system.
Keywords
Local Government; Representation; Diversity; New Zealand; Elections; Ethnicity; Gender
Introduction
This article addresses the question: in terms of gender and ethnicity, how closely have local government candidates and elected members reflected Auckland’s population since the amalgamations that created the new unitary city in 2010? The research builds on the baseline established in 2013 (Webster and Fa’apoi 2018) and explores trends in the gender and ethnicity of both unsuccessful candidates and those elected in Auckland’s 2013, 2016 and 2019 triennial local elections.
Fairness of local representation in Auckland, New Zealand’s largest region by population, has consistently featured as a topic of debate amongst media, citizens and representatives themselves. This concern is supported by election survey data (Department of Internal Affairs 2013; Local Government New Zealand 2019) which emphasised low descriptive representation – the idea that the characteristics of voters are mirrored in the representatives they elect (Pitkin 1967) – among New Zealand local elected members. Women identified as just 36% of candidates and 39% of elected members nationwide in 2019, against women as 51% of the population, and New Zealand European (NZE) elected members as 90% of all elected members, against 74% of all New Zealanders.
Asquith et al. (2021) have highlighted shortfalls in the region’s local democracy following the reforms, which include democratic deficit (in terms of both voter turnout and elected member to population ratios) and low citizen engagement. This raises questions about the influence of descriptive representation on the health of local democracy.
This research is premised on the purpose of the New Zealand Local Electoral Act 2001 being to implement “fair and effective representation for individuals and communities” (Section 4(1)(c)). It is further underpinned by the United Nations human rights framework, which argues for political representation that responds to changing demographics (McGregor et al. 2015); by Pitkin’s (1967) concept of descriptive representation; and by modern concepts of democracy advocating recognition of diversity (for a detailed discussion of these concepts see Webster and Fa’apoi 2018). Integral to this inquiry is recognition that the structure of local government elections has failed to deliver on the obligations of the Crown to Māori under Te Tiriti o Waitangi1 to promote their rights to fair and effective representation in governance. Also, the lack of data on the ethnicity of candidates and elected members in Auckland in the period preceding the 2010 reforms provides a strong rationale for this research.
The paper starts with an overview of the Auckland Council structure and electoral system. It then reviews international and New Zealand literature relating to local representation and diversity, including descriptive and substantive representation, social justice and Te Tiriti o Waitangi. This is followed by an outline of the changes to Auckland’s demography in the decade following the 2010 governance reforms. Next, findings in terms of elected member representation are presented and discussed. The paper concludes by highlighting the emerging trend of women’s leadership at the local level; an incremental but nonetheless visible increase in Pacific and Asian representation; and the ongoing challenges facing Māori to achieve fair and effective representation.
Structure of the Auckland Council
The Auckland region covers 4,894 km² and is home to over 1.7 million people (just over one-third of the national population) (Stats NZ 2020). From 1989 to 2010 it was governed by a regional council, four city councils and three district councils. Following a Royal Commission to determine how to best structure Auckland local governance for the future (Salmon et al. 2009), the 2010 reforms ushered in a single Auckland Council which is the largest local government in the Oceania region.2 Being a unitary council, it has the powers and responsibilities of both a regional council and a local authority. Its governance structure comprises a governing body (or council) based on 13 wards; 21 elected local boards; and seven arm’s-length council-controlled organisations which own and manage the city’s utilities, business units and property assets (for a detailed discussion see Webster amd Fa’apoi 2018). The geographic boundaries of the wards and local boards are shown in Figures 1 and 2.
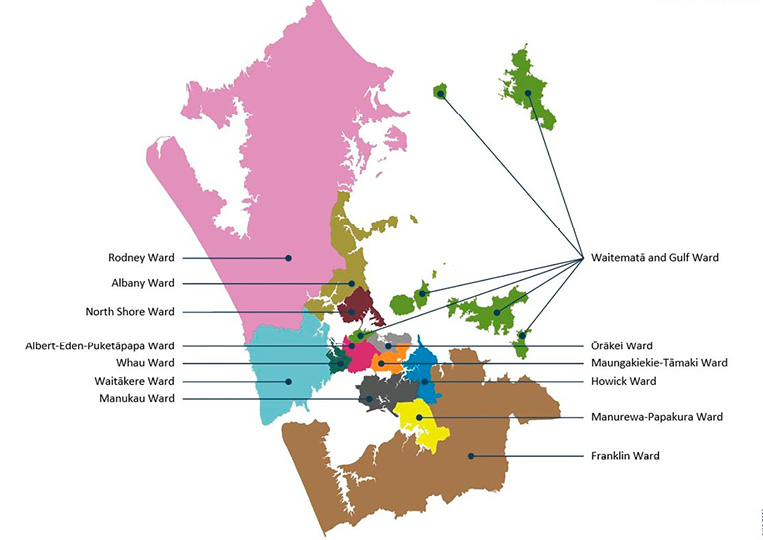
Figure 1. Auckland Council ward boundaries
Source: Auckland Council (2022)
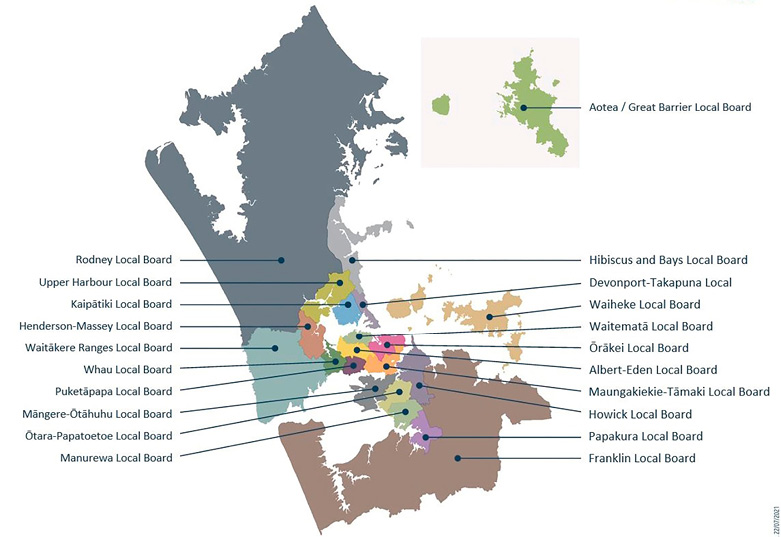
Figure 2. Auckland Council local board boundaries
Source: Auckland Council (2022)
The governing body, responsible for regional and strategic decision-making, is led by a popularly elected mayor, with 20 councillors elected via single- or multi-member wards. There are a further 149 elected members across the local boards, who make decisions on matters local to their communities. The local boards are organised via the ward system. Some of the more rural wards have sub-divisions, with or without local boards, by which individual councillors are elected. This is to ensure an even spread of elected members across the population. Sub-divisions are not referenced in the discussions of representation that follow.
New Zealand’s local electoral process
Any discussion of local government representation in New Zealand local government would be incomplete without consideration of the provisions of the Local Electoral Act 2001. Part 1 of the Act sets out to “implement fair and effective representation for individuals and communities” (s.4); and Part 2 seeks to operationalise this by establishing the ‘local electoral option’ which requires councils to review their electoral arrangements at least once every six years to consider whether they have fair and effective representation. Local authorities may opt for one of two electoral systems: first past the post (FPP), where the candidates with the most votes win seats; or single transferable vote (STV), where “voters express a first preference for one candidate and may express second and further preferences for other candidates” (s.5B). FPP is simple but results in many votes being ‘wasted’ because voters cannot express a ‘second choice’. STV, on the other hand, is more complex but results in fewer wasted votes and is recognised as producing results that broadly reflect voter preferences (Hayward 2016a).
When the electoral option was introduced the vast majority of local authorities in New Zealand opted to retain the FPP system. In 2004, just ten of the 87 local authorities chose STV, eight in 2007, six in 2010, seven in 2013 and eight in 2016. By 2019, 11 local authorities had opted for STV (Department of Internal Affairs 2021b). Hayward (2016b, p. 388) observed that “the electoral option enables incumbent councils with a self-interest in the decision to retain FPP, while at the same time making it difficult for communities to initiate, achieve and retain a change”. Hayward goes on to argue that the electoral option is an obstacle to effective representation and is in conflict with the spirit of the Local Electoral Act.
While the number of local authorities choosing STV has fluctuated, at the time of writing 15 (19%) of New Zealand’s (now 78) local authorities have opted for STV for the 2022 election (Department of Internal Affairs 2021b). This may bode well for Māori, whose representation in the national parliament has increased significantly since the introduction of mixed member proportional representation in 1993 “to a point where they make up a slightly larger proportion of Parliament than they do in the population as a whole” (Godfery 2016, p. 75). However Auckland, New Zealand’s most ethnically diverse city, persists with FPP as its electoral system.
The Local Electoral Act also enables local authorities to establish Māori wards or constituencies. Representation of Māori in local government stems from the obligations mandated to local authorities under the Local Government Act 2002 (s.4) “to recognise and respect the Crown’s responsibility to take appropriate account of the Treaty of Waitangi”. These obligations include enhanced statutory planning processes with scope for Māori participation in decision-making and a requirement to consider ways to enhance this capacity (Webster and Cheyne 2017). Furthermore, local authorities are required to “take account of Māori, their culture and traditions with respect to ancestral land, water, sites, wahi tapu, valued flora and fauna and other taonga” (Webster 2009, p. 110). However, research undertaken in 2010 found that for 80% of non-Māori councillors providing opportunities for Māori was their lowest priority (Webster 2009; Webster and Cheyne 2017).
The creation of Māori wards and constituencies was intended to be “one of the elements on the path to fair and effective representation and treaty-based local government relationships” (Bargh 2021, p. 72), but this was initially frustrated by a provision (repealed in 2021) allowing 5% of electors to force a poll. In 2017 five councils voted in favour of establishing Māori wards in their areas as part of their representative reviews, but all five of those council decisions were overturned the following year by polls (Bargh 2021, p. 72). However, the poll provision was repealed in 2021 and the number of councils opting for Māori wards for the 2022 local election increased to 35 (Wong 2022).
Notwithstanding the Royal Commission on Auckland Governance recommendations for Māori wards (supported by Māori during the consultation process), the 2010 reforms instead prescribed the establishment of an Independent Māori Statutory Board (IMSB). This is an entity separate from the Auckland Council, its purpose being to provide a voice for Māori in the governance of Auckland, and to assist the Auckland Council to make informed decisions and meet its statutory obligations in relation to the Treaty of Waitangi. The board described its role as promoting cultural, economic, environmental and social issues of significance to Auckland Māori, and ensuring the Council complies with the statutory provisions of the Treaty of Waitangi (Independent Māori Statutory Board n.d.). This is fulfilled by representation on committees and its relationship with the council executive. However, its appointees to committees have speaking rights only and their roles do not extend to decision-making. This has been a focus of some contention, for example during regional planning debates in 2016 (Lindsay 2016).
Diversity and concepts of representation
New Zealand’s migration channels and ethnic makeup have changed radically from the Pacific migrations of the 1960s to the Asian migration of the 1990s. The 2018 census data (Stats NZ 2019a) shows that nationally 27% of people counted were not born in New Zealand, up from 25% in 2013. Just 70% identified with at least one European ethnicity, down from 74% in 2013. The next largest group identified as Māori (16.5% up from 15% in 2013). Asian people comprised 15% (up from 12% in 2013), followed by people identifying with at least one Pacific group (8% up from 7.4%). Māori, Pacific and Asian people are forecast to comprise more than half the population by 2038 (Stats NZ 2019b). Auckland’s population is forecast to become “younger and browner” (Chen 2015), with 23% of all Māori and 65% of Pacific people living in the city (Statistics New Zealand 2013; Chen 2015).
Such diversity justifies examination of Auckland’s local political representation, which was long dominated in the pre-reform years by “the archetypal councillor [who] was middle-aged, middle class and male, with the dominant idea being that women’s natural province was the domestic sphere, ‘while men alone were suited to the hurly-burly of politics and public life’” (Drage and Tremaine 2011, p. 184).
Discussing ethnic representation in Auckland, Nakhid (2016) considered both substantive and descriptive representation (Pitkin 1967) to be important concepts linking political representation to empowerment. Substantive representation focuses on issues, ideas and activities championed by representatives, rather than their personal characteristics. Thus according to Pitkin (cited in Celis 2009, p. 97), substantive representation means “acting in the interest of the represented, in a manner that is responsive to them”. Saward (2008, p. 96) emphasised the core idea that substantive representation is to act for and not merely stand for the group. Descriptive representation, which is seen as more empowering of marginalised groups, is concerned with who does the representing, as “the making present of something absent by resemblance or reflection…” (Pitkin 1967, p. 11). It reflects the broad “consensus … in international society and within democratic polities that one social segment should not monopolise political power” (Htun 2004, p. 439).
However, the two are intricately linked. It is generally agreed, for example, that good substantive representation (Webster and Fa’apoi 2018) implies recognising diversity, in contrast with historical ideas of representation as more paternalistic. The United Nations General Assembly (1979) agreed that “good substantive representation implies recognising diversity and ideological conflict regarding women’s interests and gendered perspectives”. This perspective has led to candidate quotas for women and reserved seats for ethnic minorities in many jurisdictions, as well as wider adoption of proportional representation in electoral systems.
Chen (2017) argued that taking account of ‘superdiversity’ (the unusually high mix of ethnic groups in certain cities and countries) requires an intersectional approach to avoid discrimination, taking into account not just race but gender, sexuality, disability and age. According to Chen “there can be no ‘business as usual’ when the nature of New Zealand society is changing rapidly. It is clear that superdiversity, and its benefits and challenges, are here to stay” (Chen 2017, p. xxiv). This concept builds on the understanding that “diversity is more than just one group providing representation for its specific interests; it is about changing a non-diverse environment to allow for other groups to make similar demands” (Minta 2012, p. 544). Significantly, Choi and Hong (2021) found in their Californian study that descriptive representation of minority groups appears to translate into policy and service improvements – ie into substantive representation. Findings such as these support the aspirations expressed by local governments such as the new Auckland Council for their super-diverse ethnic populations to participate fully and to “see themselves reflected in civic and community life, in positions of leadership,[in] decision-making and in public spaces” (Auckland Council 2018).
The barriers faced by women and other minority groups are often perpetuated by non-proportional electoral systems. Stevens (2007, p. 65) observed that “with rather few exceptions, women are disproportionately underrepresented in institutions of representative democracy”. Barriers to women’s participation include: their reluctance to stand when selection networks controlled by political parties are influenced by sexism and discrimination (Rao 2000; Rallings et al. 2010); family demands; and gendered assumptions regarding women’s suitability for representative roles. Similarly, Tremaine (2000, p. 249) and Conroy (2011, p. 172) found the ‘old boys’ network’ to be a significant obstacle faced by women in local government in New Zealand and Australia. In Wales, Farrell and Titcombe (2016, p. 872) identified “macho presenteeism”, the tendency to work long hours and attend meetings at any time, as a barrier to women’s willingness to stand for office.
Sector reforms, such as newly organised districts and legislation requiring greater accountability and long-term planning, “may have damaged the all-pervading nature of the ‘old boys’ network’ and male cronyism. Nevertheless, the old boys’ network has shown an amazing ability to survive” (Tremaine, 2000, p. 249). Sexism and discrimination emerged through the allocation of women to committees dealing stereotypically with ‘feminine’ concerns, such as education, social services and welfare (Henig and Henig 2001). Recent research in Auckland suggests “the influence of gender backlash politics and confirms the need to think about the performance of elected women as more than ‘articulated’ representation” (McGregor and Webster 2017, p. 1). Women saw themselves as speaking not just for women, but for communities (Curtin 2008).
Reconciliation of family duties with work and political activity has traditionally presented a significant challenge for women representatives (Henig and Henig 2001; Pini and McDonald 2011; Conroy 2011). Women have a longer history of representation at the local than the national level, having had the right to stand in local elections in New Zealand since 1893, when the first woman was elected mayor of a local borough council the day after women first cast their votes in a national general election. Notwithstanding this, the claim that local government was family-friendly because proximity between home and workplace enabled women councillors to continue to fulfil their domestic responsibilities is highly contested (Drage and Tremaine 2011; Conroy 2011; Pini and McDonald 2011).
Inherent in contemporary discussions on representation are strong arguments premised on social justice. These span “traditional leftist goals of egalitarian redistribution, and … recognition of minority cultural and ethnic groups” (Smits 2011, p. 87). Redistribution of resources was posited to redress socio-economic injustice, because recognition affirmed a group’s value. Humpage and Fleras (2001) drew on the distributive model of social justice3 to argue that New Zealand as a whole will benefit if the growing population of Māori and Pacific peoples are freed from economic and social disadvantage. They present three rationales that correspond to the three articles of Te Tiriti o Waitangi: Article 1, whereby Māori chiefs have ceded government over the lands only in an administrative capacity; Article 2, whereby unqualified exercise of Māori chieftainship is guaranteed and chiefs were promised their physical possessions, natural resources and all they held precious – which promotes social cohesion; and Article 3, which gave Māori the same rights and duties of citizenship as the people of England, and corresponds with social justice. Multiple interpretations of Te Tiriti o Waitangi (Te Puni Kōkiri 2001; Waitangi Tribunal 2005; Hayward 2011; Webster and Cheyne 2017; Bargh 2021) support the entitlement of Māori to fair and effective representation in local government.
Auckland and its population
Auckland’s status as a ‘super-diverse’ city provides a broader dimension through which to take an intersectional approach to local representation (Vertovec 2007; Chen 2015, 2017; Spoonley 2015; Webster and Fa’apoi 2018). While this study is concerned specifically with diversity in terms of gender and ethnicity, the wider implications of super-diversity, including experiences of political systems, community and migration, have important policy implications for civic participation, engagement and democracy and deserve examination in future research.
In 2013, the resident population of Auckland was 1.4 million, 33% of New Zealand’s total population of 4.2 million (Statistics New Zealand 2013). By 2018, the national population had grown 10.8% to 4.7 million, and Auckland’s to 1.6 million, 34% of the total. Nationally, females have outnumbered males in the general population since the 1971 Census. By 2018 there were 2.25 million females to 2.17 million males (a difference of 80,000), with more women in every age group over 30 years but more men amongst people under 30 years (Stats NZ 2018c).
Generally, Auckland’s demographic composition is younger and more ethnically diverse than the rest of New Zealand. In 2013 there were 40,563 more females than males (Auckland Council Social and Economic Research Team 2014). However, by 2018 this difference had reduced to 17,763 (Stats NZ 2019a) as the population aged.
Table 1 shows the ethnic spread in the Auckland population over the period relating to this research. Residents of European ethnicity are still the largest group in Auckland. Data shows a modest decline of 3% over the last three census periods. While the Māori proportion of Auckland’s population has been relatively steady, there has been a marked increase in the proportion of Pacific and Asian residents, and to a lesser extent people of Middle Eastern/Latin American/African (MELAA) origins. This is in line with the trends discussed earlier.
Source: NZ Stats 2020
Note: As individuals could identify as more than one ethnicity, percentages add to more than 100.
*Until 2009 people identifying as ‘New Zealand European (NZE)’ were included in ‘Other’. They are now termed simply ‘European’.
Areas of diverse ethnic concentrations have been evident across Auckland for some decades. Of specific note, since 2013, are the Manukau and Manurewa-Papakura wards, with high proportions of Māori (21%), Pacific (40%), and Asian (21%) people. Large numbers of Asian people are also evident in the Whau (32%), Howick (36%), Albert-Eden (26%), Kaipātiki (24%), Maungakiekie-Tāmaki (21%), Henderson-Massey (19%) and Devonport-Takapuna local board areas (19%).
Research design
The research was undertaken as a mixed method cohort study (Levin 2006; Dulin 2008) drawing on Auckland Council published candidate lists for the 2013, 2016 and 2019 elections. Our cohort was dynamic (Levin 2006) as new candidates entered the study with each election while some did not stand again or were not elected. Quantitative analysis utilised SPSS and Microsoft Excel software.
Cohorts’ gender and self-identified ethnicity was determined by drawing on publicly available information (candidate booklets, archives and websites), each of which was cross-checked across multiple sources. Though a small margin of error is possible, this is not considered significant in terms the wider findings of the study.
New Zealand Census data categories were used for consistency: New Zealand European (NZE, before 2009) or European (after 2009), Māori, Pacific, MELAA and ‘Other’. Due to their low prevalence, MELAA and ‘Other’ categories were combined. While some candidates identified with more than one ethnicity, analysis focused on the identity that was most expressed in their community and governance activities.4 The gender and ethnicity of candidates and elected members was compared against the 2013 and 2018 census data to ascertain the degree of descriptive representation (Pitkin 1967) delivered by the respective elections, and whether local government representation was responding to Auckland’s changing demographics. There are striking differences between the characteristics of candidates and elected members and those of the population at large.
The total cohort for this research comprised 1,362 candidates who stood across three election cycles for the Auckland mayoralty, the 20 governing body (council) seats, and 149 local board seats. Table 2 shows that the number of candidates standing was slightly higher in 2013 and 2016 at 453 and 468 respectively, the first two elections following the Auckland local government amalgamation, before falling to 424 in 2019. Between 2% to 3.5% of seats were uncontested.
| Category | 2013 | 2016 | 2019 |
|---|---|---|---|
| Total nominations | 453 | 468 | 424 |
| Elected unopposed | 6 | 4 | 4 |
| Men candidates | 290 | 282 | 247 |
| Women candidates | 163 | 186 | 176 |
| Total candidates | 453 | 468 | 423 |
| Total elected member seats | 170 | 170 | 170 |
Findings
Auckland governance and gender
Table 3 and Figure 3 detail numbers of candidates at each election for the mayor/governing body positions and the local boards, with the respective shares of men and women. In 2013, 453 candidates including 290 men and 163 women stood for election, a ratio of 64:36 against a population ratio of 49:51 (Stats NZ 2018a). In 2016, the number of candidates was slightly higher at 468: 282 men and 186 women, a ratio of 60:40. In 2019, there were 423 candidates: 247 men and 176 women, a ratio of 58:42. The number of men standing over the three election cycles is down by 43 (15%), while the number of women has fluctuated but is up by 13 (8%) overall. This may indicate an increased willingness by women to put themselves forward for local office, particularly at local board level. These new structures may be helping to overcome the geographic barriers to women’s participation found in earlier years by Drage and Tremaine (2011) and Conroy (2011). The governing body has seen a similar increase in the proportion of women candidates, but only to 35%. This suggests a continuing reluctance amongst women to stand for senior leadership positions and the challenges they continue to face post amalgamation in overcoming the barriers of greater distance from home and dedicating very large amounts of time to community service.
| All positions | Governing body | Local board | ||||||
|---|---|---|---|---|---|---|---|---|
| Number | % Men | % Women | % Men | % Women | % Men | % Women | ||
| 2013 | Candidates | 453 | 64 | 36 | 71 | 29 | 63 | 37 |
| Elected | 170 | 58 | 42 | 65 | 35 | 58 | 42 | |
| 2016 | Candidates | 468 | 60 | 40 | 70 | 30 | 49 | 51 |
| Elected | 170 | 53 | 47 | 65 | 35 | 49 | 51 | |
| 2019 | Candidates | 423 | 58 | 42 | 65 | 35 | 57 | 43 |
| Elected | 170 | 49 | 51 | 55 | 45 | 48 | 52 | |
On the other hand, Figure 3 highlights women’s success in being elected. At both the local board and governing body levels, women make up a greater proportion of those elected than of candidates. In 2019, women again won more than half the local board seats (52% compared to 51% in 2016 and 42% in 2013), despite being only 43% of candidates. And at the governing body level women won 45% of seats even though they were only 35% of candidates.
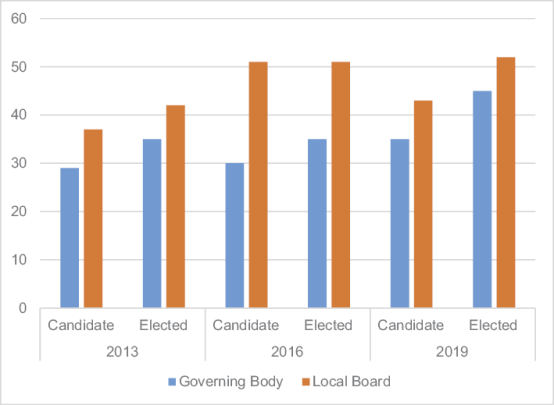
Figure 3. Women’s electoral success by governing body and local boards (percentage of total)
A detailed look at individual local boards further emphasises women’s electoral success (see Table 4). By 2019, women made up 50% or more of the elected members in 14 local boards, compared with 11 in 2016 and just six in 2013. Further, in 2013, 2016 and 2019 respectively, women candidates were more successful than men at being elected in 11, ten and 19 of the 21 local boards respectively – ie they were elected in greater proportions than they were candidates. The number of boards dominated by men has halved, from 14 to seven.
| 2013 | 2016 | 2019 | |||||
|---|---|---|---|---|---|---|---|
| Local board | Number elected | Candidates % | Elected % | Candidates % | Elected % | Candidates % | Elected % |
| Albert-Eden | 8 | 54 | 62 | 50 | 63 | 72 | 75 |
| Devonport-Takapuna | 8 | 33 | 25 | 28 | 25 | 39 | 50 |
| Franklin | 9 | 24 | 44 | 36 | 33 | 32 | 33 |
| Aotea/Great Barrier | 6 | 70 | 80 | 75 | 60 | 57 | 60 |
| Henderson-Massey | 8 | 43 | 37 | 46 | 38 | 42 | 50 |
| Hibiscus and Bays | 8 | 43 | 37 | 35 | 63 | 44 | 63 |
| Howick | 9 | 28 | 33 | 39 | 34 | 27 | 33 |
| Kaipātiki | 6 | 44 | 57 | 65 | 50 | 47 | 63 |
| Māngere-Ōtāhuhu | 7 | 24 | 44 | 42 | 57 | 36 | 43 |
| Manurewa | 8 | 42 | 37 | 43 | 63 | 46 | 38 |
| Maungakiekie-Tāmaki | 7 | 45 | 29 | 53 | 43 | 56 | 43 |
| Ōrākei | 7 | 36 | 29 | 50 | 43 | 27 | 29 |
| Ōtara-Papatoetoe | 7 | 40 | 43 | 30 | 57 | 55 | 57 |
| Papakura | 6 | 40 | 17 | 31 | 50 | 44 | 50 |
| Puketāpapa | 6 | 13 | 33 | 31 | 50 | 42 | 50 |
| Rodney | 9 | 23 | 22 | 37 | 56 | 39 | 44 |
| Upper Harbour | 6 | 44 | 50 | 40 | 50 | 36 | 67 |
| Waiheke | 5 | 50 | 60 | 67 | 25 | 44 | 60 |
| Waitākere Ranges | 6 | 44 | 50 | 56 | 50 | 47 | 50 |
| Waitematā | 7 | 30 | 29 | 33 | 43 | 55 | 71 |
| Whau | 7 | 38 | 43 | 35 | 57 | 40 | 71 |
This success is reinforced by women holding a substantial proportion of the leadership positions on local boards. More than half of 21 chairs in 2013 and 2016 (12 and 11 respectively) were held by women; and around half (ten and 11) of 21 deputy chair offices. In 2019, 11 of the 21 local boards opted for chairs and deputy chairs to serve split terms. Term 1 saw eight women holding the chair and 14 deputies. In term 2, 11 women held the chair, and 13 were deputies. For the purposes of comparison with 2013 and 2016, this can be averaged to give 9.5 women chairs and 13.5 women deputies out of a possible 21.
Auckland governance and ethnicity
Since 2013 Auckland Council candidates and elected representatives have become increasingly ethnically diverse. Figure 4 shows the progressive decrease in European dominance of candidates and elected members, overall, across Auckland local government. It is evident from the data that the number of Māori, Pacific and Asian candidates increased over the three elections in question and these candidates were increasingly successful at being elected. While European candidates and elected members still dominated in 2019, their numbers had declined proportionally from 84% and 88%, respectively, in 2013 to 67% and 76% in 2019.
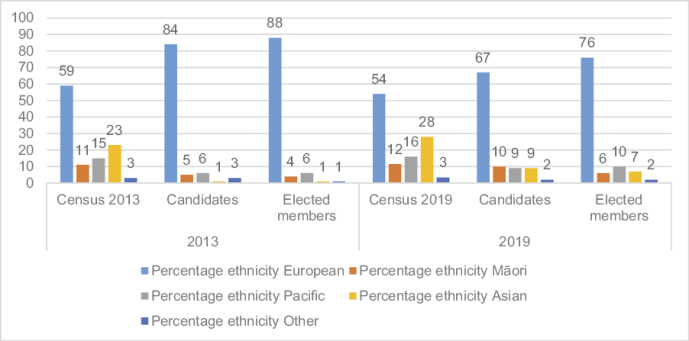
Figure 4. Candidate and elected member ethnicity compared to Census data
Also of note in 2019 was a doubling in the percentage of Māori candidates over the three elections, from 5% to 10%, resulting in 6% Māori elected members, compared with 4% in 2013. Historically, Māori have consistently stood and been elected at around half their prevalence in the population, which is 11–12%. While there is a geographic concentration of Māori in the Manukau, Manurewa and Henderson local board areas (Auckland Council n.d.), their wide dispersal across the region makes it more difficult for candidates to be elected in local boards and wards.
By contrast, the percentage of Pacific candidates grew from 6% to 9%, but produced an increase in elected members from 6% to 10%. Pacific people comprise 15–16% of the population, but are clustered in Auckland’s southern wards comprising the Māngere-Ōtāhuhu, Ōtara-Papatoetoe, Manurewa and Papakura local boards. Also, they are well organised in terms of support from church and family networks, with the former being a significant avenue for the city council when reaching out to Pacific people (Auckland Council 2015).
The number of Asian candidates and elected members has significantly increased over the same period, from 1% in 2013 to 9% and 7% respectively in 2016 and 2019. The participation of ‘Other’ candidates has remained stable at 1–3%.
Governance and ethnicity at ward level
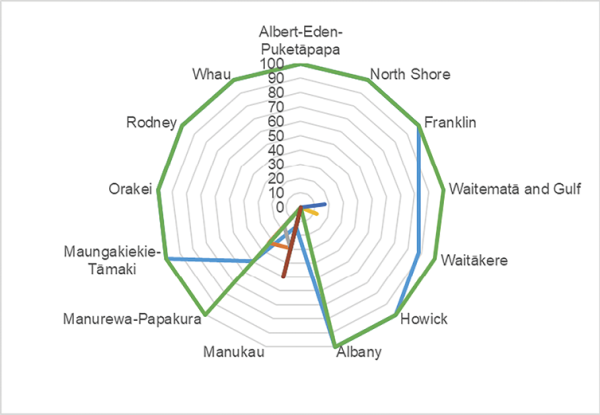
The increased diversity of candidates and elected members is evident across the Auckland Council wards, as well as local boards. For 2013, as shown in Figure 5, the near-complete blue circle on the outer ring of the radial chart represents the total dominance of European candidates in all but four wards. The blue line deviates from the green outer rim only in Manukau, Maungakiekie-Tāmaki, Waitākere and Waitematā and Gulf, reflecting the ethnic diversity of candidates in those wards. Nine of the 13 wards had all European candidates, and 12 elected all European councillors, highlighting the absence of descriptive representation in the city’s governing body at that time.
In 2013, the Manukau and Manurewa-Papakura wards (comprising the Māngere-Ōtāhuhu, Ōtara-Papatoetoe, Manurewa and Papakura local boards) in south Auckland were the only deviation from the trend of predominantly European representatives (see Figure 5). One Asian candidate stood unsuccessfully for the Waitākere ward. The radial diagram highlights the diversity in the Manukau ward, where two candidates each of Māori, Pacific and MELAA/Other ethnicity stood. Manukau, with its significant concentration of both Māori and Pacific people, was the only ward where non-European candidates (two Pacific people) were elected as ward councillors.
In 2016, while European remained the predominant ethnicity among ward candidates (66%) and elected councillors (72%), new pockets of ethnically diverse candidates had emerged across Auckland (Albert-Eden-Puketāpapa and Maungakiekie-Tāmaki wards in central Auckland, and Waitākere in the west). Nevertheless, in five of the 13 wards (Franklin, Waitematā and Gulf, Manurewa-Papakura, Ōrākei and Rodney), all candidates were European, and in ten wards all the elected councillors were European (the previous five wards plus North Shore, Howick, Albany, Rodney and Whau). While the greater diversity in candidates was evident in seven wards, in four of those (Albert-Eden, Whau, Maungakiekie-Tāmaki and Howick) European candidates still prevailed. The Albert-Eden-Puketāpapa and Waitākere wards each elected one European candidate and one of ‘Other’ ethnicity.
One Asian candidate stood for Albert-Eden-Puketāpapa and three for Howick ward, however no Asian candidates were successful at this level. The increase in participation of diverse candidates might be attributed to the 2016 ‘Show your Love for Auckland’ public relations campaign undertaken by the Auckland Council elections team (Delbet and Watson 2017). The aim was to increase voter turnout (to an aspirational 40% of registered voters5), and the campaign was highly inclusive of diverse communities, targeting diverse candidates who were less likely to participate, and providing support for online candidate profiles.
In 2019, Europeans were 81% of candidates, but less successful in being elected, winning 75% of governing body seats (15 of 20). Five of the 14 wards had 100% European candidates, and nine of the 14 returned 100% European elected members. Again, the Pacific and Asian interest in local representation in the Whau ward, and the Māori, Pacific and other interest in the Waitematā and Gulf Ward visible in 2013 were not present in 2019.
The Manukau ward re-established its 2013 Māori/Pacific representation on the governing body in 2019, after reverting to all European candidates and elected members in 2016. Maungakiekie-Tāmaki in central Auckland elected one Pacific member; and Albert-Eden-Puketāpapa, also in central Auckland, elected one MELAA/Other ward member. Howick, in east Auckland, again elected an Asian member. Figure 5 below shows the Howick, Manukau and Maungakiekie-Tāmaki wards as having the highest diversity participation in 2019.
Key
2013
2016
2019
Figure 5. Candidate and elected member ethnicity in Auckland Council wards, 2013 to 2019
While the data shows the emergence of distinct pockets of diverse candidates, it is clear that despite the Auckland Council’s determined public relations campaign ethnic groups continue to struggle to achieve descriptive representation on the city’s governing body in line with their proportion of the population. This is made more difficult by the current FPP voting system.
In 2016, just two Māori stood for ward seats (in Albany and Waitākere wards), down from four in 2013 (two in Manukau and two in Manurewa-Papakura wards). All were unsuccessful. In 2019, two Māori again stood for ward seats (one in Manukau and one in Albany), and one was successful (in Manukau). The low numbers of Māori among both candidates and elected members at the governing body level is of particular concern, as overall descriptive representation of Māori languishes at half their proportion of the Auckland population. While the Independent Māori Statutory Board might be considered a proxy for elected members of the governing body, the board has limited membership on council committees and is hardly a substitute for representation by councillors.
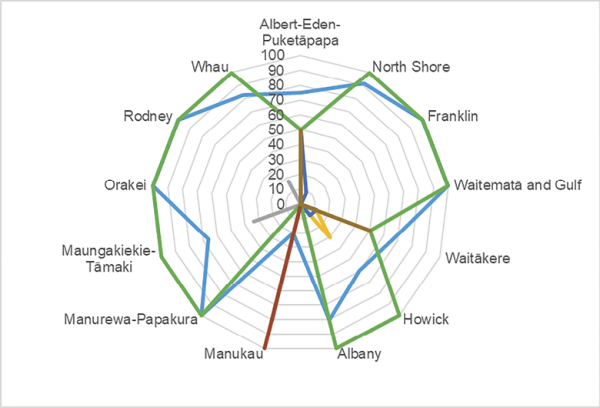
Governance and ethnicity at local board level
At the local board level, the data show considerable diversity of candidates and elected members. Figure 6 provides data from the three elections. The many deviations from the outer rim of the radial graph demonstrate the greater diversity in candidates and elected members at this level compared to ward level. By 2019, just six of the 21 local boards had 100% European elected members, compared with seven in 2016 and 12 in 2013.
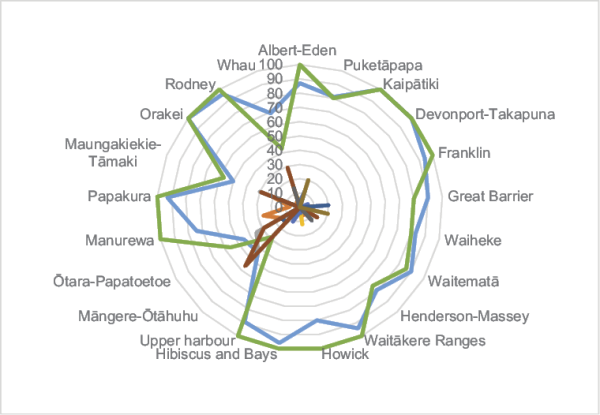
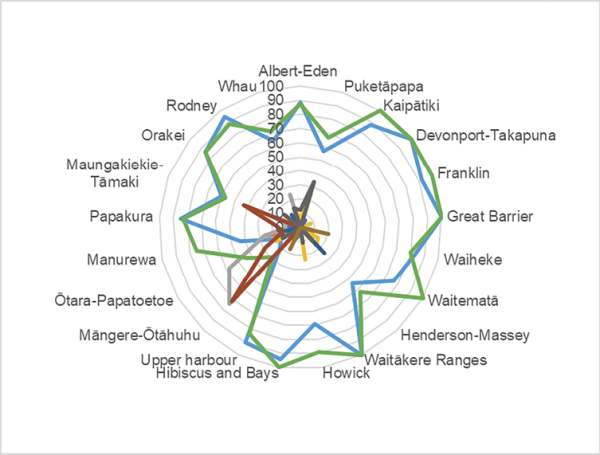
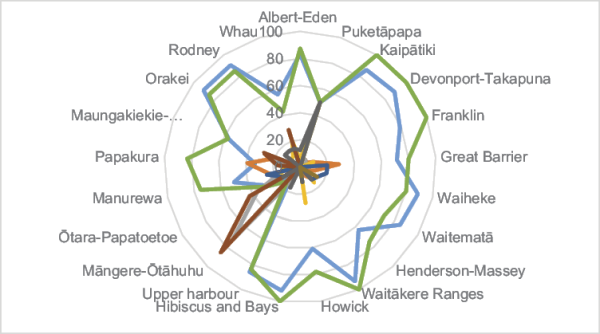
Figure 6. Candidate and elected member ethnicity at the local board level in Auckland, 2013 to 2019
Notably, in 2019 the number of Asian candidates totalled 34, ten of whom were elected. This compares with 30 and seven in 2016 and 17 and two in 2013, respectively. In 2019 Asian candidates stood across 11 local boards and were elected in seven: Albert-Eden, Puketāpapa and Whau local boards in central Auckland; Howick in east Auckland; Henderson-Massey in the west; Upper Harbour on the North Shore; and Ōtara-Papatoetoe in the south. A record three Asian members were elected to the Puketāpapa board, half the total of six.
This builds on the Asian participation in Auckland local elections noted in 2016, when 30 candidates stood across ten local boards and were elected in four (Albert Eden, Henderson-Massey, Howick and Whau); and in 2013, when 17 candidates stood across four local boards and two were elected (Henderson-Massey and Whau local boards).
In 2019, a total of 36 Māori stood across 18 Auckland local boards and eight were elected: in Great Barrier Island, Henderson-Massey, Maungakiekie-Tāmaki, Ōrākei, Waitematā and Whau (one member each); and Manurewa (2), This compares with 22 Māori candidates and seven elected in 2013: Great Barrier; Henderson-Massey, Manukau, Māngere-Ōtāhuhu and Ōtara-Papatoetoe one member each; and Maungakiekie-Tāmaki (2). Similarly, 32 Pacific candidates stood across 11 local boards and 14 were elected: Māngere-Ōtāhuhu (6); Maungakiekie-Tāmaki (2); Ōtara-Papatoetoe (2); Papakura (2); and Whau (2).
By contrast, in 2019 there were just five ‘Other’ candidates, down from nine in 2016 and 13 in 2013; and, across the three elections, respectively only two, four and three ‘Other’ candidates were successful. This progressive reduction in the participation of ‘Other’ candidates again seems to reflect the success of NZE candidates under the FPP electoral system: unsuccessful candidates are discouraged from standing again because the dominant population groups are seen to be more successful. As noted earlier, increased Pacific representation appears to be the result of organised support amongst the large Pacific community within Manukau ward in Auckland’s south, where Pacific and Māori people comprise more than 42% of the population (Stats NZ 2018b).
Overall these results emphasise that, under FPP, where ethnic minorities live in geographic concentrations aligned with voting areas they can be successful in achieving a level of descriptive representation. However, for Māori and other ethnicities that are dispersed across the region, achieving descriptive representation continues to prove challenging.
Discussion
In asking ‘Who stood and who was elected?’ in Auckland since the 2010 local government amalgamation, this research reveals incremental increases in the descriptive representation of Aucklanders at both local board and regional governing body levels over the three election cycles to 2019. While the percentage of women elected to the governing body remains below their share of the population, women won more than half the local board seats in 2016 and 2019, and around half the local board leadership roles in each of the three election cycles.
Viewed alongside the national statistics which show that the proportion of women elected to local government across New Zealand has remained static at around 30% for the past 25 years – moving only a few percentage points up or down over the eight election cycles to 2019 (Department of Internal Affairs 2019) – the increase in women’s descriptive representation achieved in Auckland appears to be a significant gain.
In Auckland, the increasing representation of women in the 2016 and 2019 elections demonstrates their potential for electoral success and suggests that the 2010 reforms have removed some of the barriers for women to stand for and achieve office. In 2019 women’s representation overall in Auckland reached 42%, which is well over the 35% threshold postulated as being necessary to have real influence around the governance table (Kanter 1977). This indicates a greater likelihood of achieving effective, substantive representation of women and families in local policy and governance; however, it has yet to be established whether this elevated level of descriptive representation is sufficient to overcome fully the cultural barriers inherent within the local government system, as highlighted by feminist authors (Tremaine 2000; Henig and Henig 2001; Pini and McDonald 2004; Conroy 2011). Those issues were beyond the scope of this research.
At the regional level, women’s representation surpassed this tipping point for the first time in 2019. The lesser interest shown by women candidates at the ward level is attributed to the challenges posed by amalgamation: larger constituency areas, being less family-friendly and the costs of mounting a campaign for election to the governing body (Henig and Henig, 2001; Stevens 2007; Pini and McDonald 2011; Conroy 2011).
The 2016 Auckland Council ‘Show Your Love for Auckland’ public relations campaign, which was highly inclusive and supportive of diverse candidates, appears to have lifted the electoral participation and success of minority ethnic groups (Auckland Council 2016; Delbet and Watson 2017). The numbers of Pacific and Asian candidates almost doubled in that election, and voter turnout lifted four percentage points to 38.5%. In 2019, interest in participation by minority groups was sustained, with the proportion of European candidates and elected members decreasing over the three cycles from 84% and 88% in 2013, to 67% and 76% respectively. While these proportions of European candidates are still far above the European proportion of the Auckland population, which is just over half (Stats NZ 2018a), the emerging picture is encouraging for achieving a level of descriptive representation that reflects the diversity of cultures making up Auckland.
This change reflects emerging pockets of diverse candidates at both the ward and local board levels, consistent with population projections predicting that by 2038 NZE will comprise just 48% of the Auckland population; with other groups projected to be Asian 35%, Pacific 17% and Māori 12% (Stats NZ 2022). A notable exception to European dominance first in 2013, and sustained in 2016 and 2019, is Manukau ward, which includes the Mangere-Otahuhu and Ōtara-Papatoetoe local boards. In this area, three-quarters of elected members were of Pacific ethnicity and descriptive representation appeared to be achieved. Overall, however, the pace of change is slow. It is concerning that while 11% of Auckland’s population identified as Māori and they comprised 10% of candidates in 2019, they achieved just 6% of elected member seats, only a small increase on previous elections.
Māori have vigorously asserted the difficulties they face in getting elected to local government under the FPP electoral system, even when they put their best candidates forward (Webster 2011; Webster and Cheyne 2017; Webster and Fa’apoi 2018). Notwithstanding the efforts of the Independent Māori Statutory Board to promote Māori ancestral and contemporary concerns, the challenge faced by Māori in achieving voice at the local governance table via the electoral process has yet to be overcome.
The authors reiterate that while proportional representation in national elections has improved Māori representation, the prevalence of FPP across local government limits the representation of Māori and minority groups that do not achieve critical mass within a particular electoral boundary. The situation is unlikely to change if the Auckland Council continues to choose FPP (over STV) as the local electoral system.
Overall, the representation gap for women and minorities evidenced in the 2013 results has been reduced in the two successive elections. On the one hand, the integration of Auckland’s eight former local authorities and other entities into a unitary council with numerous local boards has in some ways proved positive. But on the other, achieving effective representation, and by association meaningful local democracy, has been made more difficult by the barriers posed by larger geographic areas and fewer elected members for a growing and increasingly super-diverse population. In Auckland, the ratios of elected representatives to population persist at around twice the New Zealand average, more than three times that of the United Kingdom, and almost four times those of South Australia and Wales (Shirley et al. 2016).
Conclusions
The findings of this research evidence some significant improvements in descriptive representation across Auckland’s wards and local boards. It is likely that these changes, at least at the local board level, are attributable to the 2010 Auckland reforms. While the democratic deficit in terms of excessively high voter to elected member ratios remains, the trend shows promise in that many more voters will see themselves reflected around the council and local board tables.
As women have exceeded the critical mass required to influence governance (Kanter 1977), we are optimistic that at the local board level this elevated level of descriptive representation will prove sufficient to overcome the cultural barriers inherent within the local government system that have been highlighted in the literature. However, the lower level of interest by women at the ward level emphasises that the larger constituency areas created by the reforms and the costs of mounting a regional campaign may continue to limit women’s representation on the Auckland Council governing body.
With respect to ethnicity, the observation of Cheyne and Comrie (2005) that New Zealand councils were becoming increasingly unrepresentative of communities impacted by immigration and other demographic and socioeconomic changes, largely continues to hold true in Auckland. It underlines that the institutions of representative democracy are failing to deliver on the aspiration of fair and effective representation for all citizens. Changing demographics, coupled with continued low representation of diverse communities and the persistence of Auckland Council in retaining FPP, support the case to mandate STV across local government. As Godfery (2016) observed, the positive outcomes that proportional representation have achieved for Māori at the national level provide a compelling reason for the government to legislate a proportional electoral system, such as STV, in order to remove the barrier to fair and effective representation under the Local Electoral Act and thus legitimise Auckland’s system of local governance. This could not only provide a fairer way for voter preference to be reflected, but also potentially encourage more people to vote with the knowledge that their vote will count, whether they support a candidate from the majority or a minority ethnic group.
Postscript
This article was completed shortly before the 2022 local government elections. A number of developments were evident in Auckland and nationally. The Auckland mayoral competition started with 22 candidates, two of whom withdrew; leaving the frontrunners as Auckland’s first Pacific mayoral candidate, the left-leaning two-term Manukau ward councillor Efeso Collins, and right-leaning engineer and business advocate Wayne Brown. On the national stage, 15 of the local authorities which had reviewed their representation arrangements (as required at least every six years under the Local Electoral Act 2001) had chosen or confirmed STV as their electoral system, the largest number since STV was first used in local government in 2004 (Department of Internal Affairs 2021b). Further changes to the Electoral Act (Department of Internal Affairs 2021a) made it easier for local authorities to establish Māori wards, and 35 had done this in time for the 2022 elections (Department of Internal Affairs 2021a; Taitaurā Local Government Professionals Aotearoa 2022). However, the Auckland Council did not review its representation arrangements for the 2022 election and therefore retained FPP. Due to the legislative status of the Independent Māori Statutory Board, changes would be required to the Local Government (Auckland Council) Act 2009 to pave the way for Māori wards in Auckland. Whether the intent of the electoral changes to deliver ‘fair and effective representation for all New Zealanders’ will provide the impetus for Auckland Council to embrace STV and to advocate Māori wards in time for the 2025 election remains to be seen.
Declaration of conflicting interest
The author declared no potential conflicts of interest with respect to the research, authorship, and/or publication of this article.
Funding
The author received no financial support for the research, authorship, and/or publication of this article.
References
Asquith, A., McNeill, J. and Stockley, E. (2021) Amalgamation and Auckland City: a success story. Australian Journal of Political Administration, 80, 977–986. https://doi.org/10.1111/1467-8500.12457
Auckland Council. (n.d.) Te Pūrongo a Te Kaunihera o Tāmaki Makaurau Ngā Huanga Māori 2019-2020: Auckland Council Group Māori outcomes report 2019–2020. Auckland: Auckland Council.
Auckland Council Social And Economic Research Team. (2014) Auckland’s profile: initial results of the 2013 Census. Auckland: Auckland Council.
Auckland Council. (2015) Exploring Pacific economies: wealth practices and debt management. Auckland: Auckland Council.
Auckland Council. (2016) Auckland Council candidate survey. Auckland: Auckland Council.
Auckland Council. (2018) The Auckland Plan 2050. Auckland: Auckland Council.
Auckland Council. (2022) About wards and local boards [Online]. Auckland Council. Available at: https://www.aucklandcouncil.govt.nz/elections/how-council-works/Pages/about-wards-local-boards.aspx [Accessed 13 September 2022].
Bargh, M. (2021) Challenges on the path to Treaty-based local government. Kōtuitui: New Zealand Social Sciences Journal, 16, 70–85. https://doi.org/10.1080/1177083X.2020.1754246
Celis, K. (2009) Substantive representation of women (and improving it): what it is and what it should be about. Comparative European Politics, 7, 95–113. https://doi.org/10.1057/cep.2008.35
Chen, M. (2015) Superdiversity stocktake: implications for business, government and New Zealand. Auckland: Chen Palmer Partners.
Chen, M. (2017) The diversity matrix. Auckland: Superdiversity Institute.
Cheyne, C. and Comrie, M. (2005) Empowerment or encumbrance? Exercising the STV option for local authority elections in New Zealand. Local Government Studies, 31 (2), 185–204. https://doi.org/10.1080/03003930500032064
Choi, H. and Hong, S. (2021) Linking political and bureaucratic representation: does minority representation on city councils affect the outcomes of street-level service? Public Administration, 99, 405–421. https://doi.org/10.1111/padm.12696
Conroy, D. (2011) Gendering local government amalgamations. In: Pini, B. and McDonald, P. (eds.) Women and representation in local government: international case studies, (pp. 161–178). Abingdon, Axon: Routledge.
Curtin, J. (2008) Women, political leadership and substantive representation: the case of New Zealand. Parliamentary Affairs, 61 (3), 490–504. https://doi.org/10.1093/pa/gsn014
Delbet, M. and Watson, K. (2017) Capturing hearts: Auckland Council 2016 election campaign. Post Election Research Symposium. Massey University Wellington Campus.
Department of Internal Affairs. (n.d.) Election statistics [Online]. Wellington: New Zealand Government. Available: https://www.localcouncils.govt.nz/lgip.nsf/wpg_URL/Profiles-Councils-Auckland-Council-E1 [Accessed 6 December 2022].
Department of Internal Affairs. (2013) Local authority election statistics 2013 [Online]. Wellington, New Zealand. Available at: https://www.dia.govt.nz/diawebsite.nsf/wpg_URL/Services-Local-Elections-Local-Authority-Election-Statistics-2013?OpenDocument [Accessed 23 April 2015].
Department of Internal Affairs. (2019) Voting and becoming a councillor [Online]. Wellington: New Zealand Government. Available at: http://www.localcouncils.govt.nz/lgip.nsf/wpg_url/About-Local-Government-Participate-In-Local-Government-Voting-and-Becoming-a-Councillor#ElectionSystems [Accessed 1 August 2019].
Department of Internal Affairs. (2021a) The processes for considering Māori wards are changing. [Online]. Wellington: New Zealand Government. Available at: https://www.dia.govt.nz/maori-wards [Accessed 23 September 2022].
Department of Internal Affairs. (2021b) STV legislation, background and further information. [Online]. Wellington: Department of Internal Affairs. Available at: https://www.stv.govt.nz/legislation.shtml [Accessed 12 July 2022].
Drage, J. and Tremaine, M. (2011) Women in New Zealand local government. In: Pini, B. and McDonald, P. (eds.) Women and representation in local government: international case studies, (pp. 179–182). Abingdon, Oxon: Routledge.
Dulin, L. (2008) Leadership preferences in generation Y cohort: A mixed methods investigation. Journal of Leadership Studies, 2, 43–59. https://doi.org/10.1002/jls.20045
Farrell, C. and Titcombe, S. (2016) Gender and the experiences of local elected members – a focus on Wales. Local Government Studies, 42 (6), 867–884. https://doi.org/10.1080/03003930.2016.1207629
Godfery, M. (2016) Māori in local government. In: Drage, J. and Cheyne, C. (eds.) Local government in New Zealand: challenges and choices, (pp. 66–78). Auckland: Dunmore Publishing.
Hayward, J. (2011) In search of certainty: local government policy and the Treaty of Waitangi. In: Tawhai, V.M.H. and Gray-Sharp, K. (eds.) Always speaking, (pp.79–94). Wellington: Huia Publishers.
Hayward, J. (2016a) Implementing ‘fair and effective representation’: a review of the local electoral option. New Zealand Universities Law Review, 27, 388–401.
Hayward, J. (2016b) Local government and proportional representation. In: Drage, J. and Cheyne, C. (eds.) Local government in New Zealand: challenges and choices, (pp. 130–139). Auckland: Dunmore Publishing Ltd.
Henig, R. and Henig, S. (2001) Women and political power: Europe since 1945. London, Routledge. https://doi.org/10.4324/9780203134269
Htun, M. (2004) Is gender like ethnicity? The political representation of identity groups. Perspectives on Politics, 2 (3), 439–458. https://doi.org/10.1017/S1537592704040241
Humpage, L. and Fleras, A. (2001) Intersecting discourses: closing the gaps, social justice and the Treaty of Waitangi. Social Policy Journal of New Zealand, 16.
Independent Māori Statutory Board. (n.d.) About us. [Online]. Auckland: Independent Māori Statutory Board. Available at: https://www.imsb.maori.nz/about-us/introduction/ [Accessed 23 March 2017].
Kanter, R.M. (1977) Men and women of the corporation. New York, Basic Books.
Levin, K.A. (2006) Study design IV. Cohort studies. Evidence-Based Dentistry, 7 (2), 51–52. https://doi.org/10.1038/sj.ebd.6400407
Lindsay, S. (2016) Māori statutory board pulls out of Unitary Plan decision-making. National Business Review, 10 August 2016.
Local Government New Zealand. (2019) New Zealand’s elected members: a profile. Wellington: Local Government New Zealand.
McGregor, J., Bell, S. and Wilson, M. (2015) Emerging fault lines: human rights in New Zealand. Wellington: Law Foundation Te Manatū a Ture o Aotearoa. https://doi.org/10.7810/9780947492748_1
McGregor, J. and Webster, K. (2017) Women’s local government representation in Auckland – does size matter? Commonwealth Journal of Local Governance, (20). https://doi.org/10.5130/cjlg.v0i20.6023
Minta, M.D. (2012) Gender, race, ethnicity and political representation in the United States. Politics & Gender, 8 (4), 541–547. https://doi.org/10.1017/S1743923X12000578
Nakhid, C. (2016) Ethnic communities’ perspectives of an ethnic advisory panel in local government – a case study of Auckland. Representation, 52 (1), 81–98. https://doi.org/10.1080/00344893.2016.1241819
New Zealand Government. (2001) Local Electoral Act 2001. Wellington, New Zealand: New Zealand Government.
New Zealand Government. (2002) Local Government Act 2002. Wellington, New Zealand: New Zealand Government.
Palmer, G. and Palmer, M. (2004) Bridled power: New Zealand constitution and government. Auckland: Oxford University Press.
Pini, B. and McDonald, P. (2004) A good job for a women: the myth of local government as family friendly. Local Governance, 30 (3), 144–151.
Pini, B. and McDonald, P. (eds.) (2011) Women and representation in local government: international case studies. Abingdon, Oxon: Routledge.
Pitkin, H. (1967) The concept of representation. Berkeley: University of California Press.
Rallings, C., Thrasher, M., Borisyuk, G. and Shears, M. (2010) Parties recruitment and modernisation: evidence from local election candidates. Local Government Studies, 36 (3), 361–379. https://doi.org/10.1080/03003931003738157
Rao, N. (2000) Representation and community in western democracies. London: Macmillan. https://doi.org/10.1057/9780230288065
Salmon, P., Bazley, M. and Shand, D. (2009) Report of the Royal Commission on Auckland Governance. Auckland: Royal Commission on Auckland Governance.
Saward, M. (2008) The subject of representation. Representation, 44 (2), 93–97. https://doi.org/10.1080/00344890802079433
Shirley, I., Molineaux, J., Shand, D., Jackson, N., Duncan, G. and Lewis, N. (2016) The governance of Auckland five years on. Auckland, New Zealand: AUT Policy Observatory.
Smits, K. (2011) Justifying multiculturalism: social justice, diversity and national identity in Australia and New Zealand. Australian Journal of Political Science, 46 (1), 87–103. https://doi.org/10.1080/10361146.2011.546051
Spoonley, P. (2015) New diversity, old anxieties in New Zealand: the complex identity politics and engagement of a settler society. Ethnic and Racial Studies, 38 (4), 650–661. https://doi.org/10.1080/01419870.2015.980292
Statistics New Zealand. (2013) Census 2013 [Online]. Wellington: Statistics New Zealand. Available at: http://nzdotstat.stats.govt.nz/wbos/Index.aspx [Accessed 7 August 2015]
Stats NZ Tatauranga Aotearoa. (2018a) 2018 Census place summaries [Online]. Wellington: New Zealand Government. Available at: https://www.stats.govt.nz/tools/2018-census-place-summaries/ [Accessed 7 September 23022].
Stats NZ Tatauranga Aotearoa. (2018b) Manukau central [Online]. Wellington: New Zealand Government. Available at: https://www.stats.govt.nz/tools/2018-census-place-summaries/manukau-central#ethnicity-culture-and-identity [Accessed 21 September 2022].
Stats NZ Tatauranga Aotearoa. (2018c) More women are over 30, and more men are under 30. Wellington: New Zealand Government..
Stats NZ Tatauranga Aotearoa. (2019a) Auckland region [Online]. Wellington: New Zealand Government. Available at: https://www.stats.govt.nz/tools/2018-census-place-summaries/auckland-region [Accessed 27 January 2021].
Stats NZ Tatauranga Aotearoa. (2019b) New Zealand’s population reflects growing diversity [Online]. Wellington: New Zealand Government. Available at: https://www.stats.govt.nz/news/new-zealands-population-reflects-growing-diversity [Accessed 17 December 2020].
Stats NZ Tatauranga Aotearoa. (2020) Auckland region [Online]. Wellington: New Zealand Government. Available at: https://www.stats.govt.nz/tools/2018-census-place-summaries/auckland-region#population-and-dwellings [Accessed 18 December 2020].
Stats NZ Tatauranga Aotearoa. (2022) National ethnic population projections: 2018 (base)–2043 (update) [Online]. Wellington: New Zealand Government. Available at: https://www.stats.govt.nz/information-releases/national-ethnic-population-projections-2018base2043-update/ [Accessed 18 October 2022].
Stevens, A. (2007) Women, power and politics. Basingstoke, Hampshire: Palgrave Macmillan. https://doi.org/10.1007/978-1-137-10463-2
Taitaurā Local Government Professionals Aotearoa. (2022) About Māori wards and constituencies [Online]. Wellington: Taitaurā Local Government Professionals Aotearoa. Available at: https://www.votelocal.co.nz/maori-wards-and-constituencies/ [Accessed 23 September 2022].
Te Puni Kōkiri. (2001) He tirotanga ō kawa ki te Tiriti o Waitangi: A guide to the principles of the Treaty of Waitangi as expressed by the Courts and the Waitangi Tribunal. Wellington, New Zealand: New Zealand Government.
Tremaine, M. (2000) Women mayors say what it takes to lead: setting theory against lived experience. Women in Management Review, 15 (5/6), 246–252. https://doi.org/10.1108/09649420010372869
United Nations General Assembly. (1979) Convention on the elimination of all forms of discrimination against women [Online]. Available at: http://www.un.org/womenwatch/daw/cedaw/ [Accessed 8 April 2015].
Vertovec, S. (2007) New complexities of cohesion in Britain: super-diversity, transnationalism and civil integration. Commission on Integration and Cohesion.
Waitangi Tribunal. (2005) The new approach revisited: a discussion paper on the Waitangi Tribunal’s current and developing practices. Wellington: Waitangi Tribunal: Te Rōpū Whakamana i te Tiriti o Waitangi.
Webster, K. (2009) Whakapiri tātou, hei manaaki tangata, hei manaaki whenua: effective governance for urban sustainability. Doctorate in Public Policy, Auckland University of Technology.
Webster, K. (2011). Te Ao Maori in local government. In: Drage, J., McNeill, J. and Cheyne, C. (eds.) Along a fault-line: New Zealand’s changing local government landscape, (pp.136–151). Wellington: Dunmore Publishing.
Webster, K. and Cheyne, C. (2017) Creating Treaty-based local governance in New Zealand: Māori and Pākehā views. Kotuitui: New Zealand Journal of Social Sciences, 12 (2), 146–164. https://doi.org/10.1080/1177083X.2017.1345766
Webster, K. and Fa’apoi, E. (2018) Political representation on the new Auckland Council – has amalgamation led to greater diversity? Australian Journal of Public Administration, 77. https://doi.org/10.1111/1467-8500.12259
Wong, J. (2022) Māori wards contest in local body elections more competitive than ever before. Stuff, 17 August.
1 Treaty of Waitangi, the founding document which underpins the legitimacy of New Zealand’s system of government (Palmer and Palmer 2004). References to the Treaty are incorporated in New Zealand statutes, including the Local Government Act 2002 and the Resource Management Act 1991, which give effect to the New Zealand government’s obligations to honour Māori participation in local governance.
2 The Oceania region includes Australasia, Melanesia, Micronesia and the Pacific Islands.
3 The distributive model of social justice is based on the principle that individuals are entitled to an equal share of scarce resources, unless an unequal allocation is in the interests of historically disadvantaged groups.
4 Census data is based on self-identified ethnicity, which may not correlate exactly with the sources used in the study to identify the ethnicity of candidates and elected members.
5 The campaign achieved a voter turnout of 38%, up from 35% in 2013 (Department of Internal Affairs n.d.).