Commonwealth Journal of Local Governance
Issue 27
December 2022
RESEARCH AND EVALUATION (PEER REVIEWED)
Impacts of Municipal Re-Demarcations on Service Delivery in South Africa

Mpfareleni Mavis Netswera
Department of Public Administration and Management, Faculty of Economic and Management Sciences, University of South Africa, Pretoria, South Africa
Corresponding author: Mpfareleni Mavis Netswera, Department of Public Administration and Management, Faculty of Economic and Management Sciences, University of South Africa, Pretoria, South Africa, netswmm@unisa.ac.za/ and mpfareleni@hotmail.com
DOI: https://doi.org/10.5130/cjlg.vi27.8132
Article History: Received 25/03/2022; Accepted 03/12/2022; Published 20/12/2022
Citation: Netswera, M. M. 2022. Impacts of Municipal Re-Demarcations on Service Delivery in South Africa. Commonwealth Journal of Local Governance, 27, 17–36. https://doi.org/10.5130/cjlg.vi27.8132
© 2022 by the author(s). This is an Open Access article distributed under the terms of the Creative Commons Attribution 4.0 International (CC BY 4.0) License (https://creativecommons.org/licenses/by/4.0/), allowing third parties to copy and redistribute the material in any medium or format and to remix, transform, and build upon the material for any purpose, even commercial, provided the original work is properly cited and states its license.
Abstract
This paper examines the implications of municipal re-demarcations on service delivery through a case study of the Collins Chabane and JB Marks local municipalities in South Africa. The former is the result of a merger of two rural areas that were carved out of adjoining municipalities. The latter was established following the amalgamation of the erstwhile municipalities of Tlokwe and Ventersdorp, including the major centre of Potchefstroom. Thus, the two case studies are quite distinct in terms of racial demographics and history. Between 1995 and 2016, South Africa witnessed a significant reduction in the number of its municipalities, from over 800 racially based local authorities to 257 democratically elected municipalities. This trend reflects a belief that smaller municipalities are inefficient and not financially viable. However this study’s empirical findings, which were mainly obtained through a survey, suggest that mergers do not necessarily lead to improved local government capacity or efficient service delivery. The paper recommends further consideration of alternative models that can improve service delivery efficiency through voluntary cooperation or other collaborative arrangements.
Keywords
Municipal Demarcation; Re-Demarcations; Mergers; Amalgamation; Service Delivery; Borders/Boundaries
Introduction
Municipal demarcation in post-apartheid South Africa has been characterised by hostile reactions, often from the affected communities and, at times, from the opposition political parties in government. Researchers believe that this is because municipal boundaries have a great influence on citizens’ access to public services. Shale (2005, p. 2) claims that local boundaries should be drawn to ensure that local authorities can achieve better delivery of public services. For Cameron (2006, p. 76), the inclusion of a poorer area in a richer jurisdiction can lead to a better standard of services, while the inclusion of an area in a poorer jurisdiction often leads to inadequate access to services.
The initial post-apartheid re-demarcations, undertaken in preparation for the first non-racial democratic local government elections in 1995, attracted widespread disapproval by some residents of wealthy districts, who objected to incorporating with surrounding poorer areas (Matemba 2000, p. 4; Hornby 2004, pp. 30–31). Similar objections followed the incorporation of certain ethnic groups such as the Xhitsong-speaking community of Malamulele into the Thulamela Local Municipality (predominantly Venda-speaking) in 2000. Mavungu (2012, p. 63) tells of the violent protests in cross-boundary areas such as Khutsong, Matatiele and Moutse as a result of the abolition, in preparation for the 2006 municipal elections, of municipalities that had previously straddled provincial boundaries. Likewise, the re-demarcations proposed for the 2016 municipal elections were opposed in a number of areas across the country. For example, a merger in Free State Province was opposed by the residents of Metsimaholo Local Municipality who did not want to be incorporated with Ngwathe because they believed the neighbouring municipality was poorer, had problems with maladministration and would benefit from ‘their’ municipal resources (Holomisa 2016, para. 3; Municipal IQ 2013, p. 1).
The two municipalities that are the subject of this paper, the JB Marks and Collins Chabane Local Municipalities, were established as part of the re-demarcation exercise prior to the 2016 municipal elections. With a population of over 240,000 people, JB Marks forms part of the Dr Kenneth Kaunda District Municipality1 in the North West Province (categories of municipalities in South Africa are shown in Table 1). The amalgamation process combined the relatively large population of 180,000 in Tlokwe with 64,000 in Ventersdorp. Africans make up the majority of the population followed by Whites, Coloureds and Indians. Tlokwe comprised a mix of substantial urban areas, including Potchefstroom, Promosa and Ikageng townships, major agricultural holdings and rural hinterlands. Ventersdorp, on the other hand, was a vast rural/commercial farming area including Ventersdorp town, Tshing and Toevlug townships, and six villages. Potchefstroom is an important town and business centre about 140 km south-west of Johannesburg, and home to North-West University (JB Marks Local Municipality 2017a, pp. 43, 46).
Collins Chabane is some 190 km north of the Limpopo Province capital, Polokwane. It was created by the amalgamation of two large rural areas excised from neighbouring municipalities. The new municipality covers 5,003 km² with a population of approximately 347,000. Apart from the two main towns, namely Malamulele and Vuwani, it includes 173 villages and three informal settlements. The population is almost entirely African (Collins Chabane Local Municipality 2017, pp. 19, 28).
These two case studies were chosen because their mergers were marked by forceful community protests. In 2015, for the first time since the inception of the independent Municipal Demarcation Board (MDB) in 1998, the Minister of the Department of Cooperative Governance (DCG)2 invoked Section 22(2) of the Local Government: Municipal Demarcation Act 1998 by requesting the MDB to reopen determination of the outer boundaries of specific municipalities. This was an extraordinary request which came about two years after the original completion in 2013 of the re-demarcations for the 2016 local government election. In addition, the request was a major departure from the existing criteria of local government demarcations because, for the first time, municipal financial viability and functionality were placed at the core of boundary changes (Khumalo and Ncube 2016, p. 1; DCG 2015, p. 25). After accepting the Minister’s request, the MDB decided to proceed with the re-determination of 19 local municipalities across seven provinces (see Figure 1).
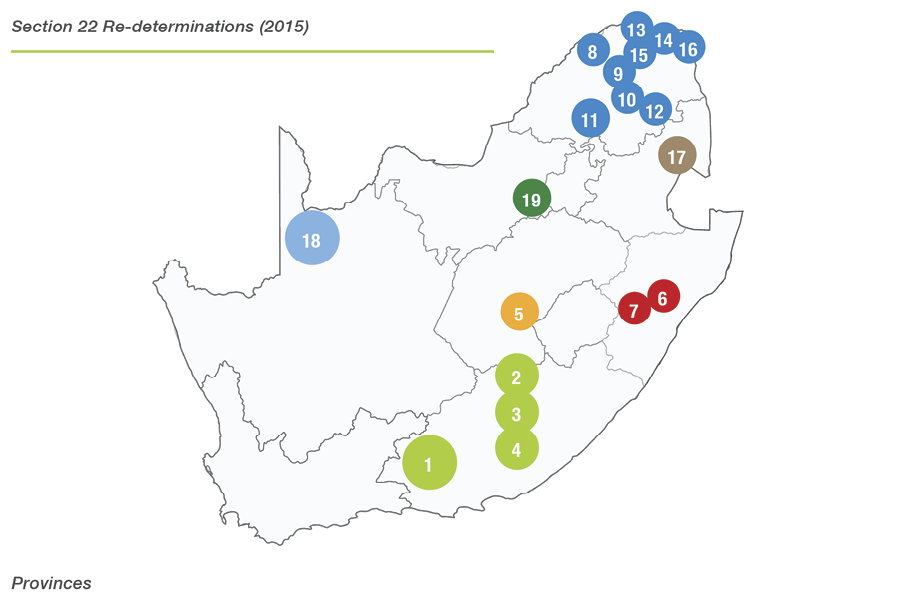
Figure 1. Outcomes of the 2015 re-determinations
Source: Municipal Demarcation Board (2016, p. 30)
Note: JB Marks is shown as no. 19 and Collins Chabane as no. 16.
The case of Collins Chabane (16 on the map) is very complicated. Out of the nine provinces of South Africa, Limpopo is unique because its population is made up of Venda, Pedi and Tsonga tribal groups that lived under separate homelands during the apartheid era. The MDB took a decision to merge two rural areas, namely Malamulele (a portion of the Thulamela Local Municipality dominated by the Tsonga people) and Vuwani (a portion of the Makhado Local Municipality dominated by the Venda people) to form a completely new municipality, namely Collins Chabane. This sparked violent protests by Vuwani community members who did not want to be part of the Tsonga-dominated municipality. In 2016 demonstrations degenerated into damage of public property, especially public schools (Mukwevho 2016). Malamulele residents had been demanding a separate municipality from Thulamela since 2000. Fuelling this demand was the claim that Thulamela was channelling services to Venda-speaking areas, (especially Thohoyandou, where the municipal council sits) to the detriment of the Malamulele community (Mdumela 2016).
Objection to the creation of JB Marks Local Municipality (19 on the map) was also widespread, with Ventersdorp residents opposing the merger for fear of losing jobs and business opportunities under the new administration with its headquarters in the former Tlokwe. On the other hand, residents of Tlokwe (including affluent areas of Potchefstroom) thought they would be disadvantaged when it came to the provision of municipal services. Ventersdorp was described as poor and rural with little to offer (eNews Channel Africa 2015). The opposition Democratic Alliance (DA) political party fought the merger in court but failed. In an urgent court application, the party alleged that the MDB was targeting municipalities falling under its (the DA’s) control and those municipalities that the party had prospects to control in the near future. It saw the merger as favouring the ruling party, the African National Congress (ANC) (MDB 2015, p. 2).
Against that background, this article explores perceptions of the influence of municipal boundaries and mergers on the capacity of municipalities, the way they perform their functions, and citizens’ access to public services. The sections which follow cover the theoretical rationale for local government structural reform; the history of municipal re-demarcations in post-apartheid South Africa; service delivery and related challenges; the research methodology and findings; plus, a conclusion and recommendations.
Theoretical rationale for local government structural reform
This section analyses the theoretical framework within which local government structural reform in South Africa is located. Structural reform, which involves reconfiguration of the number, types and size of municipalities, appears globally to be the most visible strategy for ‘improving’ or ‘strengthening’ systems of local government, often in concert with financial and jurisdictional reforms (Garcea and LeSage 2005, cited in Dollery and Robotti 2008, p. 15). Typically, it is aimed at enhancing administrative capacity and efficiency by enlarging the territorial and population base of local governments through mergers (Boyle 2016, p. 9), the thesis being that a larger demographic base allows municipalities to achieve what smaller authorities cannot. Increased size is associated with more efficient, cost-effective service delivery as well as with a broader range of specialised and better services in both quantitative and qualitative terms. Citizen satisfaction is therefore expected to increase along with an increase in the size of local government units (Hansen 2015, pp. 374–375; Cameron and Milne 2013, p. 3).
Devkota (2014) reports that most European countries, as well as a number of others outside Europe such as Israel, Australia, Canada and Japan, have reduced their number of local governments through amalgamations for those reasons. However, a number of reports suggest that poorer service delivery and citizen dissatisfaction may also arise when moving operations to a merged entity (Fox and Gurley 2006, p. 35). Opponents of mergers argue that bigger municipalities are less able to recognise what people want and to provide the differentiated package of tailored services that people seek (Mohammed 2015, pp. 173–174).
Structural reform may also involve ‘fragmentation’ – dividing a bigger municipality into smaller jurisdictions. Under fragmentation, a small-scale two-tier system comprising an upper-tier governing body (usually region, district or metropolitan area) plus lower-tier or area municipalities including towns and villages, may be created. The upper tier that provides region-wide services is characterised by economies of scale and externalities, whereas the lower tiers are responsible for services of a local nature. In some instances, their roles overlap, leading to claims that costs are higher because of waste and duplication (Ezekiel and Oriakhogba 2015, p. 207). Fragmentation has been embraced by many countries in recent years; however, a number of obstacles often prevent smaller municipalities from providing efficient public services. Part of the problem is their limited human resource capacity in the face of constant pressure to maintain and improve services. Often, in countries that are characterised by a high degree of political and administrative centralisation, smaller municipalities end up playing smaller roles (Buis and Boex 2015, pp. 7–8).
More recently, the debate surrounding local government reform has been complicated by the emergence of a layer of inter-municipal bodies that are considered easier to implement than structural changes – namely, forms of voluntary cooperation between municipalities, collaborative arrangements and special-purpose districts (Ezekiel and Oriakhogba 2015). Somerville and Gibbs (2012, p. 6) describe voluntary cooperation as an arrangement between geographically adjacent councils sharing resources on an ad hoc basis and operating on a needs basis whenever and wherever the perceived need for cooperation arises. Collaborative arrangements encourage existing smaller local councils to share scarce resources in the provision of services. Benefits cited as arising from such arrangements include cost savings, increased opportunities for regional and sub-regional strategic development, provision of a service not otherwise available, improved access to technical expertise and higher-quality work (Somerville and Gibbs 2012, p. 8). Special-purpose districts provide region-wide services such as education, transportation, water and waste management services (Ezekiel and Oriakhogba 2015, p. 205). To some extent, special-purpose districts in other countries correspond to South Africa’s district municipalities (see Table 1).
This discussion of structural reform raises the question of whether or not the repeated amalgamations of municipalities carried out in South Africa since 1995 represent the most appropriate local government reform. Specifically, this paper asks the following question: Was municipal re-demarcation the appropriate approach to apply in the two cases under investigation?
Post-apartheid municipal demarcation in South Africa
No unified system of local government existed under the apartheid regime in South Africa. Therefore, following the historic 1994 national and provincial elections that ushered in the new democratic dispensation, it was necessary to determine new boundaries, and in some cases to re-determine existing boundaries to establish a non-racial democratic local government system (de Visser 2009, p. 8). This exercise required the drafting of extensive legislation and the repeal or amendment of prior legislation regarding the demarcation of boundaries, as well as the establishment of structures, systems and financial management. In particular, the Local Government: Municipal Demarcation Act 1998 provided for the establishment of an independent MDB and procedure for the demarcation of local government boundaries. Section 24 of the Act explicitly states that when the MDB considers municipal demarcation or re-demarcation, its objective is to establish an area that would enable the municipality for that area to fulfil its constitutional obligations. Such municipalities would have a tax base as inclusive as possible of users of municipal services in their jurisdictions.
The MDB has the mandate to determine and re-determine municipal boundaries and wards in line with the election cycle every five years. Re-demarcation ranges from minor technical alignments of the boundaries between municipalities to major changes, which could include amalgamating some municipalities and demarcating new municipal areas (MDB 2014, pp. 8–9). Apart from the MDB’s own initiatives and proposals from the national Minister for Cooperative Governance, a provincial Member of the Executive Council for local government, a municipality, or any member of the public may propose a boundary re-determination (MDB 2021, p. 9).
Source: Netswera (2019, p. 10); Republic of South Africa (1996, p. 78)
Since 1995, municipal demarcation policy in South Africa shows a marked trend towards merging small local municipalities. Over a period of two decades, the MDB has successfully reduced the total number of municipalities from 830 to 257 (see Table 1). A summary of the reasoning behind the changing configuration of municipalities is presented in Table 2.
Source: Netswera (2019, p. 180)
Municipal service delivery and related challenges in South Africa
According to Crous (2002, p. 19), “Service delivery is concerned with the provision of a product or service by a government or government body to a community that it was promised to, or which is expected by that community.” In this paper, and within the context of local government in South Africa, service delivery refers to the provision of municipal services such as electricity, water, sanitation and refuse removal, which are a constitutional mandate for municipalities. Section 152 of South Africa’s constitution further requires municipalities to provide these services to communities in a sustainable manner. Consequently, a municipality is considered a well-functioning entity if it is able to fulfil its constitutional responsibilities within its financial and administrative capacity. Based on Schedule 4 (Part B) and Schedule 5 (Part B) of the constitution, Table 3 lists matters that fall under the jurisdiction of local government and that are service-oriented in nature. These matters are significant, since they improve the general welfare of citizens.
Source: Republic of South Africa (1996, pp. 136–139)
Based on community surveys carried out by Statistics South Africa, access to municipal services generally increased between 2011 and 2016. For example, the number of households with access to piped water increased from 13.2 million in 2011 to 15.2 million in 2016. The proportion of households whose flush toilets are connected to the sewerage system increased from 57% in 2011 to 60% in 2016. Similarly, access to electricity for lighting increased by 32% over the same period, from 58% in 1996 to more than 90% in 2016. Generally, there had been a continued growth in the percentage of households that use electricity for cooking, heating and lighting (Statistics South Africa 2016a, p. 96).
However, despite the general improvement in service delivery, there is concern about the dysfunctional state of many municipalities. This is evidenced by recent results from DCG’s assessment system, which categorises the country’s municipalities as high risk, medium risk, low risk or stable. Taking these categories alongside indicators such as political leadership, the quality of governance, financial management and the level of service delivery, 64 municipalities (24%) were considered high risk and dysfunctional in 2021. Of these 64 municipalities, 26 were already subject to provincial intervention due to failure to fulfil their executive obligations. A further 111 municipalities (43%) were considered medium risk, and only 16 (5%) were considered stable (Parliamentary Monitoring Group 2021). Other official reports, such as those of the Auditor General of South Africa (AGSA), have expressed concern that, after all the years of reporting local government’s shortcomings and making recommendations, municipalities have still not mastered the basics of financial reporting, with only 28% being able to submit quality financial statements for auditing purposes (AGSA 2021, p. 8). In addition to some municipalities being placed under supervision, it appears community alliances have found ways of simply taking matters into their own hands. In 2021, for instance, a court of law granted a residents’ association the right to take control of the area’s sewage works and to be paid by the municipality for its efforts. This was after a certain local municipality failed to clear up the sewage spilling into the rivers. In other areas, residents are fixing their sewerage system by themselves. Some are threatening to withhold their rates and taxes as they do not see any justification for payment (Everatt 2021).
It is worth noting that within the framework of cooperative governance, the DCG has undertaken a number of measures to support and strengthen local government. One example was the Project Consolidate initiative in 2004, which involved the deployment of experts to provide hands-on assistance to at least 136 identified municipalities that could not provide essential services at the time. The Siyenza Manje initiative followed in 2006, which involved in part rehiring retirees with skills in engineering, project and financial management, and town planning to targeted municipalities. In addition, the three spheres of government initiated the Back-to-Basics Strategy in 2014 as a collective action to address fault lines within the local governance system as a whole (Netswera 2019, pp. 99–101). These measures were complemented by the District Development Model in 2019, which involves joint and collaborative planning undertaken at local, district and metropolitan municipalities by all three spheres of government to fast-track service delivery by ensuring that municipalities are adequately supported and resourced to carry out their mandates (Government Communications and Information Systems 2019).
Study methodology
The research reported here (Netswera 2019) adopted a mixed-methods approach consisting of a household survey and personal interviews. Purposeful sampling facilitated the selection of two municipal officials from Collins Chabane, who took part in semi-structured interviews. Personal interviews with municipal officials from JB Marks could not be secured. A total number of 200 households participated in the survey, covering 17 villages and townships (Table 4). Participants were selected from a municipal household map, including every tenth household after a random starting point. It was estimated during the data collection phase that the total number of households in Collins Chabane and JB Marks stood at 91,936 and 80 572 respectively. According to Neuman (2014, pp. 269–270), for large populations of over 150,000, good accuracy can be obtained with a sampling ratio of 1%.
| Rural (%) | Township* (%) | Informal (%) | Total (%) | |
|---|---|---|---|---|
| Collins Chabane | ||||
| 1. Hamasia | 10 (100) | - | - | 10 (5) |
| 2. Ramukhuba | 10 (100) | - | - | 10 (5) |
| 3. Tshino (Vuwani) | 10 (100) | - | - | 10 (5) |
| 4. Hamashau Mukhoro | 11 (100) | - | - | 11 (5.5) |
| 5. Hamashau Misevhe B | 9 (100) | - | - | 9 (4.5) |
| 6. Basani | 10 (100) | - | - | 10 (5) |
| 7. Xigalo | 10 (100) | - | - | 10 (5) |
| 8. Hatshikonelo | 15 (100) | - | - | 15 (7.5) |
| 9. Malamulele | - | 10 (100) | - | 10 (5) |
| 10. Mukhoni | 5 (100) | - | - | 5 (2.5) |
| JB Marks | ||||
| 11. Tshing | - | 15 (71.4) | 6 (28.6) | 21 (10.5) |
| 12. Toevlug | - | 6 (60) | 4 (40) | 10 (5) |
| 13. Boikhutso | 8 (100) | - | - | 8 (4) |
| 14. Ikageng | - | 27 (84.4) | 5 (15.6) | 32 (16) |
| 15. Tsetse | 6 (100) | - | - | 6 (3) |
| 16. Promosa | - | 14 (100) | - | 14 (7) |
| 17. Sonderwater | - | 3 (33.3) | 6 (66.7) | 9 (4.5) |
| TOTAL | 104 (52) | 75 (37.5) | 21 (10.5) | 200 (100) |
*These are African townships established during the apartheid era.
Of the three different types of human settlement that characterise the South African landscape, the majority of participants were from rural areas (52%), followed by those residing in urban areas or townships (37.5%). The proportion of participants living in informal settlements or slums was 10.5%. There was an even spread in the number of participants from Collins Chabane, with an average of 10 per village. Higher concentrations of participants from JB Marks came from the three townships of Ikageng, Tshing and Promosa.
The survey sought participants’ views on four key matters: (1) What is the role of local government in the provision of services? (2) What is the capacity of local municipalities to provide services and other opportunities to their residents on an equal basis? (3) How has the merger affected the provision of municipal services such as water, electricity, sanitation and refuse removal? (4) How satisfied are the communities with the provision of municipal services?
The Pearson chi-square test was used to compare and contrast perceptions of these issues between the two local municipalities. This tested a hypothesis that (a) services are significantly differently provisioned in different municipalities and (b) mergers influence the manner in which services are delivered to the community. Where a Pearson chi-square value of 0.05 or below is found, this indicates significant differences in perceptions between the participants from the two different municipalities.
Findings
The role of local government in the provision of services
The survey sought to gauge participants’ knowledge of local government’s functions and the role of municipalities in the provision of basic services by recording their level of agreement or disagreement with various claims on a five-point scale (see Table 5).
The majority of households in both cases agreed that municipalities have a role to play in providing them with basic services. Collins Chabane residents’ significantly stronger view (Pearson X2 = 0.00) may suggest a higher reliance on the municipality compared to JB Marks. There were no significant differences of opinion (X2 = 0.26) between the two sets of participants regarding their municipal officials’ capacity to decide which services are needed in their respective areas.
Further, the difference in perceptions regarding the statement ‘The municipality is utilising its financial resources well to provide services to the community’ was insignificant (X2 = 0.17). In both cases, the majority (69% in Collins Chabane, and 55% in JB Marks) disagreed with this view. However, there were significant differences in relation to the statement ‘The delivery of basic services which are of highest quality is important for my well-being’.
Participants in both cases agreed with the statement that ‘Failure by the municipality to provide services leads communities to revolt against the authority’ (87% in Collins Chabane and 63% in JB Marks agreeing strongly, with a further 34% in JB Marks simply agreeing). As to whether ‘… the municipality gives priority to my basic needs’, a significant difference of X2 = 0.009 arose. The majority of Collins Chabane (67%) and JB Marks (68.7%) disagreed, but with another 29.3% from JB Marks disagreeing quite strongly. There was also a significant level of disagreement (X2 = 0.00) across the two municipalities regarding the statement ‘There are times when the municipality exceeds my expectations’. It is important to note that all disagreed with this claim, but with stronger disagreement from JB Marks participants.
On perceptions of equality in service delivery between residents of different ethnic groups, there were no statistically significant differences (X2 = -0.431), responses varying from strong agreement to strong disagreement in both cases. However, a significant difference (X2 = 0.00) appeared concerning the statement ‘I want the municipality to involve me in making decisions about what services are delivered in my local area’. While all affirmed this position, the level of agreement in JB Marks was weaker (only 71% strong agreement compared to 92% in Collins Chabane).
Municipal administrative capacity
Local government requires human and financial resources to carry out its responsibilities. Without adequate resources, the delivery of public services cannot materialise. Against this background, the empirical findings show that there was no significant difference (X2 = 0.33) between the opinions of residents regarding the statement that the municipality has enough capacity to deliver services by itself. A majority of Collins Chabane participants (51%) disagreed with that statement, and 44% in JB Marks. These perceptions point to challenges in municipal administrative capacity.
Vacancy rates in certain occupational categories are another reliable indicator of municipal administrative capabilities. The Collins Chabane organisational structure at management level consisted of an acting municipal manager, acting chief financial officer, an acting technical services director and a handful of other employees (Collins Chabane Local Municipality 2017, p. 14). It is worth noting that high vacancy rates are the norm in smaller, mainly rural, local municipalities such as Collins Chabane. Almost a decade ago, average vacancy rates within South African municipalities were approximately 28% (Nkhahle 2015, p. 34). Personal interviews with municipal officials shed some light on the high vacancy rate in Collins Chabane as well as suggesting some progress in senior manager appointments:
We have got a lot of posts that are not filled, ok. Remember, we are a new municipality and our organisational structure is not yet finalised. We are busy with the evaluation of posts. Director Corporate is filled, Director Planning, CF filled, MM [municipal manager] filled and Developmental Planning (Collins Chabane municipal official interview).
The view held by the Vhembe District, within which Collins Chabane is located and which provides ‘higher order’ services, is that there is a lack of capacity in Collins Chabane in some of the line functions:
In the case of [the] new municipality, there is no capacity in terms of disaster management functionaries. No cars, no office space, one disaster management coordinator, and they are unable to do assessment within 72 hours after the disaster had occurred (Vhembe municipal official interview).
In stark contrast, most of the top management positions at JB Marks had been filled (municipal manager; acting chief financial officer; managers for corporate services, community services, sports, arts and culture, and public safety; acting housing and planning manager; local economic development manager; infrastructure manager) (JB Marks Local Municipality 2017b, p. 42). However, despite its relative administrative stability, JB Marks still faced some challenges regarding staff placement and the stabilisation of administration systems. The consensus is that it takes about two years for a municipality to settle after a merger, mainly due to transfers of staff and assets: such disruptions negatively affect service delivery and cause uncertainty both among residents and within the municipality’s organisation (JB Marks Local Municipality 2017b, p. vi).
Households’ access to municipal services
A series of questions about the level of access to basic municipal services were asked to test households’ experiences (see Figure 2). Municipal officials were also asked if they thought that their municipalities had the capacity to provide these services efficiently and equitably to their respective residents.
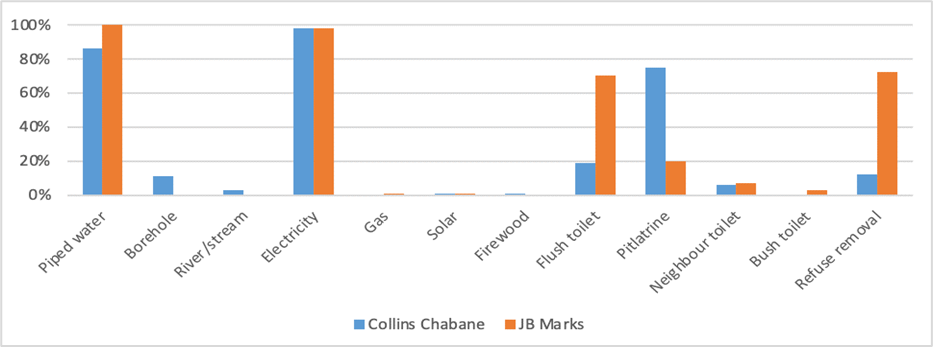
Figure 2. Households’ access to water, energy, sanitation and refuse removal
All the participants in JB Marks had access to piped water supplied by the local municipality. A very high proportion of the participants (86%) in Collins Chabane also had piped water. Households’ access to electricity was the same in both cases at 98%. However, while 70% of JB Marks participants used flush toilets, a comparable 75% of Collins Chabane residents relied on pit latrines. In both municipalities, some relied on neighbours’ toilets while a few in JB Marks relieved themselves in the bush. It is noteworthy, however, that there was no use of the bucket toilet system in either case. 3 Collins Chabane had a low level of refuse removal services because of its vast rural nature: only 12% of participants had their refuse removed by the local authority. The rest either disposed of waste themselves or simply dumped it in an unregulated manner.
District-wide functions such as bulk water supply, electricity and sanitation services are assigned to district municipalities, but local municipalities may be authorised to take over these functions provided they have capacity to do so (Nkhahle 2015, p. 47). In the case of Collins Chabane, residents receive electricity from Eskom (the national agency) and water and sanitation services from the Vhembe District:
Water is not our competency; it is for the District. Water is not for us. We do not provide electricity. It is Eskom. We are doing refuse. Sanitation is District. So, the municipality is only responsible for refuse removal. Not the same in all local municipalities. It depends. Makhado Local Municipality has electricity licence and Thulamela Local Municipality does not have the licence to provide electricity. Eskom does provide electricity on our behalf. It may look like the municipality is providing electricity to the people but it is Eskom (Collins Chabane municipal official interview).
JB Marks provides its residents with all four municipal services. Electricity supply is shared between the municipality and Eskom. To maximise revenue as well as to improve the management and delivery of services, a policy proposal was under consideration that the municipality take over all electricity supply in the future (JB Marks Local Municipality 2017a, pp. 4–5).
Figure 3 presents findings on the perceived quality of selected services provided by the two local municipalities, focusing especially on electricity and water interruption, and non-removal of refuse.
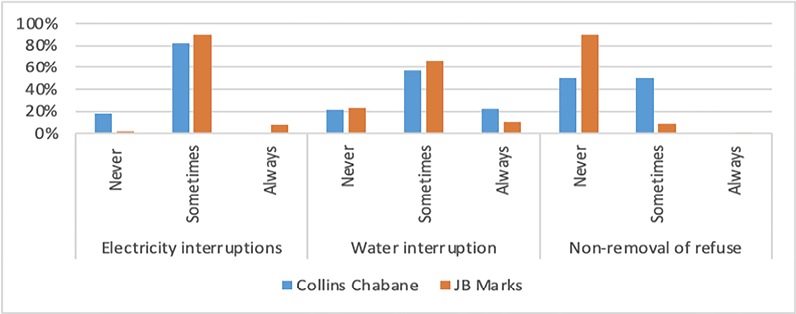
Figure 3. Experience with the level and quality of services provided by the municipality
A high proportion of participants (90%) in JB Marks claimed that they “sometimes” experienced electricity interruptions, while 65% claimed that they “sometimes” experienced water interruptions. While 90% of the participants in JB Marks indicated that they have “never” experienced non-removal of refuse, it seems likely this is because Collins Chabane residents do not have access to refuse removal services in the rural areas at all. These perceived experiences of service interruptions are higher than provincial averages. In 2015, the prevalence of electricity interruptions among households was highest in North West Province (60.6%) followed by Mpumalanga (35.9%) and Gauteng (33.9%). Limpopo (1.4%), Free State (5.6%) and KwaZulu-Natal (7.2%) reported the least interruptions (Statistics South Africa 2016c, p. 40). While interruptions in the provision of electricity showed statistically significant differences between the two municipalities (X2 = 0.00), there was no statistically significant difference (X2 = 0.063) between the two municipalities regarding their experience of water interruptions.
Responses to questions about the affordability of municipal services are presented in Table 6.
| Affordable % | Expensive % | Don’t pay % | Pearson X2 | ||
|---|---|---|---|---|---|
| Electricity | Collins Chabane | 18.2 | 81.8 | 0.0 | .353 |
| JB Marks | 18.6 | 79.4 | 2.1 | ||
| Piped water | Collins Chabane | 3.0 | 2.0 | 95 | .000 |
| JB Marks | 28 | 40 | 32 | ||
| Sanitation | Collins Chabane | 1.0 | 0 | 99 | .000 |
| JB Marks | 33.7 | 26.5 | 39.8 | ||
| Refuse removal | Collins Chabane | 2.0 | 0 | 98 | .000 |
| JB Marks | 34.3 | 26.3 | 39.4 |
With regard to electricity provision, there was no statistically significant variation (X2 = 0.35) between the two municipalities. Strong agreement prevailed that electricity was expensive (81.8% in Collins Chabane and 79.4% in JB Marks). A public opinion survey conducted earlier in JB Marks had discovered that 95% of residents’ electricity purchases was used to cover overdue municipal expenditure since the merger. Residents claimed they were paying R20.00 to receive a single unit of electricity that should normally cost about R2.00 (Potchefstroom Herald 2017).
There was a significant difference (X2 = 0.00) between the two municipalities regarding the affordability of piped water. The majority in Collins Chabane (95%) did not pay for piped water: in rural areas people largely rely on free communal tap water that they share among themselves. Residents of JB Marks were split between those who perceived the service to be affordable (28%), those who felt it was expensive (40%), and those who did not pay (35%). A significant difference (X2 = 0.00) was also observable in the case of sanitation. While 99% of Collins Chabane did not pay for sanitation provision because they rely on pit toilets, residents of JB Marks were split between those who perceived the service to be affordable (33.7%), those who felt it was expensive (26.5%), and those who did not pay (39.8%). For refuse removal, 98% of the participants from Collins Chabane did not receive/pay for this service, while perceptions from JB Marks ranged from those who thought the service was affordable (26.3%), via those who felt it was expensive (34.3%), to those who did not pay (39.4%). Failure of the majority of Collins Chabane residents to pay for basic services should be attributed to the fact that households mostly rely on communal taps, pit toilets, and dumping refuse in their backyards.
The principle that municipalities should substantially self-fund from local sources is an important feature of local government in South Africa. Still, Collins Chabane does not raise enough revenue through payments for services. The municipality falls within the majority of rural municipalities that rely for more than 50% of their operational expenses on national government transfers (Khumalo and Ncube 2016, p. 15).
Differences in the way municipal services are rendered under new jurisdictions
One of the ways to determine participants’ attitudes towards municipal mergers is to ask them if they feel there is a difference in the delivery of municipal services since the merger. To determine such attitudes, the following question was asked: Your area is now merged with another to form a new local municipality. Is the merger making each of the following much better, better, no different, worse or much worse?
| Service | Local municipality | Much better % | Better % | Same % | Worse % | Much worse % | Pearson X2 |
|---|---|---|---|---|---|---|---|
| Access to water | Collins Chabane | 8.1 | 13.1 | 51.5 | 16.0 | 11.0 | .113 |
| JB Marks | 2.0 | 21.1 | 57.6 | 23.2 | 5.1 | ||
| Access to electricity | Collins Chabane | 4.0 | 16.2 | 70.7 | 9.1 | 0.0 | .000 |
| JB Marks | 2.5 | 11.2 | 40.8 | 31.6 | 15.3 | ||
| Access to sanitation | Collins Chabane | 3.0 | 12.1 | 65.7 | 19.2 | 0.0 | .046 |
| JB Marks | 1.0 | 12.4 | 57.7 | 20.6 | 8.2 | ||
| Refuse removal by the municipality | Collins Chabane | 4.0 | 2.0 | 94.0 | 0.0 | 0.0 | .000 |
| JB Marks | 3.2 | 19.1 | 60.6 | 9.6 | 7.4 | ||
| Condition of the streets | Collins Chabane | 1.0 | 15.2 | 38.4 | 30.3 | 15.2 | .032 |
| JB Marks | 3.1 | 10.2 | 56.1 | 25.0 | 5.0 | ||
| Street lighting | Collins Chabane | 0.0 | 4.0 | 90.0 | 5.0 | 1.1 | .002 |
| JB Marks | 2.1 | 19.1 | 67.0 | 10.6 | 1.1 | ||
| Job opportunities through Community Works Programme | Collins Chabane | 3.0 | 8.0 | 46.0 | 21.0 | 22.0 | .004 |
| JB Marks | 3.1 | 23.5 | 42.9 | 23.5 | 7.1 |
A high proportion of the survey participants in both municipalities thought that the merger did not make any difference to the manner in which services are delivered to the community. This response could be influenced by the fact that the mergers are recent, and it might thus be too early to tell whether any change has occurred. Across several areas of service delivery considerable numbers of participants living in JB Marks identified improvements. On the other hand, the reverse applied in Collins Chabane, especially in the case of water supply, sanitation, the condition of residential streets and the provision of free basic services for poor households.
JB Marks is the result of the merger between one municipality with substantial resources and another without. This brought a myriad of challenges. The collection rate of taxes of the former Ventersdorp and Tlokwe local municipalities before the merger was 35% and 92% respectively (JB Marks Local Municipality 2017a, p. 190; Mafikeng Mail, n.d.). This amalgamation therefore could be described as merging a delinquent municipality into a vibrant one with a decent tax base. In the absence of long-term grant funding from the national government, this type of amalgamation adds a new layer of responsibility to the new, merged municipality of delivering services to poorer areas with no existing tax base. In this case, Ventersdorp residents are set to benefit from Tlokwe resources (Municipal IQ 2009, p. 1).
Conclusion
Based on the belief that smaller municipalities are inefficient and not financially viable, amalgamation has been central to local government reform in South Africa since 1995. But the findings presented here suggest that mergers do not necessarily lead to improved local government capacity and efficient service delivery. Overall, while the majority of survey participants perceived no difference in the quality of municipal services delivered in their new municipal areas, there were notable concerns in one or both new municipalities with respect to water supply, sanitation and electricity.
There was a significant difference in the capacity of the two municipalities and, consequently, in the levels of services the residents were receiving in the two study areas. As a higher capacity municipality, JB Marks provided all the municipal services to its residents, and all its senior managerial posts were filled, a factor that is vital to the overall provision of services. On the other hand, Collins Chabane shared responsibility in a number of functions with Vhembe District Municipality, from which its residents received most of their basic services. In terms of management capacity, Collins Chabane was facing some serious challenges. During the course of this research, the organisational structure had not been finalised, which is a major hindrance to efficient service delivery. The municipality is poor and the evidence suggests it should not have been established in the first place: it has little to offer its residents.
Given these findings, the research casts doubt on the value of mergers and supports investigation of alternative models that can achieve efficiency without municipal boundary changes. These include encouraging existing smaller local municipalities to collaborate in the provision of services by means of voluntary cooperation and other collaborative arrangements, such as special-purpose districts and/or greater use of existing district municipalities.
Declaration of conflicting interest
The author declared no potential conflicts of interest with respect to the research, authorship, and/or publication of this article.
Funding
The authors received no financial support for the research, authorship, and/or publication of this article.
References
Auditor General of South Africa. (AGSA). (2021) Consolidated general report on the local government audit outcomes MFMA 2019–20. Pretoria: AGSA.
Boyle, R. (2016) Re-shaping local government: overview of selected international experience with local government reorganisation, mergers, amalgamation and coordination. Dublin: Institute of Public Administration.
Buis, H. and Boex, J. (2015) Improving local government performance by strengthening their 5 core capabilities. The Hague: VNG International.
Cameron, R. (2006) Local government boundary reorganization. In: Pillay, U., Tomlinson, R. and Du Toit, J. (eds.) Democracy and delivery: urban policy in South Africa, (pp.76–106). Cape Town: Human Sciences Research Council.
Cameron, R. and Milne, C. (2013) Size, efficiency and local democracy in South Africa: a preliminary assessment. African Journal of Public Affairs, 6 (4), 1–20.
Collins Chabane Local Municipality. (2017) LIM345 Local Municipality 2017/18-2022 adopted IDP. Malamulele: Collins Chabane Local Municipality.
Crous, M. (2002) Service delivery in the South African public service: implementation of the Batho Pele principles by Statistics South Africa. Masters Dissertation, University of Pretoria.
Department of Cooperative Governance. (DCG). (2015) DCG annual report for the financial year 2014/15. Pretoria: DCG.
De Visser, J. (2009) Developmental local government in South Africa: institutional fault lines. Commonwealth Journal of Local Governance, (2), 7–25. https://doi.org/10.5130/cjlg.v0i2.1005
Devkota, K.L. (2014) The great amalgamation. The Kathmandu Post. Available at: https://kathmandupost.com/opinion/2014/11/12/the-great-amalgamation
Dollery, B.E. and Robotti, L. (eds.) (2008) The theory and practice of local government reform. Cheltenham: Edward Elgar Publishing Limited.
eNews Channel Africa. (2015) Ventersdorp/Potch merger is not welcome residents. Available at: https://www.enca.com/south-africa/ventersdorppotch-merger-not-welcome--residents
Everatt, D. (2021) South Africans are revolting against inept local government. Why it matters. Available at: https://theconversation.com/south-africans-are-revolting-against-inept-local-government-why-it-matters-155483
Ezekiel, M.P. and Oriakhogba, D.O. (2015) Towards a viable local government structure in Nigeria: overview of US and German local government systems. Mizan Law Review, 9 (1), 201–214.
Fox, W.F. and Gurley, T. (2006) Will consolidation improve sub-national governments? World Bank Policy Research Working Paper, 3913. Washington DC: World Bank. https://doi.org/10.1596/1813-9450-3913
Government Communications and Information Systems. (2019) District development model to be launched in Waterberg District. Available at: https://www.gcis.gov.za/newsroom/media-releases/district-development-model-be-launched-waterberg-district.
Hansen, S.W. (2015) The democratic costs of size: how increasing size affects citizen satisfaction with local government. Political Studies, 63 (2), 373–389. https://doi.org/10.1111/1467-9248.12096
Holomisa, B. (2016) Who has the final say between the Demarcation Board and citizens in municipal borders? Available at: https://www.dailymaverick.co.za/opinionista/2016-05-06-who-has-the-final-say-between-the-demarcation-board-and-citizens-in-municipal-borders/.
Hornby, D. (ed.) (2004) Shaping South Africa: reflections on the first term of the Municipal Demarcation Board, South Africa 1999–2004. Pretoria: MDB.
JB Marks Local Municipality. (2017a) Integrated development plan 2017–2022. Potchefstroom: JB Marks Local Municipality.
JB Marks Local Municipality. (2017b) 2016/2017 unaudited draft annual report. Potchefstroom: JB Marks Local Municipality.
Khumalo, B. and Ncube, M. (2016) Financial and functional viability and sustainability of municipalities: beyond the demarcation instrument. Paper presented to the MDB Conference on Demarcation and Spatial Transformation, Birchwood Hotel, Boksburg, 23–24 June.
Mafikeng Mail. (n.d.) Cope decries amalgamation of Ventersdorp, Tlokwe Municipalities. Available at: https://www.northwestnewspapers.co.za/mafikengmail/community/blogs/letters/98-cope-decries-ama.
Matemba, L. (2000) Challenges facing new municipalities. Southern African Catholic Bishops’ Conference Parliamentary Liaison Office Briefing Paper 36. Cape Town: Southern African Catholic Bishops’ Conference.
Mavungu, M.E. (2012) Ideological clashes behind provincial boundary disputes in post-apartheid South Africa. South African Geographical Journal, 94 (1), 60–74. https://doi.org/10.1080/03736245.2012.675734
Mdumela, T.G. (2016) What tribal affinities have to do with local government service delivery. Master dissertation, University of Limpopo.
Mohammed, A.K. (2015) The politics of municipal fragmentation in Ghana. Commonwealth Journal of Local Governance, (16/17), 171–192.
Mukwevho, N. (2016) Tribal tension between the Venda and Tsonga groups fuel conflict in Vuwani. SowetanLIVE. Available at: http://www.sowetanlive.co.za/news/2016/05/09/tribal-tension-between-the-venda-and-tsonga-groups-fuel-conflict-in-vuwani.
Municipal Demarcation Board. (MDB). (2014) Municipal Demarcation Board annual report 2013/14: celebrating 15 years of spatial transformation. Pretoria: MDB.
Municipal Demarcation Board. (MDB). (2015) Municipal Demarcation Board responds to High Court ruling in DA vs MDB court interdict. Press release, 06 November 2015. Pretoria: MDB.
Municipal Demarcation Board. (MDB). (2016) Municipal Demarcation Board annual report 2015/16: optimising spatial planning through integration. Pretoria: MDB.
Municipal Demarcation Board. (MDB). (2021) Demarcation Bulletin. Issue 2, Sep 2021. Available at: https://www.demarcation.org.za/wp-content/uploads/2021/10/DEMARCATION-BULLETIN-ISSUE-2.pdf.
Municipal IQ. (2009) The intricacies of re-demarcation. Briefing #161, 8 October. Johannesburg: Municipal IQ.
Municipal IQ. (2013) Sasolburg: the importance of communication. Briefing #415, 22 January. Johannesburg: Municipal IQ.
Netswera, M.M. (2019) The effects of municipal demarcation on service delivery and social integration in Collins Chabane and JB Marks Local Municipalities. PhD thesis, University of South Africa.
Neuman, W.L. (2014) Social research methods: quantitative and qualitative approaches. (7th ed.) London: Pearson.
Nkhahle, S. (ed.) (2015) 15 years of developmental and democratic local government (2000-2015): celebrating achievements whilst acknowledging the challenges. Pretoria: SALGA.
Parliamentary Monitoring Group. (PMG). (2021) State of local government. Available at: https://pmg.org.za/blog/State%20of%20Local%20Government.
Potchefstroom Herald. (2017) Protests in Ventersdorp and Tlokwe show ANC failure to deliver services, says DA, 14 July 2017. Available at: http://potchefstroomherald.co.za/35930/protests-ventersdorp-tlokwe-show-anc-failure-deliver-services-says-da/.
Republic of South Africa. (1996) Constitution of the Republic of South Africa. Pretoria: Government Printer.
Republic of South Africa. (1998) Local Government: Municipal Demarcation Act, (Act 27 of 1998). Pretoria: Government Printer.
Shale, V. (2005) Demarcating local authorities’ boundaries for good governance versus the people-to-people relations: The case of Lesotho. EISA Occasional Paper Number 28 (January). Auckland Park: Electoral Institute for Sustainable Democracy in Africa (EISA).
Somerville, D. and Gibbs, M. (2012) Legal and governance models for shared services in local government. Sydney: University of Technology Sydney’s Centre for Local Government.
Statistics South Africa. (2016a) Community survey 2016. Pretoria: Statistics South Africa.
Statistics South Africa. (2016b) Non-financial census of municipalities for the year ended 30 June 2015. Pretoria: Statistics South Africa.
Statistics South Africa. (2016c) General household survey (GHS) 2015. Pretoria: Statistics South Africa.
1 District municipalities undertake certain ‘higher order’ service delivery and planning functions across multiple local municipalities.
2 As a national government department, DCG is mandated by the 1996 constitution to develop national policies and legislation with regard to local government and to monitor implementation thereafter.
3 North West Province had 6,184 households relying on bucket toilets in 2015 (Statistics South Africa 2016b, p. 2)