Commonwealth Journal of Local Governance
Issue 28
September 2023
RESEARCH AND EVALUATION (PEER REVIEWED)
Funding Primary Health Care Service Delivery in the West Nile Sub-Region, Uganda

Stella B. Kyohairwe
Department of Political and Administrative Sciences, Uganda Management Institute, Kampala, Uganda, stella.kyohairwe@gmail.com

Christopher Yikii Agatre
Faculty of Business and Management, Muni University, Arua, Uganda, chrisyikii@gmail.com
Corresponding author: Stella B. Kyohairwe, Department of Political and Administrative Sciences, Uganda Management Institute, Kampala, Uganda, stella.kyohairwe@gmail.com
DOI: https://doi.org/10.5130/cjlg.vi28.7891
Article History: Received 13/09/2021; Accepted 29/06/2023; Published 25/09/2023
Citation: Kyohairwe, S. B., Agatre, C. Y. 2023. Funding Primary Health Care Service Delivery in the West Nile Sub-Region, Uganda. Commonwealth Journal of Local Governance, 28, 24–41. https://doi.org/10.5130/cjlg.vi28.7891
© 2023 by the author(s). This is an Open Access article distributed under the terms of the Creative Commons Attribution 4.0 International (CC BY 4.0) License (https://creativecommons.org/licenses/by/4.0/), allowing third parties to copy and redistribute the material in any medium or format and to remix, transform, and build upon the material for any purpose, even commercial, provided the original work is properly cited and states its license.
Abstract
The provision of primary health care services is a global concern and quality health service delivery is based on a number of factors, including motivated health workers, good-quality infrastructure, consistent supply of medicines and technologies, adequate funding, sound health plans, and evidence-based policies. This study investigated the funding of primary health care service delivery in three local government districts in Uganda’s West Nile sub-region, and identified deficiencies in the allocation, disbursement and timeliness of health funding which have a negative impact on service delivery. Inadequate funding affects the quality of services, limits essential supplies and causes excessive reliance on private financing, which is not sustainable in poor rural economies. In view of these findings, the study recommended deliberate action by both central government and district councils to increase the percentage of funding allocated in their annual budgets to the health sector, in line with the 2001 Abuja Declaration. The government of Uganda should consider prioritising an increase in total national budget allocations to local governments; primary health care disbursements from central government should be paid on time directly to health facilities by use of the ‘straight-through processing system’ for all types of funding; the government should introduce, support and encourage additional community financing initiatives such as Community Health Insurance Schemes; and district and local community leaders should be sensitised on the benefits of this approach.
Keywords
Financial Availability; Public Health Care; Health Service Delivery; West Nile Sub-Region
Introduction
Universal health coverage is viewed as a key strategy for achieving the global Sustainable Development Goals (SDG) in the health sector. However, the health financing difficulties that developing countries experience have left many millions of people without access to basic health services (Drechsler and Jutting 2007; Ministry of Health [MoH] 2016a).
One of the World Health Organization’s (WHO)1 global priorities is to establish equitable, effective and efficient primary health care service delivery (PHCSD) in all countries, through which health systems provide quality health and financial protection, as well as client satisfaction (Bossert et al. 2007; WHO 2008). Quality health requires services that are effective, safe and people-centred to the extent of meeting individual needs, values and preferences. Financial protection means minimising out-of-pocket expenses and financial hardship at the time people need health services by the use of pre-payments or pooling resources.
Effective PHCSD is based on motivated health workers, well-maintained infrastructure, consistent supplies of medicines and technologies, adequate funding, meaningful health plans, and evidence-based policies. This highlights the importance of inputs into the health system, including the workforce, medicines and supplies, information systems, supportive supervision and funding (Roberts et al. 2003; Bradley et al. 2010). Increased inputs, if properly utilised, should result in improved service access and quality, and also better health outcomes, particularly in developing countries (Loevinsohn 2008; de Savigny et al. 2009).
While many factors are involved, this paper focuses on health financing because empirical evidence suggests that adequate, efficient and equitable funding improves the level and distribution of health across the population, as well as the responsiveness of the health system to people’s expectations (Guimaraes et al. 2012; WHO 2012). However, effective health care financing involves much more than simply raising funds, and extends beyond the modes of financial allocation and purchase of health services. In their study on sub-Saharan Africa, Navarro and Lievens (2012) note that while government is the primary source of health funding, other sources are also important, such as social health insurance, private insurance, out-of-pocket fees, donations and community financing. The wider literature also suggests that further sources, such as taxes and direct levies on income or remittances, as well as other business transactions, could be directed toward a health financing pool (Guimaraes et al. 2012). However, as government is typically the dominant financier of health services and in particular the primary health care (PHC) system, this study investigates the system of government health funding and its impact on PHCSD in Uganda.
Funding health care in developing countries
In developing countries, health services are often characterised by insufficient financial support, poor policies and plans, extensive out-of-pocket charges, and inefficient use of scarce resources (WHO 2000; Lochoro et al. 2004). The main concerns in many developing countries about financing health service delivery are twofold: (a) mobilisation of adequate financial support; and (b) timeliness in financial disbursements to health facilities and proper utilisation of funds. Annual growth in funding for PHCSD is envisioned as a key financial strategy in improving health care outcomes (Precker and Carin 2004; UBOS 2011; UBOS 2013; WHO 2016).
Local governments may play an important role in PHCSD, and several studies have been conducted to document the status of health funding and service delivery at the local government level. In the case of Tanzania, Gasto et al. (2013) identified problems relating to insufficient funding, late government disbursements, insufficient health personnel, inadequate community participation, and political interference. Their study emphasises the lack of autonomy in resource mobilisation and utilisation accorded to local governments in developing countries, and concludes that central governments should adhere to principles that empower local governments and grant more autonomy in planning and managing health funds.
A WHO (2008) study identified significant challenges in financing health services for citizens in developing countries such as Uganda. It noted limited government expenditure on health services and a primarily self-funding model of health services for a large proportion of the population. Similarly, studies in Latin America by Wagstaff et al. (2015) found higher personal out-of-pocket spending on health care than on other household consumption. Self-funding for health limits disposable income for other essential goods and services, affecting overall population welfare. Previous studies in Uganda have criticised the government’s insufficient investment in medicines and human resources at health facilities (MoH 2003; Ministry of Finance, Planning and Economic Development [MoFPED] 2011), leaving many people with few options other than seeking services in private facilities and financing their own health expenses. Unplanned health expenses, regrettably, distort the expenditure priorities of people and households, and can sometimes account for the persistence of poverty in communities.
Health care system and service delivery in Uganda
In Uganda, health services are delivered through a decentralised framework, with some structures and services coordinated at the national level (Ssengooba et. al. 2017). The MoH takes the lead and coordinates curative, preventive, promotional, palliative and rehabilitative services at the national level. Its core functions include policy formulation and management, strategic planning, standard setting and quality assurance, resource mobilisation, capacity building, and technical supervision. The Ministry also coordinates health research and assesses the overall performance of the health sector. These functions are carried out in collaboration with a number of agencies, including the National Drug Authority, National Medical Stores, Uganda AIDS Commission, Central Public Health Laboratory and Uganda Blood Transfusion Service.
Uganda now has a total of nearly 7,000 health facilities. About 45% are government-owned, 15% are private and not-for-profit, and the remaining 40% are private-for-profit. The services are classified into seven levels based on the catchment area they are intended to serve (see Table 1).
*Health facilities at district level and below correspond to rural local government units as defined by the Local Governments Act 1997.
Source: Guidelines for Governance and Management Structures, MoH, (2013); Acup et al. (2016)
Health Centre I (HC1) is the lowest level in the health system, and comprise village health teams or individual health volunteers (that may or may not be formally trained) serving to link the community to the national health service. Health Centre II (HCII) is a parish-level facility that is led by an enrolled nurse who works with a midwife and two nursing assistants. They serve about 5,000 people. Health Centre III (HCIII) facilities serve approximately 20,000 people at a subcounty level and supervise community health workers and the HCIIs within their jurisdiction. Health Centre IV (HCIV) is the highest health facility in the district and serves a county population of approximately 100,000 people. The Health Center IV offers inpatient care with wards, has an operating theatre for emergency surgery and a blood transfusion service (Acup et al. 2016).
At the national level, the MoH supervises the national and regional referral hospitals. At sub-national levels, service delivery and health management are coordinated through districts and health sub-districts. District and county health teams are responsible for the planning, organisation, budgeting and management of health services at those levels, and they oversee health facilities at sub-county and parish levels as well. Village health teams play a semi-formal role in health promotion and service coordination in local communities. Parallel private health facilities provide complementary health services to communities at all levels (MoH 2010, 2013).
The Local Governments Act 1997 decentralised health care management and delivery. As noted above, district local governments lead on planning, budgeting and implementing health policies and plans. Except for the roles of chief administrative officer, deputy chief administrative officer and town clerk, local governments are mandated to recruit and manage all human resources under their jurisdiction including personnel in charge of providing health care. They are also responsible for managing hospitals and health centres within their territorial jurisdictions, and for supervising and monitoring all health activities, including those provided by the private sector (MoH 2010).
Local government annual workplans and budgets result in funding allocations from the national budget to rural districts and urban municipalities via PHC grants. There are three categories of grant funding:
• Wage Conditional Grants cover salaries for all health workers in the district/municipal/city service including in health facilities and hospitals;
• Non-Wage Conditional Grants fund service delivery operations by health departments, government and private not-for-profit health centres and hospitals, for the purposes of prevention, promotion, treatment, supervision, management and epidemic preparedness; and
• Development Grants are provided under two sub-categories: a) Health Development Grants for upgrading HCIIs to HCIIIs in sub-counties, and for financing major repairs to health infrastructure, the equipping and completion of existing public health facilities, and capacity development activities; and b) ad-hoc Transitional Development Grants to fund hospital rehabilitation and other specified capital investments in selected local government areas (MoH 2018, 2021a).
In this way, the majority of public funding for health services comes from central government, primarily derived from taxation. However, as noted earlier, other primary sources are private/individual expenditure, development partners, and voluntary health insurance (MoH 2016b). Households (through their out-of-pocket expenses), private firms and non-profit organisations now account for 70% of total expenditure (WHO 2016; MoH 2018). Efforts by the health sector to introduce a national health insurance scheme have met with several challenges, including integration of actors in the informal sector, such as traditional birth attendants and herbalists. The official health care budget is largely focused on curative rather than preventive care, and remains heavily centralised, prioritising administration, specialist secondary care and purchase of medicines over critical primary care and preventive health promotion (Mijumbi-Deve et al. 2017).
Although decentralising health services was intended to provide efficient and effective public health care, studies show that the state of those services in Uganda falls far short of expectations in terms of accessibility, quality, affordability and availability to citizens (MoH 2015; UBOS 2017a). The burden of infectious diseases is increasing, with the most common causes of death being HIV/AIDS (17%), malaria (12%), lower respiratory infections (7%), tuberculosis (5%) and meningitis (4%). A rising prevalence of non-communicable diseases such as cardiovascular disease and cancer, which are estimated to account for more than a quarter (27%) of all deaths in Uganda, has also been documented (Mijumbi-Deve et al. 2017).
Research focus and methodology
This study was conducted in the three district local government areas of Arua, Yumbe and Maracha within the West Nile sub-region of Uganda. The sub-region lies to the west of the Albert Nile, bordering the Democratic Republic of Congo to the west and the Republic of South Sudan to the north. Currently, the sub-region comprises 11 districts surrounding Arua, the main town (see Figure 1), although this study was based on the previous configuration of 7 districts that applied at the time of the 2014 census (Arua, Nebbi, Zombo, Maracha, Adjumani, Moyo, Yumbe and Koboko) (UBOS 2015). Selection of the three case study areas was based on research convenience – principally easy accessibility by road transport as well as population size, given that such variations might have an influence on the nature of health service delivery. At the 2014 census, Arua district had a population of 782,077; Yumbe 484,822; and Maracha 186,134 (UBOS 2017b, 2017c, 2017d). The 2024 census is likely to reveal significant changes, given population growth and redistribution as well as the new district boundaries.
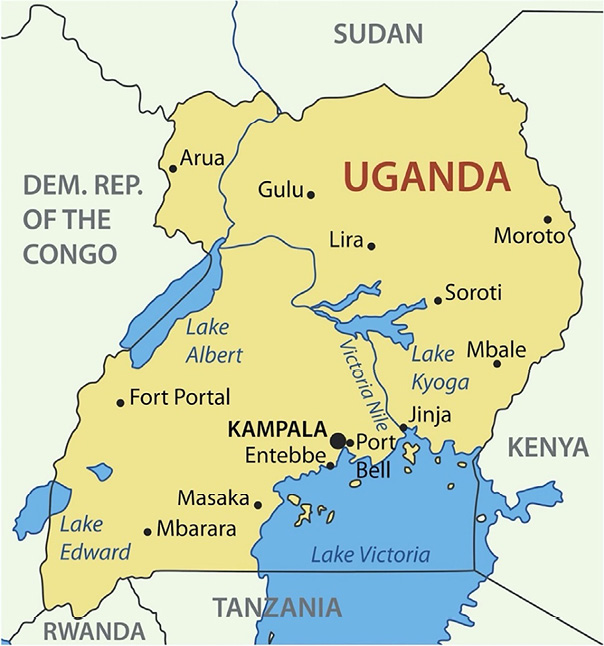
Figure 1. Map of Uganda showing Arua in the West Nile Sub-Region
Previous studies indicated that Arua, Yumbe and Maracha were among the most poorly performing districts in health service delivery, particularly at sub-county (HCII) and parish (HCIII) levels (Braun and Grote 2000; Jeppsson 2001, 2004; MoH 2015; UBOS 2018). Accessibility, availability, quality and affordability of health services were all deficient. The research sought to understand how funding availability and processes influence service delivery performance.
The study used a cross-sectional design with both qualitative and quantitative data collection and analysis, based on Neuman (2006) and Creswell (2009). Information was gathered through a questionnaire survey, interviews, focus group discussions (FGDs) and review of documents, primarily reports from ministries and local governments. The majority of both the field research and review of documents was completed in 2018.
Study participants comprised politicians from central and local government, technical staff from line ministries and districts, community health service users, health workers from facilities, representatives of health unit management committees (HUMCs) and village health teams (VHTs), and donor organisations (see Table 2). There were 210 people in these categories who could be reached. The sample size was then reduced to 136 people using stratified sampling, simple random sampling, purposive sampling and convenience sampling techniques. Stratified sampling entailed dividing the population into homogeneous sub-groups, such as health workers, VHTs and HUMCs, and then taking simple random samples from each sub-group, allowing the researcher to generate representation of the entire population (Sekaran 2003; Neuman 2006). This technique was employed to select representatives of both the overall population and also key sub-groups, a strategy to increase representativeness of the sample (Sekaran 2003; Neuman 2003).
A lottery method was used for simple random sampling from a list of central and local government politicians and technical staff, health workers, donor representatives, HUMCs and VHTs. Purposively selected respondents were chosen because they were thought to have necessary information for an in-depth investigation into local government financing. Due to their wide geographical dispersion, convenience sampling was used to select clients of health services in local communities.
Data was collected through interviews, researcher-administered questionnaires and FGDs. The questionnaires were administered to all respondents, but in addition some interviews were also carried out with the purposively sampled respondents. Focus groups targeted community representatives as well as members of HUMCs and VHTs. In total, 22 people participated in FGDs: 8 for Arua (4 clients of health services, 2 HUMCs, 2 VHTs); 7 for Yumbe (3 clients, 2 HUMCs, 2 VHTs); and 7 for Maracha (3 clients, 2 HUMCs, 2 VHTs).
The study registered 113 respondents (83% response rate) from the targeted 136 people. Of those 113 respondents, 68 (60.2%) were male and 45 (39.8%) female, with 60 (54%) holding a diploma or degree. Although less than ideal, this was considered to be a reasonably representative sample of the targeted population for the purposes of the research. The key issues and questions explored through the interviews, questionnaires and focus groups are shown in Table 7.
Findings and discussion
The primary goal of this study was to determine the adequacy of funding arrangements for PHCSD, using the three selected districts of Uganda’s West Nile sub-region as a case study. The study examined trends in financial allocations over an eight-year period, from 2010/2011 (fiscal year) to 2017/2018. The findings cover both sufficiency and timeliness of funding, as well as the perspectives of varied respondents on how the availability (or unavailability) of these funds affected service delivery.
Trends in government funding for the health sector
Table 3 shows fluctuations in total government funding (national and local) for the whole health sector, including primary and secondary care and hospitals, over the financial years 2010/2011 to 2018/2019.
| Year | Health budget (USh billion) | Annual growth | Total gov’t budget (USh billion) | Annual growth | Health as % of total government budget |
|---|---|---|---|---|---|
| 2010/11 | 660 | 7,377 | 8.9% | ||
| 2011/12 | 799 | 21% | 9,630 | 31% | 8.3% |
| 2012/13 | 829 | 4% | 10,711 | 11% | 7.7% |
| 2013/14 | 1,128 | 36% | 13,065 | 22% | 8.6% |
| 2014/15 | 1,281 | 14% | 14,986 | 15% | 8.5% |
| 2015/16 | 1,271 | -1% | 18,311 | 22% | 6.9% |
| 2016/17 | 1,827 | 44% | 20,431 | 12% | 8.9% |
| 2017/18 | 1,950 | 6.7% | 29,000 | 42% | 6.7% |
| 2018/19 | 2,373 | 18% | 32,700 | 13% | 7.2% |
Sources: MoFPED (2015a, 2016a) MoH (2021b)
While allocations for health rose in nominal terms from USh660 billion in FY 2010/2011 to USh2,373 billion in 2018/2019, this still amounted to only 7.2% of total national government spending – a lower proportion than in FY 2010/2011. These numbers point to significant under-funding of health. In most years increases in the total government budget did not translate into a similar increase for the health sector, and on average expenditure on health fell far short of the goal set by the 2001 Abuja Declaration, in which all African governments recommended that 15% of total spending be allocated to the health sector. Clearly, this deficiency in health financing will have had a significant effect on PHC-related activities.
In 2008/09 the Government of Uganda introduced ‘straight-through processing’, an automated method of electronic transfer to disburse PHC wage and non-wage funding to local governments (MoFPED 2014). Under this approach, MoFPED provided annual indicative planning figures for PHC non-wage activities to the MoH. The MoH released funds to district health facilities each quarter based on annual plans and budgets for PHC actions adopted by district local councils. Direct transfers to the respective health facilities greatly reduced the bureaucracy of handling funding allocations between the centre and districts, as well as between district councils and health centres.
However, regardless of straight-through processing, the health sector remained a secondary priority in national budget allocations. Among the government’s 18 key expenditure areas, health continued to rank below works and transport, interest payments, energy and mineral development, education and security.
During the January 2018 interviews this study conducted with officials from the Ministry of Local Government and the Local Government Finance Commission, respondents noted that although all districts (urban and rural) had requested that parliament increase annual budget allocations for local governments in order to improve various social services, including health, the requested increase was yet to be considered. Also, interviews with local government political and technical officials revealed that although the overall national budget had increased over recent years, funding to local governments annually had a downward trend which affected execution of health-related activities. A respondent from Local Government Finance Commission advised: “Under the national budget of FY 2018/2019, the 13% national budgetary allocation to local governments represents about USh3.4 trillion out of a USh29 trillion budget. Out of this, 64% was for wages and 20% for operations, leaving only 16% for development work in districts” (Interview, January 2018).
Allocations for PHC services in study districts
Tables 4 to 6 detail the PHC budgets in each of the three case-study districts over the financial years 2014/2015 to 2018/2019.2 Overall, the tables show only small increases in aggregate government allocations to the three districts in the period under study, albeit with significant changes from year to year in individual districts and categories. Much of the central government funding went into recurrent expenditure on wages, while development expenditure was largely financed by donors. Local revenues remained a negligible fraction of the local government health budgets, posing a high risk to predictability and sustainability in desired levels of service delivery.
Sources: MoFPED (2015b, 2018a)
| Funding category | 2014/15 | 2015/16 | 2017/18 | 2018/19 |
|---|---|---|---|---|
| Recurrent expenditure: Wages | 2,768,612 | 2,768,612 | 3,346,560 | 4,509,315 |
| Recurrent expenditure: Non-wage costs | 393,994 | 386,348 | 477,825 | 489,035 |
| Development expenditure: Domestic sources | 1,044,002 | 1,227,119 | 1,145,235 | 2,475,719 |
| Development expenditure: Donor | 1,343,768 | 1,721,220 | 1,780,000 | 5,770,100 |
| Total health expenditure | 5,550,375 | 6,103,299 | 6,749,620 | 13,244,170 |
| District local revenues | 516,024 | 516,524 | 663,992 | 663,993 |
| District total budget | 32,573,750 | 31,486,979 | 36,183,680 | 56,560,288 |
Sources: MoFPED (2015c)
| Funding category | 2015/16 | 2016/17 | 2017/18 | 2018/19 |
|---|---|---|---|---|
| Recurrent expenditure: Wages | 1,731,896 | 2,048,898 | 2,048,898 | 3,049,819 |
| Recurrent expenditure: Non-wage costs | 772,265 | 796,676 | 656,802 | 865,625 |
| Development expenditure: Domestic | 503,851 | 504,539 | 318,191 | 933,064 |
| Development expenditure: Donors | 1,027,555 | 554,985 | 480,167 | 130,205 |
| Total Health Expenditure | 4,035,567 | 3,905,098 | 3,504,058 | 4,978,712 |
| District local revenues | 285,062 | 255,062 | 215,062 | 215,062 |
| District total budget | 18,475,499 | 20,015,343 | 21,000,712 | 24,145,094 |
Sources: MoFPED (2016b, 2018b)
An official at the Arua district finance department observed that: “PHC funds allocated to districts have been stagnating annually, yet costs of medical drugs and supplies keep on increasing in market due to inflationary factors” (Interview, March 2018). The study established that on average HCIIs in Arua, Yumbe and Maracha districts received USh250,000 per month, while HCIIIs received USh350,000, for recurrent expenditure excluding wages. This amount was considered by the interviewed staff as inadequate for needed PHC services.
Adequacy and timeliness of funding
Table 7 presents the questionnaire results from each of the three study districts concerning both the adequacy and timeliness of government funding. A five-point Likert scale was used: Strongly Agree, Agree, Neutral, Disagree, Strongly Disagree. The table only provides scores for those types of response that were actually recorded.
| Arua district (%) | Maracha district (%) | Yumbe district (%) | |
|---|---|---|---|
| PHC funds allocated by central government are adequate | |||
| Strongly Disagree | 46.2 | 98.0 | 90.4 |
| Disagree | 13.0 | 2.0 | 6.0 |
| Strongly Agree | 30.8 | 0.0 | 3.6 |
| PHC funds allocated by district councils are adequate | |||
| Strongly Disagree | 76.9 | 91.8 | 93.3 |
| Disagree | 23.1 | 8.2 | 7.7 |
| Total funds allocated by central and local governments are adequate | |||
| Strongly Disagree | 53.8 | 83.7 | 94.0 |
| Disagree | 46.2 | 16.3 | 6.0 |
| There have been adequate increases in total PHC funding over the last 3 years | |||
| Strongly Disagree | 23.1 | 77.6 | 81.8 |
| Disagree | 30.8 | 20.4 | 18.2 |
| Agree | 23.1 | 0.0 | 0.0 |
| Strongly Agree | 23.1 | 0.0 | 0.0 |
| District PHC funding increased annually by central government | |||
| Strongly Disagree | 46.2 | 89.8 | 90.7 |
| Disagree | 53.9 | 10.2 | 9.3 |
| MoFPED/MoH take too long to disburse funds* | |||
| Strongly Disagree | 26.2 | 0.0 | 0.0 |
| Disagree | 20.1 | 0.0 | 0.0 |
| Not sure | 0.0 | 2.0 | 18.2 |
| Agree | 15.4 | 18.4 | 0.0 |
| Strongly Agree | 38.3 | 79.6 | 81.8 |
| Funds from local governments are disbursed promptly for PHC activities* | |||
| Strongly Disagree | 84.6 | 81.6 | 92.0 |
| Not sure | 0.0 | 2.1 | 1.8 |
| Agree | 15.4 | 16.3 | 6.2 |
*These questions referred to whether or not funds were provided on time at the beginning of each quarter.
On the perceptions of adequacy of government funding for PHC services, most respondents from all three districts disagreed with the statement that PHC funds from central government and district councils were adequate. This view was strongest in Yumbe and Maracha. In Arua, about 30% of respondents considered that central government funding was adequate, and nearly half agreed that recent increases in total funding had been sufficient. The reasons for the difference in responses from Arua compared to those from Yumbe and Maracha on the adequacy of PHC central government allocations could not be adequately explained by this study, making it an area of interest for future research. All respondents from all three districts shared the view that there were no annual increases of PHC funds from central government; however, about 46% of respondents from Arua believed that for the last three years the PHC funding had been adequate – a variation that also may require further study.
Overall, the questionnaire responses on the adequacy of funding are in agreement with the interview findings. One senior MoH official responded that: “PHC funds are not adequate throughout a financial year. For example, during FY 2015/16 out of a total of USh299.27 billion for PHC services to all districts, USh246 billion was for salaries and USh20.54 billion was for non-wage services” (Interview, August 2017). This statement about the national budget suggests that the overall budgetary provisions for non-wage components affected all districts across Uganda.
In relation to funding by district councils from their own revenues, a health worker from Arua had this to say: “District local governments cannot independently fund any of their health care services, as over 80% of their budgets are financed by central government and donors. Annual budget allocations for PHC services must be increased by central government and districts for quality PHC services” (Interview, July 2017).
A politician from Yumbe, however, had a slightly differing view that: “Yes, the allocations may be a bit low, but the problem at times is the accountability, the way money is spent which is not according to the planned priorities.” At a FGD in Maracha (January 2018), one participant echoed this concern, referring to donor funding to districts that “could impact on PHC services through direct budgetary support but poor accountability and diversion of funds in the government system needs to be checked through regular monitoring and support supervision”. These views place more emphasis on matters of accountability and supervision about proper utilisation funds than simply budgetary allocations.
Responses to the question on the timeliness of disbursement of funds from MoFPED and MoH indicated that there are delays in the release of funds to local governments. These delays involve funds not being released until the second or third month of a quarter, which incapacitates PHC activities. Again, there are differences between Arua and the other two districts. In Maracha and Yumbe, around 80% of the respondents strongly agreed that ministries take too long to disburse funds to local governments. In Arua, however, close to half of respondents disagreed.
During a FGD with clients of health services in Maracha district, one respondent voiced the opinion that: “Centrally controlled financing is challenging when allocations do not meet the need or when funding is delayed, because this prevents programmes being implemented according to plans made locally” (FGD, January 2018). Even though views differed and some respondents seemed unsure about timeliness of releases – perhaps because of the technical nature of financial management processes – it seemed clear that untimely disbursement of funds from the central government was generally seen as a cause of poor health service delivery.
On the timeliness of disbursement of non-wage PHC funds from district local governments to the health centres (whose salaries and wages are paid directly from central government), a large majority of respondents from all the three study districts strongly disagreed that funds are disbursed promptly, suggesting significant delays. This is consistent with the finding that central government deliberately delays disbursements, which affects the release of local government funds to health facilities, causing difficulties in implementation of PHC activities planned each quarter. As noted earlier, this problem is worsened by the fact that local governments in Uganda depend heavily on central government grants and donor support, rather than self-generated revenues.
A health worker from Maracha noted that: “Sometimes we receive the first quota funds during the time when we are supposed to get the second quota. This affects PHC services as some of the planned activities are delayed or postponed to another quarter in the year” (Interview, September 2017). In Yumbe district, participants in the FGD for clients of health services agreed that PHC services suffer because the timing of financial disbursements to health facilities is irregular (FGD, January 2018)
Impacts on PHC service delivery
Funding issues affected PHC service delivery in a number of ways, both at district level and in the health facilities. The FGD for clients of health services in both Arua and Yumbe noted that implementation of the decentralisation of health services was being constrained by inadequate PHC funds and delays in disbursements from central government. This has seriously affected purchase of medicines and supplies, with negative impacts on service delivery. For example, in FY 2016/17 delayed disbursements resulted in no back-up supplies of drugs from district health officers to health facilities and no stock in certain facilities. Another example was that construction of a staff house at Ajia HCIII could not be completed in FY 2016/17 as USh38.8 million was not disbursed by the end of that year.
Extending this argument, a health official interviewed in Arua district pointed out that central government only supplies about 30% of patients’ medicine needs at health units, meaning that the other 70% is met through private spending by individuals or their support organisations at licensed clinics, drug shops and pharmacies. This exposes people to enduring risks of access to affordable, quality PHC services.
According to an MoH official, Uganda has a very high degree of private health spending, amounting to 49% of the total, compared to 40% in Burundi, 37% in Kenya, 31% in Tanzania and 11% in Rwanda. According to this respondent, excessive private spending on health care reduces people’s ability and opportunities to buy other goods and services. The official echoed the suggestion made by some district politicians and technical staff that the government should look into additional funding strategies such as community health insurance schemes (CHIs). They drew a comparison with the way money is pooled within communities through Uganda’s Savings and Credit Cooperative Organisation, and also through social groupings of women, youth, clans, workmates and others that have been instrumental in supporting each other through ‘money-rounds’.3 The common view was that local governments could capitalise on such existing community efforts by integrating a funding component that would provide a safety net to help poor communities cover the costs of health care.
Conclusions and recommendations
The findings of this study point to limited availability of PHC funding in Uganda in terms of both total budgets and timeliness of disbursements, which ultimately affects the quality of service delivery. As noted, Uganda’s annual national budget for health falls well short of the standard proposed by the 2001 Abuja Declaration, which recommended that 15% of countries’ total national budget expenditure be allocated to the health sector.
The study found that the level and distribution of health funding in the three study districts within the West Nile sub-region are inadequate. Insufficient and delayed PHC funding causes major bottlenecks, affecting essential supplies and the entire system of service delivery. The population has been forced to rely excessively on private financing, which is not sustainable in poor rural economies.
In view of these findings, there is a need for deliberate action by both central government and district councils to increase the percentage of funding allocated in their annual budgets to the health sector, in line with the Abuja Declaration. The Parliament of Uganda should also consider prioritising an increase in total national budget allocations to local governments, thus enabling districts to improve related social services that contribute to health outcomes. Without a healthy population, other programmes that are of importance in local communities may not be effectively realised.
As indicated, PHC disbursements from central government should not only be increased but also paid on time, preferably in the first week of each quarter, and from the Ministry directly to the bank accounts of health facilities. This can be done by using the straight-through processing system for all funding, not just wages, which may enable more efficient and effective ways of PHC service delivery and positively impact health outcomes.
Since provision of free government health services remains problematic as a result of inadequate funding, and there is a need to alleviate the burden of private spending on health care, the government should introduce, support and encourage additional community financing, such as CHIs, and an expanded role for other community-based organisations that already fund forms of social support. Beside the advantages of providing a safety net to help poor communities cover the costs of health care services, CHIs are also a way of relieving pressure and excessive expectations on government funding, and create an alternative mechanism for resourcing the health care of Uganda’s ever-growing population. District and local community leaders (civil, political, religious and cultural) should be sensitised on the benefits that could accrue from this approach.
This study was limited to just a small part of Uganda, but health financing problems can be seen to affect the entire country. Broader comparative studies across multiple regions are needed to establish a more complete picture and inform health funding policies, regulatory frameworks and decisions at the national level. Also, trials of CHIs should be carried out to establish their viability and potential for widespread adoption.
Declaration of conflicting interest
The authors declared no potential conflicts of interest with respect to the research, authorship, and/or publication of this article.
Funding
The authors received no financial support for the research, authorship or publication of this article.
References
Acup, C., Bardosh, L.K., Picozzi, K., Waiswa, C. and Welburn, C.S. (2016) Factors influencing passive surveillance for T.b. rhodesiense human African trypanosomiasis in Uganda. Acta Trop, 165, 230–239. http://dx.doi.org/10.1016/j.actatropica.2016.05.009
Bossert, T., Bärnighausen, T., Bowser, D., Mitchell, A. and Gedik, G. (2007) Assessing financing, education, management and policy context for strategic planning of human resources for health. Available at: https://apps.who.int/iris/handle/10665/43780
Bradley, E.H., Pallas, S., Bashyal, C., Curry, L. and Berman, P. (2010) Developing strategies for improving health care service delivery: guide to concepts, determinants, measurement and intervention design. Health, Nutrition and Population (HNP) Discussion Paper 59885 of the World Bank’s Human Development Network. Washington, DC: HDN.
Braun, J.V., Grote, U. (2000) Does decentralisation serve the poor? [Paper Presentation]. IMF Conference on Fiscal Decentralization. Sponsored by the IMF Fiscal Affairs Department (FAD), 20–21 November 2000. IMF Headquarters, Washington, DC.
Creswell, J.W. (2009) Research design – quantitative, qualitative, and mixed methods approaches. (3rd edn) London: Sage Publications, Inc.
de Savigny, D., Taghreed, A. and Sangeeta, M. (2009) Systems thinking for health systems strengthening. 10.13140/RG.2.1.4720.4325.
Drechsler, D. and Jutting, J. (2007) Different countries, different needs: the role of private health insurance in developing countries. Journal of Health Politics, Policy and Law, 32 (3), 497–534. https://doi.org/10.1215/03616878-2007-012
Gasto, F., Nyamhanga, T., Mughwira Mwangu, M. and Hurtig A. (2013) Challenges to the implementation of health sector decentralization in Tanzania: experiences from Kongwa District Council. Dar es Salam, Tanzania: Department of Development Studies, School of Public Health and Social Sciences, Muhimbili University, BMC Medical Services Research.
Guimaraes, L., Navarro, S. and Lievens, T. (2012) Health financing trends in Sub-Saharan Africa. Oxford: Oxford Policy Management.
Jeppsson, A. (2001) Financial priorities under decentralization in Uganda. Health Policy And Planning, 16 (2), 187–192. https://doi.org/10.1093/heapol/16.2.187
Jeppsson, A. (2004) Decentralization and national health policy implementation in Uganda – a problematic process. PhD Thesis, Department of Community Medicine, Malmö University Hospital.
Lochoro, P., Giusti, D., Odaga, J. and Maniple, E. (2004) Pro-poor health services: the Catholic health network in Uganda. Development Outreach, 6 (1), 18–21.
Loevinsohn, B. (2008) Performance-based contracting for health services in developing countries: A toolkit. Health Nutrition and Population Series. Washington, DC: World Bank. https://doi.org/10.1596/978-0-8213-7536-5
Mijumbi-Deve, R., Kawooya, I., Nankya, E. and Sewankambo, N. (2017) Primary health care systems. (PRIMASYS). Case study from Uganda. Geneva: World Health Organization.
Ministry of Finance, Planning and Economic Development (MoFPED) (2011) Annual finance, planning and economic development sector report, 2010/2011. Kampala: Ministry of Finance, Planning and Economic Development, Government of Uganda.
Ministry of Finance, Planning and Economic Development (MoFPED) (2014) Guidelines and procedures for decentralised salary payment processing. Kampala: The Republic of Uganda.
Ministry of Finance, Planning and Economic Development (MoFPED) (2015a) National budget framework paper, FY 2016/17–FY 2020/21. Kampala: The Republic of Uganda.
Ministry of Finance, Planning and Economic Development (MoFPED) (2015b) Local government performance contract form, FY 2015/16. Vote: 503, Arua District. Available at: https://budget.finance.go.ug/sites/default/files/Indivisual%20LG%20Budgets/Arua%20Final%20Form%20B.pdf
Ministry of Finance, Planning and Economic Development (MoFPED) (2015c) Local government budget framework paper FY2015/16, Yumbe District. Available at: https://budget.finance.go.ug/content/local-government-budget-framework-papers-158
Ministry of Finance, Planning and Economic Development (MoFPED) (2016a) National budget framework paper, FY 2017/18 – FY 2021/22. Kampala: The Republic of Uganda.
Ministry of Finance, Planning and Economic Development (MoFPED) (2016b) Local government budget estimates, Maracha District 2016/17. Available at: https://budget.finance.go.ug/node/8007
Ministry of Finance, Planning and Economic Development (MoFPED) (2018a) LG budget framework paper 2018/2019. Available at: https://budget.finance.go.ug/sites/default/files/Indivisual%20LG%20Budgets/2018-2019_VoteBFP_503_Arua%20District_3_11_20185_20_32PM.pdf
Ministry of Finance, Planning and Economic Development (MoFPED) (2018b) LG workplan, Maracha District. Available at: https://budget.finance.go.ug/sites/default/files/Indivisual%20LG%20Budgets/2018-2019_ApprovedWorkplanReport_577_Maracha%20District_7_29_20183_11_40PM.pdf
Ministry of Health (MoH) (2003) Annual health sector performance report 2002/2003. Kampala: Ministry of Health, Government of Uganda.
Ministry of Health (MoH) (2010) National health sector strategic plan III 2010/11–2014/15. Kampala: Ministry of Health, Government of Uganda.
Ministry of Health (MoH) (2013) Guidelines for governance and management structures. Kampala: Government of Uganda.
Ministry of Health (MoH) (2015) Annual health sector performance report, 2014/2015. Kampala: Ministry of Health, Government of Uganda.
Ministry of Health (MoH) (2016a) Annual health sector performance report, 2015/2016. Kampala: Ministry of Health, Government of Uganda.
Ministry of Health (MoH) (2016b) Health financing strategy 2015/16–2024/25: a health financing system that responds to the dynamic aspirations of the health sector in Uganda. Kampala: Republic of Uganda.
Ministry of Health (MoH) (2018) Sector grants and budget guidelines to local governments, FY 2019/20. Kampala: Republic of Uganda.
Ministry of Health (MoH) (2021a) Health sub programme grant, budget and implementation guidelines for local governments. FY 2021/22. Kampala: Republic of Uganda.
Ministry of Health (MoH) (2021b) Ministry of Health annual health sector performance report FY 2020/21. Kampala: Republic of Uganda.
Navarro, L.G.S. and Lievens, T. (2012) Health financing: trends in sub-Saharan Africa. Oxford: Oxford Policy Management Limited
Neuman, W.L. (2003) Social research methods: qualitative and quantitative approaches. (5th edn). Boston: Ally and Bacon, Pearson.
Neuman, W.L. (2006) Social research methods: qualitative and quantitative approaches. (6th edn). Boston: Ally and Bacon, Pearson.
Preker, A. and Carrin, G. (2004) Health financing for poor people. Washington, DC: World Bank.
Roberts, M.J., Hsiao,W., Berman, P. and Reich, M.R. (2003) Getting health reform right: a guide to improving performance and equity. Oxford: Oxford University Press.
Sekaran, U. (2003) Research methods for business: a skill-building approach. (4th edn). New York: John Wiley & Sons.
Ssengooba, F., Kiwanuka, S.N., Rutebemberwa, E. and Ekirapa-Kiracho, E. (2017) Universal health coverage in Uganda: looking back and forward to speed up the progress. Kampala: Makerere University, Uganda.
Uganda Bureau of Statistics (UBOS) (2011) Uganda demographic and health survey. Uganda: UBOS and Maryland: ICF International.
Uganda Bureau of Statistics (UBOS) (2013) Key economic indicators. Kampala: Government of Uganda.
Uganda Bureau of Statistics (UBOS) (2015) 2015 statistical abstract. Kampala: Government of Uganda.
Uganda Bureau of Statistics (UBOS) (2017a) Health status and associated factors: thematic series – based on the National Population and Housing Census, 2014. Kampala: Government of Uganda.
Uganda Bureau of Statistics (UBOS) (2017b) The national population and housing census 2014 – area specific profile series, Arua District. Kampala: Government of Uganda.
Uganda Bureau of Statistics (UBOS) (2017c) The national population and housing census 2014 – area- specific profile series, Yumbe District. Kampala: Government of Uganda.
Uganda Bureau of Statistics (UBOS) (2017d) The national population and housing census 2014 – area specific profile series, Maracha District. Kampala, Uganda: UBOS.
Uganda Bureau of Statistics (UBOS) (2018) Uganda demographic and health survey 2016. Uganda: UBOS and Maryland, USA: ICF.
Wagstaff, A., Dmytraczenko, T., Almeida, G., Buisman, L., Hoang-Vu Eozenou, P., Bredenkamp, C., Cercone, J.A., Diaz, Y., Maceira, D., Molina, S., Paraje, G., Ruiz, F., Sarti, F., Scott, J., Valdivia, M. and Werneck, H. (2015) Assessing Latin America’s progress toward achieving universal health coverage. Health Affairs, 34 (10), 1704–1712. https://doi.org/10.1377/hlthaff.2014.1453
World Health Organization (WHO) (2000) World health report 2000. Health systems: improving performance. Geneva: World Health Organization
World Health Organization (WHO) (2008) Primary health care: now more than ever. Geneva: World Health Organization.
World Health Organization (WHO) (2012) The world health report 2010. Health systems financing: the path to universal coverage. Geneva: World Health Organization.
World Health Organization (WHO) ( (2016) World health statistics: monitoring health for the Sustainable Development Goals. Geneva: World Health Organization.
Appendix: Acronyms
CHIs Community Health Insurance schemes
FGD Focus group discussions
HUMC Health Unit Management Committee
MoFPED Ministry of Finance, Planning and Economic Development
MoH Ministry of Health
PHC Primary Health Care
PHCSD Primary Health Care Service Delivery
SDG Sustainable Development Goals
UBOS Uganda Bureau of Statistics
VHTs Village Health Teams
WHO World Health Organization
1 See Appendix 1 for a list of all acronyms used in this paper.
2 The Arua and Yumbe budget reports for 2016/17 were in a different format which made it hard to extract and standardise data. For Maracha, the budget information for 2014/15 was missing. Those years were thus excluded from the analysis.
3 ‘Money-rounds’ is a term used in this study to refer to money circles that different community associations use to support individual members. There is usually a saving cycle of a specific period, eg a week, two weeks or a month, after which a lottery is held and one or more members receive the collected money for a personal project. The cycle goes on until all members have benefited, after which a new round begins.