Commonwealth Journal of Local Governance, Issue 22, 2019
ISSN 1836-0394 | Published by UTS ePRESS | https://epress.lib.uts.edu.au/journals/index.php/cjlg
RESEARCH AND EVALUATION (PEER REVIEWED)
Not quite what’s on paper? Comparison between theoretical and actual information-sharing networks in the Ugandan rural water service sector

Sara Dewachter
Institute of Development Policy
University of Antwerp
Lange St. Annastraat 7, 2000 Antwerp Belgium
Email: sara.dewachter@uantwerpen.be

Patricia Bamanyaki
International Institute of Tropical Agriculture
Plot 15B, East Naguru Road, Kampala Uganda
Email: p.bamanyaki@cgiar.org

Nathalie Holvoet
Institute of Development Policy
University of Antwerp
Lange Sint-Annastraat 7, 2000 Antwerp Belgium
Email: nathalie.holvoet@uantwerpen.be
DOI: https://doi.org/10.5130/cjlg.vi22.7021
Article History: Received 23/12/17; Accepted 29/03/19; Published 16/01/20
Citation: Dewachter, S., Bamanyaki, P., Holvoet, N. 2020. Not quite what’s on paper? Comparison between theoretical and actual information-sharing networks in the Ugandan rural water service sector. Commonwealth Journal of Local Governance 2019, 22:7021, https://doi.org/10.5130/cjlg.vi22.7021
© 2020 by the author(s). This is an Open Access article distributed under the terms of the Creative Commons Attribution 4.0 International (CC BY 4.0) License (https://creativecommons.org/licenses/by/4.0/), allowing third parties to copy and redistribute the material in any medium or format and to remix, transform, and build upon the material for any purpose, even commercially, provided the original work is properly cited and states its license. Declaration of conflicting interest The authors declared no potential conflicts of interest with respect to the research, authorship, and/or publication of this article. Funding This work was supported by the Flemish Research Fund (FWO) [grant number G050613N].
Abstract
Under Uganda’s decentralised system, rural water service delivery remains to some extent problematic. Several studies attribute the possible causes of deficiencies in the water sector to governance issues. This article applies social network analysis to map upward and downward water-related information flows between the actors of local government from village to district level. Comparing the actual information-sharing network with what’s on paper reveals a less reciprocal and more centralised network than that theoretically envisaged. Some actors, such as the district water officer, are more central than expected in terms of sending and receiving information, while others seem to underperform. Our findings show, however, that it is not the political–administrative information exchange which is the biggest obstacle, but rather information flows between higher (district and sub-county) and lower (parish and village) levels of the local governance structure. Adding water users to the analysis reveals the village chairperson as the most crucial broker of information upward to duty bearers at district level. The limited role of water user committees also becomes apparent. The authors conclude that information communication technology holds potential to overcome some of the bottlenecks (eg distance) hindering the flow of water-related information between actors at different levels.
Introduction
Extensive literature (eg Chowns 2015; Naiga et al. 2015) affirms that water provision among many rural communities in sub-Saharan Africa is typically problematic. Widely cited problems include multiple water delivery approaches employed by numerous actors, which are often uncoordinated and unsuited to local conditions; inadequate monitoring of water sources by state actors due to resource constraints and logistical difficulties; little sense of ownership among communities of water projects and infrastructure; weak voluntarism among community-based water user communities; and non-functionality of hand pumps (Golooba-Mutebi 2012; Van den Broek and Brown 2015; Naiga et al. 2015). During the 1990s, the ‘top-down state-led’ approach to rural water provision was widely criticised for having ignored and failed communities (Van den Broek and Brown 2015, p. 51). Decentralisation of service delivery to lower levels of government was advanced as an effective strategy, with the argument that it would stimulate community participation in the identification and implementation of sustainable solutions to water-related crises (Golooba-Mutebi 2012). As a result, since the 1990s water delivery approaches based on the community-based management (CBM) model have gained popularity across the continent, including Uganda, the focus of this study.
Blueprints of structures and systems exist to guide the planning, implementation, monitoring and evaluation of water service provision. The flow of information between diverse actors at different levels of local government, as well as capacities for inspection, supervision and accountability enforcement, have been noted as crucial factors for effective rural water service delivery (Golooba-Mutebi 2012). Under decentralisation, however, deficiencies in Uganda’s rural water service provision persist. While several authors (Harvey 2007; Jones 2011; Quin et al. 2011; Le Gouais and Wach 2013) attribute the deficiencies to weak implementation of CBM models, others (Blaikie 2006; Brown 2013; Van den Broek and Brown 2015) have critiqued the viability of the models themselves in delivering sustainable solutions to rural communities.
Building on previous studies which have showcased the importance of information flows between different actors for a smooth functioning of decentralised service delivery (see eg Andersson 2004; Ringold et al. 2012), the present study examines in detail different information streams. The authors examine both horizontal and vertical information exchange, as both are considered important for nurturing trust among different actors in a system and for stimulating service delivery effectiveness, efficiency and accountability (Andersson 2004; Ringold et al. 2012). Horizontal information exchange, between actors that are positioned at similar levels, triggers learning about opportunities to combine resources and solve common problems (Andersson 2004). As regards vertical information exchange, a distinction is usually made between top-down (downward) and bottom-up (upward) flows.
While the former inform lower-level actors in the chain about policies, guidelines and plans that need to be implemented locally, the latter provide useful information to higher-level actors about local-level problems, needs and priorities. Ideally, the two are interconnected, with higher-level actors providing feedback on local-level information as well as sharing information about analyses done at a higher level (for example regarding water quality). In particular, in the CBM model, where water users are an integral part of the model, upward and downward information streams which include both citizens and water user committees are considered a necessary (although not sufficient) condition for addressing poor service delivery (see eg Nicol and Odinga 2016; Björkman and Svensson 2009; Honkalaskar et al. 2014).
This study starts by analysing the existing reporting channels stipulated in official Ugandan water-related documents (see Government of Uganda 1997b; Ministry of Water, Lands and Environment 1999, 2003; Ministry of Water and Environment 2011, 2013), as well as previous studies (eg Quin et al. 2011) which have outlined the theoretical reporting and information-sharing networks among government actors involved in rural water service delivery. It then compares what exists on paper with actual information-sharing within one local government area of Uganda. In line with CBM literature, it also moves beyond government actors to include information exchange with citizens.
The authors deviate from earlier related studies – which have mainly relied upon narrative approaches (see eg Golooba-Mutebi 2012; Van den Broek and Brown 2015) – by using social network analysis (SNA). SNA is a technique which allows users to systematically study patterns of relationships among actors and entities, including those based on information exchange. In doing so, both the structural network features (eg the degree to which all actors share information with each other) and individual positions in a network (eg which actors, if any, receive more information than others) are analysed using formal network measures and graphical depiction. The present study uses SNA to compare the theoretical reporting and information-sharing networks (as stipulated in the official water-related documents as well as previous studies) with actual information networks, by mapping them based on a network survey of the actors involved. The study compares overall network structures, ascertains who the central actors are, and identifies missing links and bottlenecks. It also assesses whether assumptions made about information flows at individual and network level are valid.
The rest of this paper is structured as follows: section two gives an overview of the current situation in Uganda; section three describes the research setting and methodology applied; section four presents and discusses the study’s results; and section five offers conclusions and some recommendations.
Water service delivery in Uganda
The wave of democratic reform across many African countries during the 1990s brought with it devolution of power from central to local governments. In Uganda, decentralisation was introduced by the National Resistance Movement government in the aftermath of political strife, with the aim of improving local democracy, accountability, efficiency, effectiveness and sustainability of service delivery. The devolution of power to local governments in Uganda occurred in successive stages, starting with its enshrinement in the Local Governments (Resistance Councils) Statute 1993, followed by the Constitution of Uganda 1995, and subsequently the Local Governments Act 1997 and its revision in 2000 (Azfar and Livingstone 2002; Steiner 2006).
In accordance with the Local Governments Act 1997, Uganda has a five-tier decentralised structure, with the tiers being Local Councils (LCs), I, II, III, IV and V. At the most local level are villages (LC I), followed by parishes (LC II), then sub-counties (LC III), counties (LC IV), and finally districts (LC V). The Local Governments Act 1997 mandates the district, as the highest level of local government, to provide basic services, including water, to communities under its jurisdiction. Service delivery is the direct mandate of the district and sub-counties, while other tiers in the structure (counties, parishes and villages) play a supporting role (Golooba-Mutebi 2012). Rural water service provision in theory follows the CBM approach and is guided by legal and policy documents which include the Water Act 1997, the National Water Policy (NWP) 1999, the Rural Water Supply and Sanitation Strategic and Investment Plan 2000-2015, the National Framework for Operation and Maintenance of Rural Water Supplies 2011 and the Revised District Implementation Manual 2013.
The NWP underscores an integrated approach to service delivery involving multiple stakeholders: local government departments, the private sector (NGOs and private contractors), and water users led by water user committees (WUCs). A demand–response approach is followed which places responsibility for ownership and management of water point facilities with water users, who “demand a water service, decide the technology, contribute towards the construction, voluntarily manage the water source and pay for its upkeep” (Van den Broek and Brown 2015, p. 51). The district, for its part, provides maintenance and follow-up support (Brown 2013). It is worth noting at the outset that the success of such demand–response approaches is often premised on the existence of strong upward and downward information and communication flows between actors (see eg Tumushabe et al. 2011).
In line with this approach, Uganda’s Rural Water Supply and Sanitation Strategic and Investment Plan 2000–2015 specifies key strategies to ensure effective service delivery, including information-sharing and awareness-raising, coordination and collaboration between major actors, private sector participation, and monitoring and reporting (Ministry of Water, Lands and Environment 2003). These guidelines notwithstanding, studies in Uganda have revealed problems in rural water service delivery, notably unsatisfactory supervision and monitoring by the district administration, non-functional WUCs, and poor-quality water facilities delivered by unsupervised private contractors (Golooba-Mutebi 2012). This study unpacks the information-sharing networks among actors in a bid to determine their influence on the effectiveness of service delivery.
Research design and methodology
Point water source technologies in rural Uganda include “deep and shallow wells fitted with hand pumps, protected springs, public taps from gravity-flow schemes and rainwater harvesting tanks” (Mugumya 2013, p. 10). Several studies (Forster 2013; Mugumya 2013; Naiga et al. 2015) note that rural communities across Uganda with these point water technologies typically face similar challenges. Given the generally problematic nature of rural water service delivery, this study opted for a ‘most likely’ case study design (Yin 2009), on the assumption that any challenges identified in the relatively better-performing districts are likely to also occur in worse-performing districts. Bushenyi District in south-west Uganda was therefore purposively chosen as a case study, since it performs better than the national average in terms of rural population access to safe water (93% compared to 68%) and the functionality of its point water sources (90% compared to 84%) (Ministry of Water & Environment 2017). One village in a rural sub-county of Bushenyi District1 was selected to permit a detailed examination of information-sharing networks across the governance levels, from water users to the district office. Since data collection for full network analysis entails surveying all inhabitants in the village, the study village (due to time and budget constraints) had to be a relatively small village. Furthermore, the village was selected as a ‘typical’ small rural village within the Bushenyi district, using criteria such as being some distance from the main road, and without a ward office, and having a socio-economic profile (eg educational level) comparable to other villages in Bushenyi. Ninety-five percent of the population of the sub-county have access to safe water; and 92% of point water facilities in the sub-county are functional. Specific challenges relating to water supply in the village, according to inhabitants, are low water quality (61.6%) and water points being located far away from households (15.1%).
The information used in this study was obtained from multiple sources. A first approach was desk reviews of national legal and policy documents, as well as of relevant academic literature. Other sources were key informant interviews held with 21 duty bearers (politicians and technocrats) linked to the village, and a focus group discussion with local leaders in the village. The focus group discussion informed a participatory mapping of all the point water sources in use according to quality, access and functionality, which allowed a deeper appreciation of water-related issues affecting the village. The chains of communication for voicing demands and reporting, as perceived by citizens, were also discussed, which facilitated the identification of missing links.
Lastly, a survey was conducted of 92 water users aged 25 years and above residing in the selected village. This population can be assumed to be able to be ‘politically active’ (not in the narrow partisan sense of the word, but rather in the sense of being potentially able to vote, voice concerns to duty bearers, to get involved in citizen action, to make their own decisions independently). With regard to the duty bearers, all duty bearers were interviewed irrespective of their age. Both the user survey and the interviews with duty bearers collected data on individual characteristics, perceptions of water services, and social network ties relevant to water-related information exchange. The data collected was analysed using SPSS software and UCINET (a specialist SNA package). To aid readability, concepts and measures used in the SNA are explained in more detail in the following section. To validate the study’s findings, the (anonymised) results were presented to key stakeholders – both political and technical duty bearers at district level, and in a village meeting involving the village authority and water users (committees) – and any comments incorporated.
The paper’s analysis is structured in two steps. First, it focuses on the information-sharing network which exists among government actors (political and administrative) only. Next, it expands beyond government actors to include WUCs, NGOs and citizens (water users). For each network, the analysis highlights the most central actors in terms of sending and receiving information, analyses inter- and intra-group information exchange, and identifies some of the missing or underdeveloped links.
Information sharing networks amongst government (supply side) actors
First, the study sought to establish the extent to which the actual information-sharing network for this group resembles the theoretical network envisaged by the national blueprint. It used the guidelines in the Local Governments Act 1997 and the National Framework for Operation and Maintenance of Rural Water Supplies in Uganda 2011 to construct a theoretical information-sharing network. However, the construction was adapted to focus on structures from village level up to district level, and specifically on those actors with an active role to play in rural water service provision.
Constructing the theoretical information-sharing networks
The theoretical framework (see Figure 1) maps the official hierarchical ‘reporting chain’ (thin arrows), and the indirect sharing of information between political leaders and technical/administrative officials (thick arrows), along the hierarchy of local government. It should be noted that Figure 1 represents a very basic and highly hierarchical structure, which one should expect to find as a minimum in the actual information-sharing. While the framework in Figure 1 merely maps reporting structures that consist of a one-way upward communication stream, an organisational framework for the delivery of rural services in Uganda, elaborated by Quin et al. (2011), additionally incorporates the roles and responsibilities of the various actors.
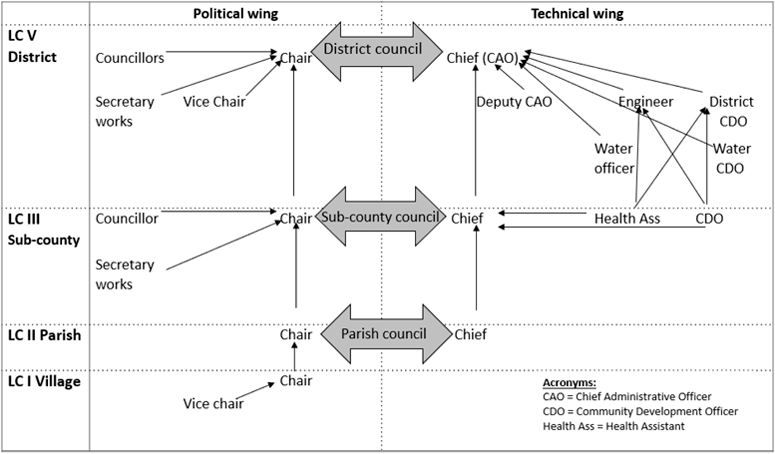
Figure 1 Reporting chain (minimal information-sharing network)
Source: Compiled by authors after Kuppens based on Government of Uganda (1997a) and Ministry of Water and Environment (2011)2
Based on the preceding two frameworks, the authors applied SNA to construct social network models of a minimal theoretical network (theoretical ‘reporting’) and a more substantial theoretical network that also includes the data from Quin et al. (2011) (theoretical ‘information-sharing’). Figures 2a and 2b below schematically depict the social network graphs of the theoretical ‘reporting’ and theoretical ‘information-sharing’ networks respectively.
To facilitate comparison between the two theoretical networks and the actual information-sharing networks, which will be discussed in more detail in the next section, Figure 2c depicts the social network model for actual information-sharing found in this case. The red colour denotes political duty bearers, while blue denotes technical/administrative duty bearers. An information-sharing tie is depicted by an arrow. HA stands for Health Assistant, CDO stands for Community Development Officer and CAO stands for Chief Administrative Officer.
Figures 2a-c Comparison of theoretical networks with actual information-sharing networks

Figure 2a Theoretical ‘reporting’ network
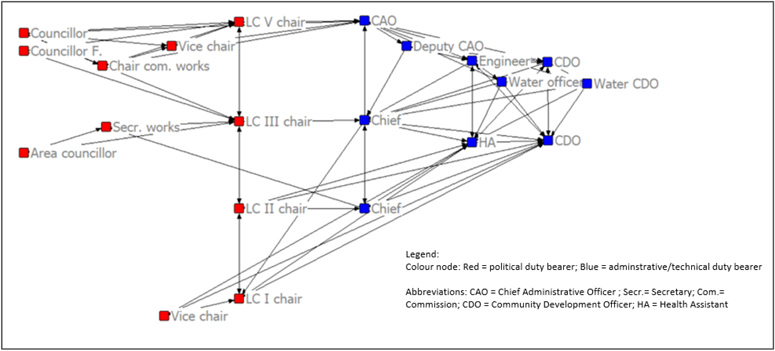
Figure 2b Theoretical ‘information-sharing’ network
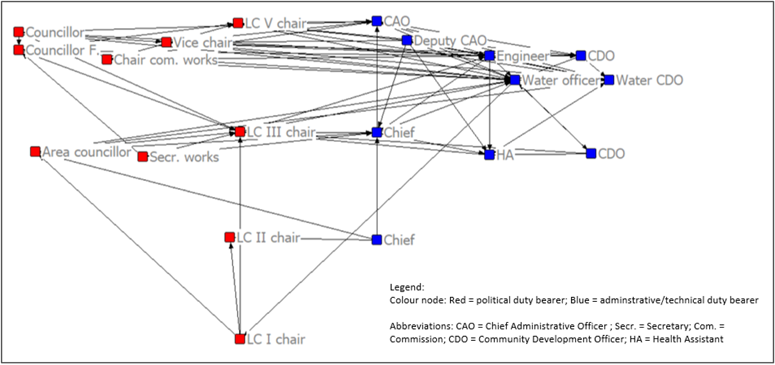
Figure 2c Actual information-sharing network
Comparing the theoretical and the actual information-sharing networks
Based on the social network graphics and analysis, it is possible to compare some of the basic descriptive measures of the actual information-sharing network (Figure 2c) to the two theoretical networks (Figures 2a and 2b), examining whether significant differences exist between the official reporting/information-sharing and the actual information-sharing network. Table 1 lists and compares the ties and actors, the overall cohesiveness and intensity of information exchange (average degree,3 density4 and number of isolates), centralisation5 and width (average distance) and reciprocity across the three networks.
Table 1 shows that whereas the hierarchical ‘reporting’ network has only 29 reported ties for a total of 21 official actors, the actual information-sharing network has 82 ties with a total of 20 actors.6 The network density, measured by the ratio of actual ties to possible ties, is often used in SNA as a measure to express the overall cohesiveness of a network. The density of the actual information-sharing network is 0.216, indicating that 21.6% of all possible information-sharing ties among the supply-side actors in government are active. This density is relatively similar to the theoretical information-sharing network at 0.231 or 23.1% of possible ties. In contrast, the hierarchical ‘reporting’ network has a density of just 0.069 or 6.9% of possible ties, indicating that in reality more information exchange takes place amongst officials than is strictly called for by the guidelines. Correspondingly, the average degree results show that government actors share information with an estimated 4.10 actors compared to the 1.38 actors envisaged under the minimal theoretical reporting network. This leads us to conclude that, on average, more information is actually being exchanged among government actors than reporting chains would minimally require, and this information-sharing is only slightly less than is envisaged in the theoretical information-sharing network (average degree = 4.69). However, the arc reciprocity ratio, which measures what proportion of the ties that exist are reciprocated, indicates that the actual information sharing network is far less reciprocal (arc reciprocity ratio = 0.341) than the theoretical information sharing network (arc reciprocity ratio = 0.742).
Table 1 also shows zero isolates across the three social network models, implying that none of the actors in any of the three models is completely disconnected from the rest of the actors in the network. SNA also enables us to gauge the distance that information has to ‘travel’ to reach actors in the network. The average distance between two actors is 2.037 ties, implying that, on average, one government actor can reach another government actor with only two steps. The official reporting chain is even slightly more efficient in facilitating short distances for information to travel (1.85 steps).
The degree centralisation index, on the other hand, reveals whether information-sharing is concentrated among a few central nodes, or whether it is equally spread throughout the entire network. The overall degree centralisation index is 0.287, indicating a modest level degree of centralisation in the sharing of information. Interestingly, however, incoming ties (receiving information) are more centralised (0.438) than outgoing ties (sending information) at 0.271. The latter results imply that a relatively small group of supply-side actors receive most of the information that is sent through the network. In contrast, the official ‘reporting’ network reveals a much lower overall degree centralisation index of 0.089, indicating that information-sharing is meant to be far less centralised than it is in reality.
There are several measures (Pearson correlation coefficient, Jaccard index, simple matching coefficient) that can be used to check the association between two network ties. Considering that all the network ties7 in this study are binary ties, the authors used the simple matching coefficient measure, which records the degree of matching between the official reporting ties and information-sharing ties between the same actors (Hanneman and Riddle 2005). The Jaccard index is specifically designed for sparse networks, as it only calculates the number of times that both actors report a tie to the same third actor as a percentage of the total number of ties reported. Both the Jaccard index (Jaccard = 0.146, p = 0.002)8 and the matching coefficient (matching coefficient = 0.78, p = 0.002) flag a significant positive association between the actual information-sharing network and the theoretical ‘reporting’ network. Similarly, a positive and significant association was found between the actual and the theoretical information-sharing networks (matching coefficient = 0.724, p = 0.000 and Jaccard index = 0.250, p = 0.000).
Identifying key actors
Using centrality measures, the paper identifies the ‘key’ actors in the information-sharing network. There are different types of centrality indices, which capture different aspects of what it means to be ‘central’ in a network. The degree centrality measure only takes into account the number of ties directly adjacent to the node, but it does differentiate between incoming ties (indegree centrality) and outgoing ties (outdegree centrality). Since degree centrality is a ‘localised’ manner of measuring an individual’s influential position in a network – because it only takes into account the persons that one is directly connected to (see eg Ward et al. 2011) – the authors also chose to compute ‘closeness’ centrality and ‘betweenness centrality’. Closeness centrality reflects the length of the shortest paths between an actor and each of the other actors in the network. Consequently, a lower number indicates that the actor is more central in the network. Closeness centrality therefore indicates who is best placed to efficiently disseminate or collect information from the whole network. The authors further distinguish between ‘incloseness’ and ‘outcloseness’ centrality to take into account the difference between incoming and outgoing ties. Betweenness centrality, on the other hand, quantifies the extent to which a node is positioned on the geodesic path between any given pair of individuals within the whole network (Freeman 1979). Hence, betweenness centrality captures to what extent an individual has strategic power within the network by being on the shortest information route between two individuals.
Table 2 lists the scores for all actors on the different centrality measures. Incoming (indegree and incloseness) and outgoing (outdegree and outcloseness) are grouped together, alongside the betweenness centrality measures. The table differentiates between the two theoretical networks: the official reporting network and the information-sharing network on the one hand, and the actual (empirical) information-sharing network on the other hand. One key finding is that the most central actor in the actual network – the DWO – is the same for all centrality types. The top rank occupied by the DWO is somewhat unexpected. Based on the theoretical framework (both official reporting and information-sharing), the chief administrative officer (CAO) would have been expected to occupy the highest rank (indegree centrality). Also, the DWO is under the supervision of the district engineer; yet in the actual information network, the DWO is the most influential actor. In terms of sending information to other actors (outdegree and outcloseness centrality), receiving information from other actors (indegree and incloseness centrality) and controlling information pathways (betweenness centrality), the DWO has the top score.
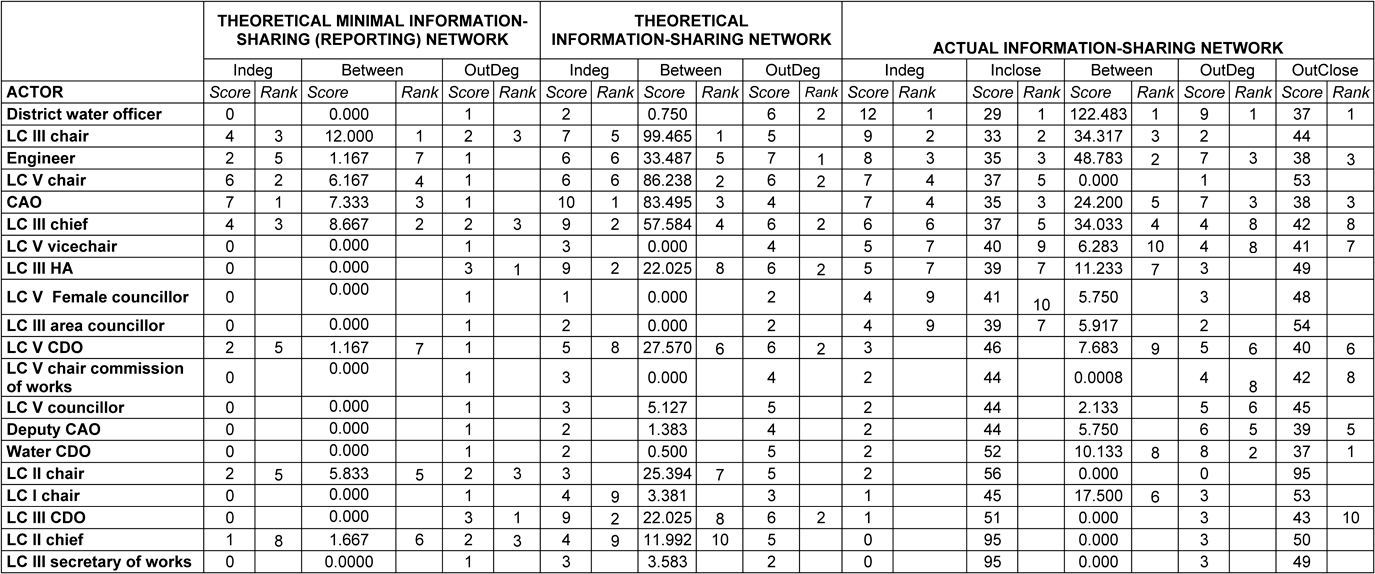
Moreover, in Table 2 a quite substantial difference exists in scores for indegree and betweenness centrality between the DWO and other supply-side actors. In terms of receiving information, the other top five influential actors include the sub-county chairperson, district chairperson, district engineer and CAO. The community development officer (CDO) and deputy CAO are also among the top five influential actors with regard to sending information. Relatively more peripheral than might be expected, based on the theoretical information-sharing networks, are the sub-county extension workers (sub-county CDO and health assistant) and the sub-county chief, who score low in terms of actually sharing information. Similarly, the parish-level actors (LC II chairperson and parish chief) score low in both sending and receiving information, compared to what would have been expected.
In Figures 3a-c, indegree centrality is graphically depicted by the size of nodes. Bigger nodes indicate that the actor receives more information from other duty bearers.
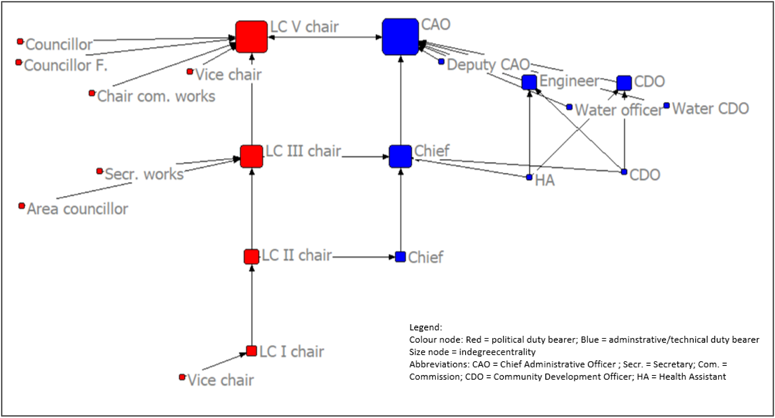
Figure 3a Theoretical ‘reporting’ network
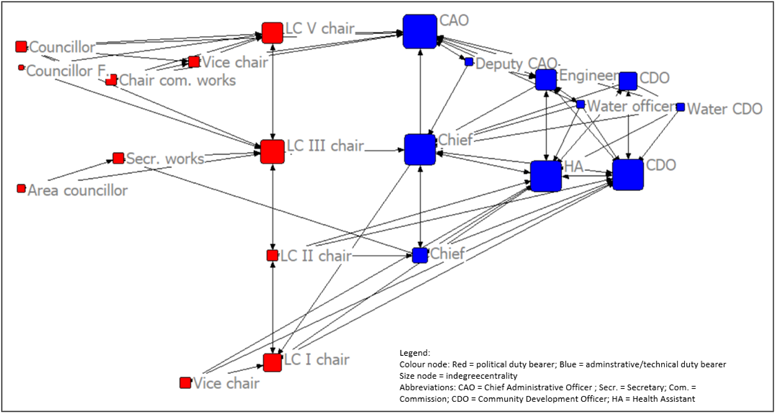
Figure 3b Theoretical ‘information-sharing’ network
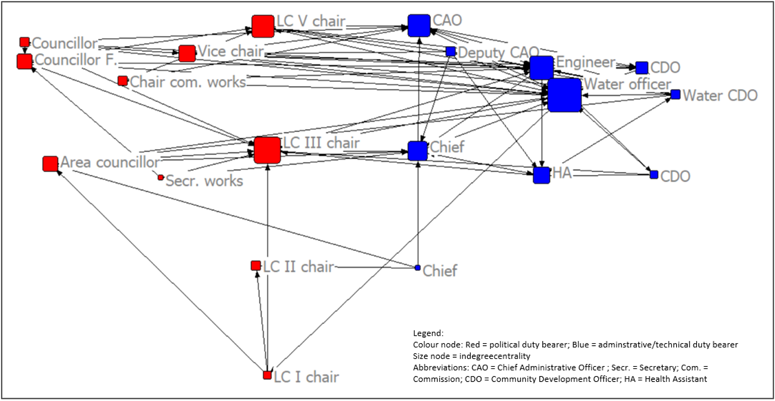
Figure 3c Actual information-sharing network
Source for Figures 3a-c: authors 2018
Figures 3a-c clearly depict the central role of the DWO, as well as that of the sub-county chairperson, the CAO and the district chairperson. They also show that the parish-level and sub-county technical/administrative actors are more peripheral in the actual information-sharing network than in the theoretical networks. Whereas the DWO receives and sends more water-related information than expected, the sub-county chief, sub-county CDO and health assistant receive and send less information than would be expected based on their position and role.
Identifying main information flows and missing links
Ensuring accurate, needs-based, demand-driven and efficient policy-making and implementation requires the smooth flow of information among actors who are differently positioned. New demand for point water sources and information regarding defects, for instance, should be reported upward, while information on water infrastructure (water quality) and plans for rehabilitation and maintenance should be conveyed downward. Furthermore, in Uganda district and sub-county offices are mandated to monitor access, functionality and quality of point water sources, and hence should receive accurate information travelling upward from the level of water users.
To get a more accurate understanding of the actual information flows among actors, the authors analysed within-group and between-group information flows based on the densities of information among or between them. First they evaluated the information flows between the political and administrative actors; then those between the different tiers of the decentralised system (ie village, parish, sub-county, district); and finally they differentiated between upward and downward information streams.
Information flows between political and technical/administrative actors: Table 3 presents the number of ties as well as the densities – ie the total number of ties as a share of the total number of possible ties – among the political and technical/administrative actors combined over all governance levels. The most intense information exchange is among the technical/administrative staff (density = 0.344, N ties = 31), indicating that about one-third of all possible information ties are actually in use. The technical/administrative staff also quite actively share information with political duty bearers (density = 0.24, N ties = 24), while political duty bearers share less information with technical/administrative staff (density = 0.150, N ties = 15). Based on this first crude analysis, the political–administrative divide does not appear to be the biggest stumbling block in terms of information flows; at least not when aggregated over the governance levels.
Information flows between governance levels: Table 4 presents density scores across the different tiers of the local governance system, with the duty bearers grouped according to the level at which they operate. The results in Table 4 highlight that the densest information exchange occurs among actors at the same level (the diagonal line from top left to bottom right in the ‘Density’ section of the table), with the bulk of information exchange taking place among district-level officials. However, the fact that there is only one village-level official compared to 11 district-level officials significantly influences the number of ties that can be expected. The village- and parish-level officials also show a high density of information exchange, after controlling for the total number of possible ties.
Regarding information exchange between levels of governance, it is evident that there is considerable information exchange between district and sub-county level officials, albeit with more information travelling from district to sub-county level than the reverse. Information exchange with lower governance levels, however, appears to be more limited.
Upward and downward information flows: Out of a total of 82 information-sharing ties, only 12 ties (namely all ties below the diagonal) qualify as ‘downward information ties’- information that flows from higher-level to lower-level officials. Out of these 12 ties, 11 ties (92%) are information flows from the district to sub-county level and only one downward tie links higher governance levels (sub-county and district duty bearers) to the parish or village levels. The latter findings point towards a possible weakness in terms of feedback information from higher (district and sub-county) to lower (parish and village) governance levels; a situation which has been documented elsewhere in Uganda (see eg Flint 2003). In fact, this ‘feedback’ deficiency is not just typical for Uganda or the water sector, but is rather a widely discussed phenomenon in public administration and evaluation literature which in the medium to long run also negatively affects the quantity and quality of upward information streams (see eg Mackay 2007). Lack of feedback and responsiveness from higher government levels might for instance affect actors’ belief in the effectiveness of their data collection and upward channelling of information, and thereby disincentivise further investment in these activities. The authors of the present study also came across this phenomenon during other field research in the same Ugandan setting (Dewachter and Holvoet 2017).
Figure 4 maps the upward (green), downward (orange) and horizontal (grey) information-sharing between the different governance levels. At district level, the overwhelming majority of information-sharing is horizontal, either among political duty bearers, among technical/administrative staff or between technical/administrative staff and political duty bearers. Some downward information-sharing to sub-county level also takes place, mostly originating from the district technical office. With the one exception of information flow from the DWO to the village leader, there is limited downward information flow from the district beyond sub-county level.
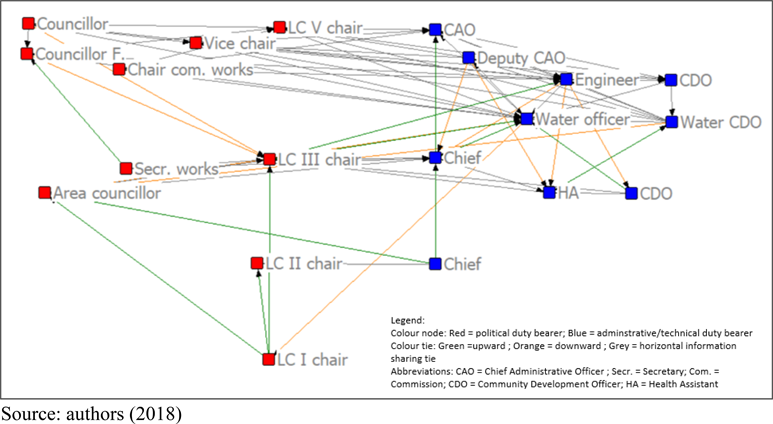
Figure 4 Upward and downward information flows among duty bearers
At sub-county level, the results show an inverse communication pattern. There is considerable horizontal information-sharing combined with some upward information-sharing, but it mostly stays within the various ‘sectors’ – ie sub-county technical/administrative staff communicating information to district technical/administrative staff, sub-county political duty bearers communicating information to the district councillor, and so on. The sub-county chairperson also shares information with the technical department, notably the DWO and district engineer. Worthy of note is that neither the sub- county technical/administrative staff nor the sub-county political leaders pass on information to leaders at the village or parish level. However, these lower governance levels (village and parish) do engage in upward communication, with this being the only option available to the village chairperson.
In sum, the inter- and intra-group analyses suggest that political–administrative information exchange is not the biggest stumbling block; rather, it is the information exchange between different governance levels, and more specifically between higher (district and sub-county) and lower policy levels (parish and village) that is insufficient. Additionally, most information exchange seems to be geared toward upward or horizontal information flows. Information flows from the sub-county to lower governance levels seem to be missing. Interviewees highlighted a variety of reasons for this lack of downward information, ranging from lack of capacity and funds to a lack of incentives, and the absence of any enforcement mechanism or sanctions for non-communication. These are familiar factors, which have been pointed out in earlier related studies (see eg Golooba-Mutebi 2012; Nicol and Odinga 2016).
Information flow networks from citizens to district officials
So far, the authors’ analysis has focused only on the information-sharing network among official duty bearers (technical/administrative and political). However, in order to ensure the most efficient and effective information exchange network, information flows from the users of point water sources up to the level of district duty bearers also need to be studied (eg Nicol and Odinga 2016). This paper now moves on to assess the entire information chain, including citizens (water users) and water user committees (WUCs), as well as all duty bearers included in the previous analyses. Additionally, as suggested in the 2011 Quin et al. framework, NGOs are included as actors in the water services network. The goal of this analysis is to identify the key actors, main information flows and any missing links in Uganda’s water governance.
Identifying key actors
Figure 5 depicts all actors in the information chain of the rural water services sector, distinguished by their ‘roles’ in the information-sharing network. The blue shade denotes technical/administrative staff, red denotes political duty bearers, purple denotes NGOs, dark green denotes WUC members and light green denotes citizens (point water source users). The sizes of the nodes depict how central (‘indegree’) each actor is in the overall network.
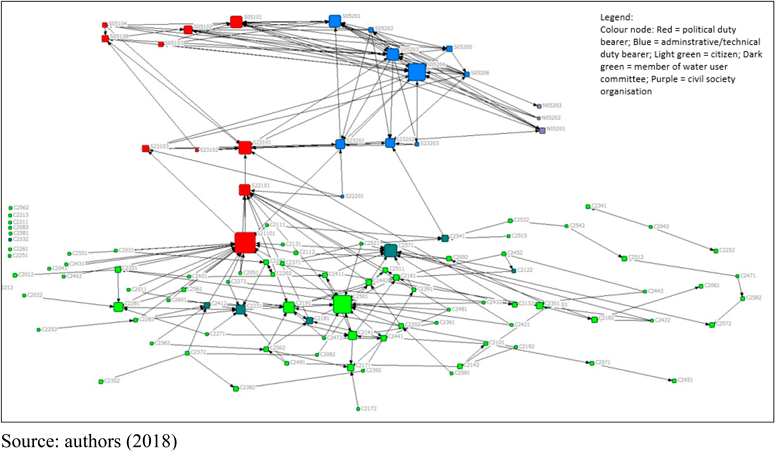
Figure 5 Information-sharing network among duty bearers and citizens
The results in Figure 5 reveal that the village (LC I) chairperson now becomes the most influential actor in the entire information-sharing network in terms of the number of incoming ties (‘indegree centrality’) and the strategic position held of being on the shortest pathway between two actors (‘betweenness centrality’). The DWO still holds a crucial position (second most central actor) alongside the sub-county (LC III) chairperson, the CAO and the district (LC V) chairperson. Furthermore, the results show that some citizens are also very central in the network, despite not being members of the WUC.
Figure 5 also clearly illustrates the paucity of ties from the citizens at village level (light green) to higher levels, notably political and technical/administrative levels, with the exception of the parish chairperson. The latter happens to be a resident of this particular village and often takes over the role of the village chairperson in his absence. He thus does not really qualify as an actor at a ‘higher’ level of governance in this particular case. Excluding the parish chairperson, there are only two direct ties between a villager and any of the other duty bearers. All other information seems to go through the village chairperson, making him or her a crucial broker in the overall information chain. This is in line with the authors’ own previous in-depth research in the village, which has showcased that the village chairperson is actively known by all villagers and perceived to be someone committed to their well-being, while also being the first point of contact within the local government structure (Dewachter and Holvoet 2017). Figure 5 also shows that some citizens are disconnected from the information-sharing network (ie ‘isolates’) and this group even includes one member of the WUC. Notwithstanding the important role that is foreseen for the WUC in theory, this finding does not come entirely as a surprise, as the non-functioning of WUCs has been documented on a broader scale before (Tumushabe et al 2011; Terry et al 2015), a state of affairs which also holds true in the village under study. The poor functioning of WUCs is linked to, amongst other factors, a lack of resources and knowledge about what is expected, as well as inadequate higher-level monitoring and enforcement (Tumushabe et al. 2011; Golooba-Mutebi 2012; Terry et al 2015).
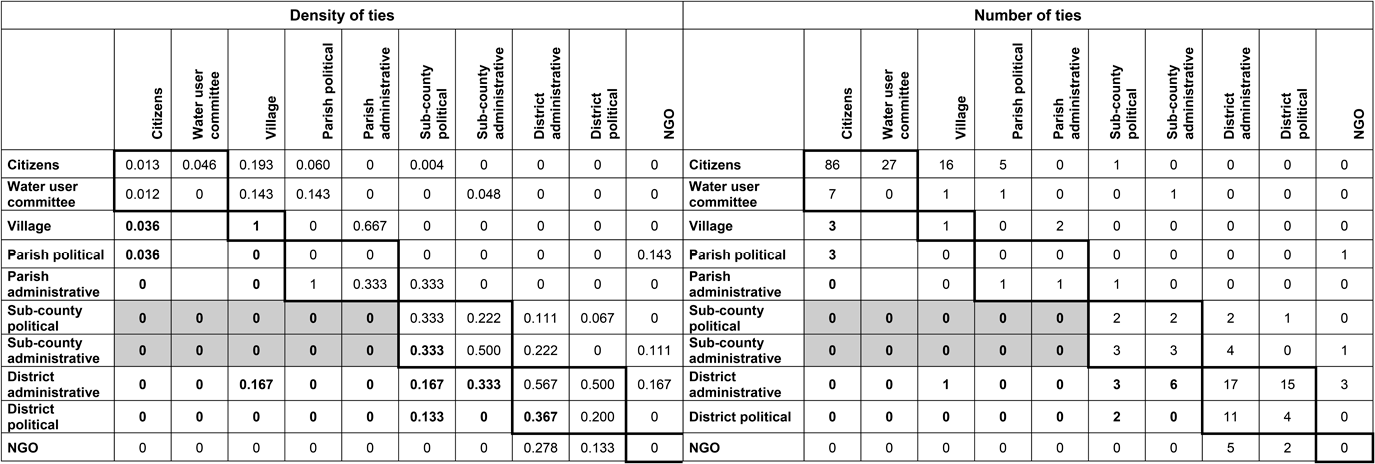
Identifying the main information flows and missing links in the entire information network
Looking at the within- and between-group densities/number of ties, the results again confirm that intra-level interaction (boxes) seems to be denser than inter-level interaction. Comparing the different governance levels (see Table 5), the information exchange among district-level officials appears to be the most intense, both among district-level technical/administrative staff, and between district-level technical/administrative staff and political duty bearers. Sub-county level actors also engage in considerable information exchange at their own level; however, beyond the ‘diagonal’ it can be seen that information-sharing becomes less frequent. Downward information-sharing (bold figures) is particularly poor. This is problematic because neither sub-county extension staff nor political duty bearers at sub-county level seem to reach out to citizens, WUC members, village leaders or parish level officials (highlighted in grey). As such, very little information trickles down, which in the medium to long run also undermines the upward flow of information.
In contrast, there is some information being shared upward by citizens, the WUC and the village chairperson. This information is largely channelled through the village chairperson, and to a lesser extent through the parish chairperson, who at times informally acts as the village vice-chairperson. NGO actors do not seem to effectively bridge the divide between the village and parish levels and higher governance levels, nor between citizens and higher governance levels.
In a focus group discussion held with village members regarding the information reporting chain and the role of the various actors, it was revealed that there was little contact between citizens (WUCs and village residents) and sub-county extension staff. This finding was confirmed during a second village focus group at which the results of the study were presented, as villagers stated that no extension staff visit had occurred since the start of the research project. Sub-county extension staff point out that they have to monitor all water sources in several villages within their sub-county and, as villages are often widely scattered and transportation is very costly and time-consuming, they are limited in the frequency with which they can monitor those water sources. Some extension staff are also inclined to seek additional employment to complement what they feel is an insufficient wage, thereby further limiting the time they have available for monitoring water service delivery. Finally, insufficient performance evaluation of the work of sub-county staff may also contribute to inadequate monitoring of local water service activities (see also Golooba-Mutebi 2012; Mugumya 2013; Quin et al. 2011).
Bridging the divide
The different analyses above indicate a bottleneck in information flow, mostly between the village level (and possibly parish level) and higher governance levels (sub-county and district). Regarding upward information flow, ICT tools could potentially be used to drastically reduce the social network distance that information on dysfunctional infrastructure or water quality issues has to travel.
First, geographical distance is important. A network distance of one step between for example the parish-level chief and the sub-county chief may require a journey of over 20 km (a huge barrier in settings with limited transportation means), while the same step between the district-level engineer and CAO only requires going to the office across the hall. Secondly, not only geographical distance but also ‘social distance’ – caused by differences in attributes such as gender, education, culture and social status – can be difficult to bridge. Using ICT tools (eg a mobile phone community-based monitoring app) could potentially overcome both types of distance. Allowing village-level actors (eg the village chairperson, the WUC or community monitors) to enter water-related information collected at local level into an online monitoring tool accessible by both sub-county and district technical staff would significantly reduce the time and financial resources needed to channel data upward. Additionally, these ICT-driven tools might also overcome some of the ‘social distance’ hurdles, as little direct personal interaction would be needed.
The visual illustrations and discussions of centrality SNA analysis further suggest that the ideal persons to supply the ICT-fed data should be situated at the village level, rather than at the parish or sub-county level. A fully operational WUC would be best placed to collect the data, given their roles and experience. A WUC member could, for instance, use his/her mobile phone to send information about the accessibility, functionality and quality of a point water source, which could be uploaded directly into an online database, thereby significantly improving the quality of data available to district policy-makers. In places where the WUC is not (yet) functional, the LC I chairperson may be a key resource to collect this type of data, given the centrality of his or her position. This database, containing all the uploaded disaggregated data, could then be made readily available to district-level actors, including the DWO.
In terms of downward information streams, however, ICT may be a less suitable instrument to pass on relevant information to all stakeholders, as some information might exceed what can be processed in a text message, and not all villagers may be reachable through short message services (SMS) (Dewachter et al. 2018). In an ideal situation, frequent upward and downward communication between sub-county technical/administrative (extension) staff, functional WUCs, the village chairperson and village residents should complement any ICT tools that are available and should reduce the distance that information has to travel to reach its intended audience.
Conclusion
This article has examined the information flow networks amongst actors from village up to district level in Uganda, in relation to their contribution to effective water service delivery. The assumption was made that efficient water services management requires effective upward and downward communication streams between technical/administrative and political duty bearers, on the one hand, and WUCs and point water source users on the other. Accurate information about access to, functionality of and quality of water at point water sources, as well as new demand for point water sources among the population, needs to reach the relevant actors at the district level. Likewise, it is assumed that it is beneficial if information about water services is communicated down through the levels of local governance to WUCs (if functional) and water users.
The authors constructed a theoretical social network model of the hierarchical reporting framework for water in Uganda, on the basis of Uganda’s Local Governments Act 1997 and the National Framework for Operation and Maintenance of Rural Water Supplies 2011 and complemented it with a theoretical information-sharing network based on the framework established by Quin et al. (2011). The subsequent analysis contrasted these two theoretical networks with the actual information-sharing network in a village in Bushenyi District in Uganda. The authors compared ‘what’s on paper’ with what takes place in reality, so as to identify any missing links and potential bottlenecks in the information flows, and to propose effective measures to improve communication networks and ultimately rural water services provision.
In a first step, the analysis focused on the information-sharing network among local governance actors, including political and administrative duty bearers at different governance levels. The results showed that, in terms of the intensity of information exchange, reality clearly outperforms the mere ‘reporting’ chain network envisaged by legislation, and more closely resembles Quin’s theoretical information-sharing network. However, results also indicated that the actual information-sharing network is more centralised in terms of who receives and sends information than either of the theoretical networks, and is also far less reciprocal than the reporting network in regard to the information being shared among the actors. Thus, despite the actual information-sharing network being positively correlated to both theoretical networks, there are still significant differences in the structural features of the networks. Zooming in to observe who is more central in the network, and differentiating between different actors and governance levels, crucial differences became even more apparent. The biggest discrepancy between the official and actual monitoring and evaluation networks was found to be in the role of the DWO, who turned out to be the most central actor in the information-sharing network with regard both to sending and receiving information, and to strategic information control. This finding contrasts with the more modest role attributed to this function on paper. Additionally – and less surprisingly – the study found that, among government actors, the sub-county chairperson, the CAO and the district engineer also play a crucial role within the network.
Conversely, some actors turned out to be more ‘peripheral’ than expected; for example the sub-county technical/administrative staff, and the parish-level duty bearers. In theory, sub-county extension staff should liaise with lower-level actors (village and parish) and collect information about water services to report to decision-making actors at higher levels. However, these staff are often poorly incentivised and constrained by limited resources and transportation problems. Overall, the inter- and intra-group information exchange analyses suggest that the political–administrative information exchange functions reasonably well, but the information exchange between different governance levels – notably, that between higher (district and sub-county) and the lower (parish and village) governance levels – is problematic. Additionally, most information exchange seems to be geared toward horizontal or upward information flows, with far fewer downward information flows. Information flows from the sub-county level to lower governance levels seem to be very underdeveloped.
Upon adding villagers, WUCs and NGOs to the actual information-sharing network, the real importance of the village chairperson became apparent. Most upward information flow from the village level to higher levels goes through the village chairperson, making him or her a crucial broker in the information-sharing network, as this role represents one of the only gateways through which information about water can eventually reach those with the power to make decisions on water services. It also makes the network quite vulnerable, given that a great deal of information flow depends on one person.
Given these findings, the authors make two initial recommendations. Firstly, extension workers, meant to reach out to communities and villagers, could increase their efficiency and reduce the vulnerability of the information-sharing network by creating some direct interactions with WUCs. Secondly, ICT tools would be useful to improve the flow of specific information about point water sources (eg use, access, functionality and quality) to the district office, as using ICT would decrease the number of ‘steps’ for the information to travel. From the study results, it becomes apparent that streamlining vertical information flows (top-down and bottom-up) is critical to improving rural water supply.
Acknowledgement
The authors are grateful to all respondents and M. Kuppens, C. Atuhaire, S. Karungi, N. Mwine and R. Nuwagaba for participation in data collection. All remaining errors are the authors’ responsibility.
References
Andersson, K.P. (2004) Who talks with whom? The role of repeated interactions in decentralised forest governance. World Development, 32 (2), 233–249. https://doi.10.1016/j.worlddev.2003.07.007.
Azfar, O. and Livingstone, J. (2002) Federalist disciplines or local capture? An empirical analysis of decentralisation in Uganda. Maryland: University of Maryland, Center for Institutional Reform and Informal Center.
Björkman, M. and Svensson, J. (2009) Power to the people: Evidence from a randomized field experiment on community-based monitoring in Uganda. The Quarterly Journal of Economics, 124 (2), 735–769. https://doi.org/10.1162/qjec.2009.124.2.735.
Blaikie, P. (2006) Is small really beautiful? Community-based natural resource management in Malawi and Botswana. World Development, 34, 1942–1957 https://doi.org/10.1016/j.worlddev.2005.11.023
Borgatti, SP., Everett, M.G. and Johnson, J.C. (2013) Analysing social networks. London: Sage Publications.
Brown, J. (2013) Can participation change the geography of water? Lessons from South Africa. Annals of the Association of American Geographers, 103 (2), 271–279. https://doi.org/10.1080/00045608.2013.754685
Chowns, E. (2015) Is community management an efficient and effective model of public service delivery? Lessons from the rural water supply sector in Mali. Public Administration and Development, 35, 263–276. https://doi.org/10.1002/pad.1737.
Dewachter, S. and Holvoet, N. (2017) Intersecting social-capital and perceived-efficacy perspectives to explain underperformance in community-based monitoring. Evaluation, 23 (3), 339–357. https://doi.org/10.1177/1356389017716740.
Dewachter, S., Holvoet, N. and Van Aelst, K. (2018) How does water information flow? Intersectionality in water information networks in a rural Ugandan community. Water International, 43 (5), 553–569. https://doi.org/10.1080/02508060.2018.1495047.
Flint, M. (2003) Easier said than done: A review of results-based management in multilateral development institutions. London: Department for International Development.
Forster, T. (2013) Predictors of sustainability for community-managed handpumps in sub-Saharan Africa: Evidence from Liberia, Sierra Leone and Uganda. Environmental Science and Technology, 47 (21), 12037–12046. https://doi.org/10.1021/es402086n
Freeman, L. (1979) Centrality in social networks: Conceptual clarification. Social Networks, 1 (1978/79), 215–239. https://doi.org/10.1016/0378-8733(78)90021-7
Golooba-Mutebi, F. (2012) In search of the right formula: Public, private and community-driven provision of safe water in Rwanda and Uganda. Public Administration and Development, 32, 430–443. https://doi.org/10.1002/pad.1638
Government of Uganda (1997a) Local Governments Act 1997. Kampala: Ministry of Local Government.
Government of Uganda (1997b) The Water Act, Cap 152. Kampala: Government of Uganda.
Introduction to social network methodshttp://faculty.ucr.edu/~hanneman/nettext/Introduction_to_Social_Network_Methods.pdf
Harvey, P.A. (2007) Cost determination and sustainable financing for rural water services in sub-Saharan Africa. Water Policy, 9, 373–391.https://doi.org/10.2166/wp.2007.012.
Honkalaskar, V.H., Sohoni, M. and Bhandarkar, U.V. (2014) A participatory decision-making process for community-level water supply. Water Policy, 16 (1), 39–61. https://doi.org/10.21666/wp.2013.113.
Hubert, L. and Schultz, L. (1976) Quadratic assignment as a general data analysis strategy. British Journal of Mathematical & Statistical Psychology, 29, 190–241. http://dx.doi.org/10.1111/j.2044-8317.1976.tb00714.x
Jones, S. (2011) Participation as citizenship or payment? A case study of rural drinking water governance in Mali. Water Alternatives, 4 (1), 54–71.
Krackhardt, D. (1988) Predicting with networks: Nonparametric multiple regression analysis of dyadic data. Social Networks, 10, 359–381.https://doi.org/10.1016/0378-8733(88)90004-4
Le Gouais, A. and Wach, E. (2013) A qualitative analysis of rural water sector policy documents. Water Alternatives, 6 (3), 439–461.
Mackay, K. (2007) How to build M&E systems to support better government. Washington, DC: The World Bank, The Independent Evaluation Group.
Ministry of Water and Environment (2011) National framework for operation and maintenance of rural water supplies. Kampala: Ministry of Water and Environment, Rural Water Supply Division.
Ministry of Water and Environment (2013) District implementation manual revised. Kampala: Ministry of Water and Environment.
Ministry of Water and Environment (2017) Uganda water and environment sector performance report 2017. Kampala: Ministry of Water and Environment.
Ministry of Water, Lands and Environment (1999) National water policy. Kampala: Ministry of Water, Lands and Environment.
Ministry of Water, Lands and Environment (2003) Rural water and sanitation strategic investment plan 2000–2015. Volume 1. Kampala: Directorate of Water Development.
Mugumya, F. (2013) Community-based water management systems: Governance and sustainability of rural point water facilities in Uganda. PhD Thesis. Dublin: Dublin City University.
Naiga, R., Penker, M. and Hogl, K. (2015) Challenging pathways to safe water access in rural Uganda: From supply to demand-driven water governance. International Journal of the Commons, 9 (1), 237–260. https://doi.org/10.18352/ijc.480
Nicol, A. and Odinga, W. (2016) IWRM in Uganda – progress after decades of implementation. Water Alternatives 9 (3), 627–643.
Quin, A., Balfors, B. and Kjellen, M. (2011) How to ‘walk the talk’: The perspectives of sector staff on implementation of the rural water supply programme in Uganda. Natural Resources Forum, 35, 269–282. https://doi.Org/10.111/j.1477-8947.2011.01401.x
Ringold, D., Holla, A., Koziol, M. and Srinivasan, S. (2012) Citizens and service delivery. Assessing the use of social accountability approaches in human development. Washington, DC: World Bank.
Steiner, S. (2006) Decentralisation in Uganda: Exploring the constraints for poverty reduction. Hamburg: German Institute of Global Area Studies.
Terry, A., McLaughlin, O. and Kazooba, F. (2015) Improving the effectiveness of Ugandan water user committees. Development in Practice 25 (5), 715–727. https://doi.org/10.1080/09614524.2015.1046421
Tumushabe, G.W., Tamale, M.L. and Sskemakula, E. (2011) Uganda local government councils scorecard report 2009/2010: Political accountability, representation and state of service delivery. ACODE Policy Research Series no. 42. Kampala: ACODE.
Van den Broek, M. and Brown, J. (2015) Blueprint for breakdown? Community-based management of rural groundwater in Uganda. Geoforum, 67, 51–63. https://doi.org/10.1016/j.geoforum.2015.10.009
Ward, M.D., Stovel, K. and Sacks, A. (2011) Network analysis and political science. Annual Review of Political Science, 14, 245–264. https://doi.org/10.1146/annurev.polisci.12.040907.115949
Yin, R.K. (2009) Case study research: Design and methods. (4th ed) Thousand Oaks: Sage Publications.
1 The authors do not disclose the name of the village or the sub-county because of the sensitive nature of SNA findings and the fact that various individuals in the network might be easily identifiable.
2 A first version of the figure was compiled by our PhD student M Kuppens and later updated by the authors.
3 The average degree of a node (in an unvalued network) is the average number of ties a node has (Hanneman and Riddle 2005).
4 The density of a network is measured as the ratio of actual ties to the possible ties. Nodes that are not connected to any other node are called isolates (Hanneman and Riddle 2005).
5 Centralisation is a measure of the difference between the number of ties that the most central node has and the number of ties of all other nodes (Borgatti et al. 2013). The measure can vary from 0 (where each node is connected to every other node) to 100 (where all nodes are connected to only 1 node).
6 The village vice-chairperson in our case study in practice did not take up an active role.
7 Calculation of the matching coefficient and Jaccard index require that the actors in the two networks be identical. To facilitate comparison, this study has removed the village vice-chairperson from the theoretical ‘reporting’ and ‘information-sharing’ networks. The village vice-chairperson has very few ties to other duty bearers and will therefore not substantially alter the correlation between different network ties.
8 To test for the significance of the correlation between the two network ties, UCINET applies quadratic assignment procedure (QAP) (Hubert and Schultz 1976; Krackhardt 1988), which is a bootstrapping procedure based on random permutations to develop standard errors to assess whether the actual association is statistically significant (Hanneman and Riddle 2005).