RESEARCH and EVALUATION
Local government finance: challenges in revenue-raising at the Municipal Corporation of Delhi

Simanti Bandyopadhyay1
Shiv Nadar University
India
Abstract
The main objective of this paper is to examine the extent to which the capital city of Delhi has gained financial autonomy over the years. In order to better understand its progress, the paper compares the periods before and after the submission of the Third State Finance Commission Report of Delhi. The main findings suggest there have been some efforts to reduce reliance on transfers from upper tiers of government and to strengthen ‘own revenues’ atthe Municipal Corporation of Delhi (MCD). A greater diversification of tax and non-tax revenue sources is responsible for this improvement. In the second period, other tax sources such as corporation tax and electricity tax gained in importance. Non-tax revenues were also strengthened by higher collection of certain components such as conversion charges. However, own revenues have been inadequate to meet growing expenditure requirements, resulting in high revenue expenditure gaps. Further, the growth in Gross State Domestic Product (GSDP has not led to a rise in own revenues for MCD.Rather, the paper finds that higher GSDP and its tertiary sector components are associated with higher expenditures in MCD. As far as local revenues are concerned, higher GSDP is associated with higher transfers, but has no discernible impact on own revenues.
Key words: decentralisation, local revenues, intergovernmental transfers, expenditure, service delivery
Commonwealth Journal of Local Governance
Issue 16/17: June 2015
http://epress.lib.uts.edu.au/ojs/index.php/cjlg
Commonwealth Journal of Local Governance 2015. © 2015 Simanti Bandyopadhyay. This is an Open Access article distributed under the terms of the Creative Commons Attribution 4.0 Unported (CC BY 4.0) License (https://creativecommons.org/licenses/by/4.0/), allowing third parties to copy and redistribute the material in any medium or format and to remix, transform, and build upon the material for any purpose, even commercially, provided the original work is properly cited and states its license.
Citation: Commonwealth Journal of Local Governance 2015, 0, 4486, http://dx.doi.org/10.5130/cjlg.v0i0.4486
Introduction
The Municipal Corporation of Delhi (MCD) in India contributes about 94.2% of the income of the state of Delhi and about 0.4% of the income of the entire nation. MCD spans eight of Delhi’s nine districts and is divided into 12 zones. It covers 94% of the total area of the urban agglomeration of Delhi, and 97% of Delhi’s population lives within its jurisdiction.
MCD’s responsibility for delivering services in the jurisdiction is shared with parastatal agencies and other bodies in the upper tiers of government. However, MCD plays a crucial role in service delivery and is responsible for services such as sanitation, stormwater drainage and flood control, solid waste management, street lighting, planning, poverty alleviation programmes, primary health, public conveniences and building plan approval. MCD also looks after roads and bridges in collaboration with the Public Works Department (PWD)2 and education with support from the Government of the National Capital Territory of Delhi (GNCTD) and the Government of India (GOI). Other bodies involved in service delivery are the Delhi Jal Board for water supply and sewerage, the Delhi Urban Shelter Improvement Board for slum development, Delhi Fire Services and the Delhi Transport Corporation.
MCD is entitled to levy a set of taxes and charges in its jurisdiction under the Delhi Municipal Corporation Act 1957. These constitute its ‘own revenues’. It also receives certain transfers of assigned taxes and grants from upper tiers of government. The own revenues and transfers together constitute the total revenues of MCD. Expenditures are incurred to deliver services and discharge MCD’s functions, which include operational and maintenance, running costs, salaries/wages etc. There is also expenditure on capital assets.
Managing expenditures and increasing revenues have been the major challenges facing MCD. The Third State Finance Commission (SFC) Report of Delhi3 was submitted in October 2006 and recommended that municipal bodies should augment their own resources from both existing and untapped sources. It also made a number of other specific recommendations:
- that MCD be given power to introduce a new tax
- that ‘floor’ rates on taxes and non-taxes should be prescribed and ‘ceiling’ rates should be removed
- that local bodies should consider levying professions and trade tax, and betterment and impact fees4.
- that property taxes should be revised and the existing ‘revenue-eroding elements’ in the system should be removed (MCD suffered severe losses under the previous‘unit area’ method of assessing propertytaxes)
- that MCD should be allowed to increase various user charges in order to improve its revenue base.
On the expenditure side, the SFC Report recommended that
- some major hospitals should move from local to state control, and
- suggested ways to better manage expenditure and reduce revenue expenditures by about 50%.
The Fourth SFC Report is still awaited.
The present paper attempts to address some important issues in municipal finance in order to evaluate MCD’s financial health. It offers a thorough analysis of the revenue and expenditure components in the annual budgets of MCD from 2001-2011, with a view to answering a number of interesting questions:
- Is MCD becoming more self-reliantand achieving greater financial autonomy,as envisaged by the 74th Constitutional Amendment?
- Whatare the recent trends in revenue generation and expenditures incurred?
- Are MCD’s own revenues adequate to cover its revenueexpenditures?
- Have property tax reforms brought the hoped-for results in terms of expanding the tax base and increasing revenue?
- Apart from property tax, what sources of own revenueshould MCDfocus on to augment revenues?
- Has MCD sought to develop any new sources of revenues to improve financial management?
- How far have the recommendations of the Third SFC Report been implemented in MCD?
- Is it possible to assess the impact of Delhi’s state-wide economic indicators (i.e. crucial indicators like the growth in the state GSDP, growth in the own revenues and transfers for the state etc.) on the finances of MCD?
In 2011, MCD was divided into three corporations: North Delhi Municipal Corporation, South Delhi Municipal Corporation and East Delhi Municipal Corporation. However, this analysis deals with data from before the division and covers a period from 2001 to 2011.
Methodology
The data on finances was collected through primary surveys of the income and expenditure budgets of MCD, and from secondary sources such as the Third SFC Report. The analysis also drew on data and information from the Directorate of Economics and Statistics of Delhi, the City Development Plan of Delhi, the Economic Census of Delhi, the Statistical Abstracts for the State of Delhi, and other secondary sources. Interviews and discussions with officials of MCD at different levels were also conducted to collect information and obtain necessary clarifications.
This paper is organised as follows: Section 1 gives an overview of the revenues and expenditures MCD during 2001-11; section 2 attempts to evaluate the financial management performance of MCD; section 3 offers some concluding remarks.
Finances of MCD: an overview
The present analysis covers a time period from 2001/02 to 2011/12. It looks at different financial variables and their behaviour over the period 2001 to 2011. The period of analysis is divided into two sub-periods, 2001-06 and 2007-11, the former being the period before the submission of the Third SFC Report ofDelhi,and the latter the period after it.
Comparing averages for these two sub-periods, all components of revenues and expenditures have increased substantially in absolute terms. Some summary statistics are given in Table 2.1.
Source: Annual budgets, MCD (author’s computation)
Analysis shows that between 2001 and 2006 total revenues grew by 21%, mainly due to a 108% growth in transfers. Own revenues and revenue expenditures recorded negative growth rates (-5.4% and -3.9% respectively).Between 2007 and 2011, total revenues grew by 39%. In this period own revenues did grow, by 52.2%, alongside transfers at 14.2%. In the first period expenditures growth was only marginally higher than total revenues growth. However, in 2007-11 the five-yearly growth rate of total expenditures was 58%, which exceeded the revenues growth rate of 39%. On the whole, in the second period expenditures grew more than revenues, and own revenues grew more than transfers.
Comparing the most recent year data and growth rates in different financial variables between the two time periods mentioned above, it appears that prior to the submission of the Third SFC Report MCD relied heavily on transfers, but this reliance reduced in the second period. MCD is becoming more self-reliant in many ways as far as generation of resources is concerned. The following analysis looks in detail at the behaviour of all the components of revenues and expenditures over time, to see whether there has been a change sincethe Third SFC Report based on an intention to implement its recommendations.
Total revenues
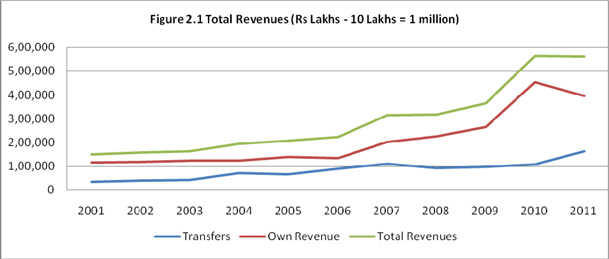
Looking at trends in total revenues over the entire time period 2001-11, analysis shows they have been moving upward, except for the latest year (Figure 2.1).This reflects an overall upward movement in both own revenues and transfers in the time period, despite own revenues showing a decline in the most recent year.
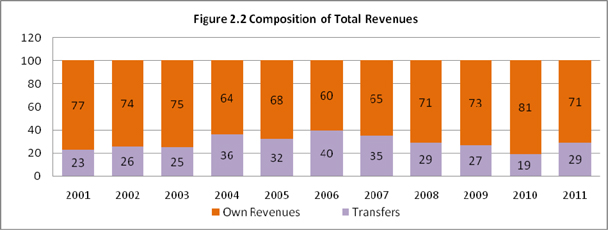
A close look at the composition of total revenues over the study period reveals that own revenues have always formed a larger part of total revenues thantransfers (Figure 2.2). On an average transfers contributed 31% of total revenues in the first period, reducing to 29% in the second.
Associations between different components of own revenues and total revenues in the two sub-periods were also examined. The analysis found that in the period 2001-06 total revenues were positively and significantly correlated with transfers, but not with own revenues. This means that in the first period higher transfers are associated with higher total revenues, but higher own revenues are not. In the second period of 2007-11, in contrast there isa significant and high positive correlation between total revenues and own revenues, and a low (insignificant) correlation between total revenues and transfers. This indicates that while transfers were more important in the first period, own revenues gained more importance in the second period in determining total revenues.
Own revenues
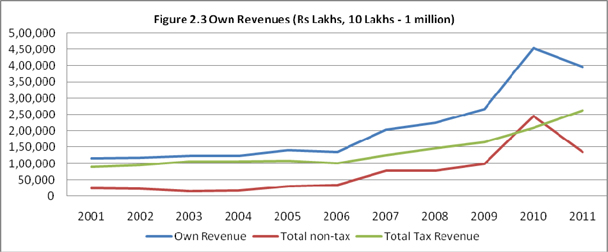
Tax and non-tax revenues constitute the own revenues of MCD. These own revenues show a more or less upward trend, except for the most recent year, which shows a drastic fall due to a fall in the non-tax component, which outweighed the rise in the tax component (Figure 2.3). This decline in the non tax revenues in 2011 was led by reduced collections in miscellaneous non tax revenues (explained in greater detail below).
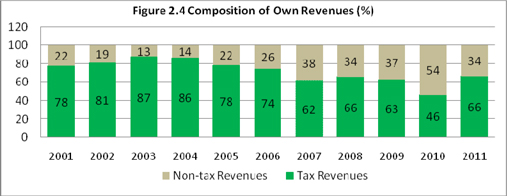
An analysis of the composition of own revenues over the study period (Figure 2.4) shows that the average share of tax revenues within overall own revenues was 81% in the period 2001-06,reducing to 62% in the period 2007-11. The higher average share of non-tax revenues in the later period was mainly due to high collection of conversion charges5, which caused non-tax revenues to rise substantially in this period. This indicates that MCD has made some efforts to augmentits non-tax revenues,as recommended by theThird SFC Report.
A close look at some correlation measures in the two periods reveals that while neither tax nor non-tax revenues are significantly correlated with own revenues in the first period, there is a high positive and significant correlation between own revenues and non-tax collections in the second period. This suggests that non-tax revenues are gaining more importance over the years in determining own revenues in MCD.
Tax revenues
According to the MCD Act 1957, while there are certain ‘obligatory’ taxes which MCD must levy, there is also legal provision for it to levy ‘discretionary’ taxes. The obligatory taxes include property tax, corporation tax,6 tax on vehicles and animals, theatre tax, tax on advertisements, milk tax, dog tax and tax on building applications. The discretionary taxes include tax on the consumption, sale and supply of electricity, toll tax, education tax, land revenues tax, professions tax, betterment tax and tax on boats. MCD levies all the ‘obligatory’ taxes but only two ‘discretionary’ taxes, namely toll tax and the tax on consumption, sale or supply of electricity.
In the period 2001-06, although property taxes declined drastically after 2003, a steady rise in corporation taxes and taxes from the sale of electricity supported tax revenues, keeping the tax revenue curve flat in the period 2003-05.
During this period the assessment method for property taxes i.e. the method in which property taxes would be calculated was changed and the ‘unit area’ method was implemented. Certain modifications to the initially prescribed norms for assessment, and the rates applied, resulted in lower collection of property taxes than expected, despite the change in assessment method. However, after experiencing a decline in 2006, tax revenues recovered during 2007-11. These issues are examined in detail in a separate section on property tax below.
All components of tax revenues except tax on the sale and consumption of electricity (which is dependent on the tariff structure for electricity) have shown a more or less increasing trend in the last five years, and this is mirrored in the total tax revenues trend over the past five years (Figure 2.5). The three components of tax revenues related to property – i.e. property tax, corporation tax and taxes on building applications – have all risen during 2007 to 2011.
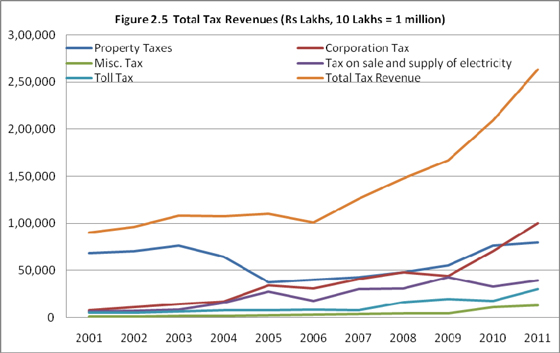
Corporation taxes have gone up further since 2009/10 following the rises in circle rates.7 By contrast property taxes, although they increased initially, have remained stagnant since 2010/11. Taxes on building applications have shown a steady increasing trend. This can partly be attributed to the fact that in MCD the proportion of properties attributing to higher property tax has decreased. If properties are demolished and rebuilt as apartments and newer dwelling units, this results in relatively more revenue from corporation tax and taxes on building applications, and relatively less revenue from property taxes. Other reasons for the trendmay include downward revision of the tax rates originally set (due to political pressures), wrong classification of properties, and a lack of revision of tax rates since 2007/08.However, these explanations are intuitive, based on observational data and discussions with officials at different levels. They cannot be substantiated as statistical data is currently lacking.
A close look at the composition of the tax revenues over the study period (Figure 2.6) shows that the average share of property tax in tax revenues has reduced from 57% in the period 2001-06 to 34% in the period 2007-11. On the other hand, the share of corporation tax increased from 17% in the period 2001-06 to 32% in the period 2007-11. The average share of the tax on sale of electricity also rose, from 12% in the period 2001-06 to 20% in the period 2007-11. Hence, in the second period the composition of taxes shows a more diverse pattern with other components apart from property taxes, contributing significantly, unlike in the first period when property taxes dominated the tax revenues. Nevertheless, even after its fall in the second period, property tax is still a very important determinant of tax revenues in MCD.
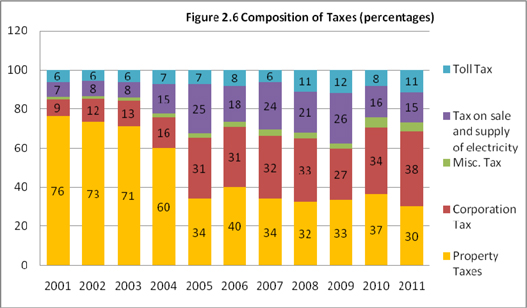
A close look at the associations between the various components of tax revenues and total tax revenues reveals that in the period 2001-06 none of the components had a positive and significant correlation with total tax collections – but in the period 2007-11 both property tax and corporation tax were positively and significantly correlated with total tax collections. In fact, in this period both property tax and corporation tax are also positively and significantly correlated with own revenues. This indicates that property tax and corporation tax have become more important as determinants of total tax revenues as well as of own revenues for MCD (i.e. revenues consisting of the tax and the non tax revenues) during the second period of our analysis.
Property tax: some anomalies
With the introduction of the ‘unit area’ method in 2003 for a number of properties in MCD, there was a net fall in the assessed value of properties and property tax collection declined. The Municipal Valuation Committee came out with data on a sample of 33,717 properties out of the total of 900,000 properties which were under the tax net and were subject to property taxation. Of these 33,717 properties, 58% were expected to pay less tax (mainly belonging to D and G categories), while 42% were expected to pay more (mainly belonging to A, B and C categories) after the unit area method was applied, indicating an overall increase in property tax liability. (i.e. it was expected that the net impact would be an overall gain). However, this analysis only considered the categories of the properties and ignored other factors (eg age, use etc) – and therefore did not fully explain the drop in collection of property tax. This section of the paper attempts to offer some plausible explanations.
The Municipal Act sets out ten parameters for classifying properties under the unit area method. These ten parameters were used by the Municipal Valuation Committee in 2003 to classify and categorise 1,900 colonies. These parameters ranged from various aspects like location of a particular colony, nearness to major business centres, availability of various facilities etc. Then various thresholds were created for categorization of the colonies. For example, all colonies getting a score of 80 or more would come under ‘A’ category and similar cut off points were decided for other categories. Then a list of base unit area value was decided for properties depending upon the category of colonies they belong to.
Property taxes are levied on the annual value of the building. The annual value is determined by the following formula:
Annual Value=Covered Area x Base Unit Area Value x Multiplicative Factors (Occupancy Factor, Age Factor, Structure Factor, Use Factor)
There are various possible reasons why property tax collections under the new assessment method have been lower than expected in MCD. Most significantly, in the above formula original norms were reduced, which caused annual values to reduce. This applied to all aspects which determine the assessed value of properties, including covered area, base unit area value (i.e. the value assigned to a property depending upon the category they came under), and the multiplicative factors of age and structure of the property. Because the annual values of properties were reduced (due to the downward revisions in the norms), their annual property tax (which is the property tax rate multiplied by the property’s annual value) also reduced and was much lower than expected. Other reasons for the failure of the unit area methodmay have included lack of awareness regarding the method among the public; lack of a proper database to check for non-payers; and inadequate staff training on implementing the method.
Currently, there is little scope to secure greater revenues from greater coverage. Almost 80% of areas are already covered, and the remaining areas are slums, unauthorised colonies etc. Nevertheless, MCD plans to conduct door-to-door surveys to ensure better coverage of properties. It is also using data from the Delhi state government’s Geographic Information System (GIS) project for an accurate assessment of the cover area of properties to improve property tax valuation. However, this data is incomplete and sometimes incorrect. Revision of the rates has also been proposed in order to improve property tax collections. However, there has not been any upward revision of rates since 2007/08.
Lower collections of property tax could also be due to evasion. In order to test this theory, and to detect any trends over the years, the study looked for associations between two components of Delhi’s Gross Statte Domestic Product (GSDP) – namely 1) construction and 2) real-estate/business services – and both property tax and corporation tax collection in MCD over the two periods under study. In principle, the higher the contribution these components make to GSDP, the higher property tax collections should be – as both the construction and real-estate/business services sectors are likely to have a direct impact on the number of taxable properties. It is interesting to note that in the first period the construction component of GSDP and property tax collections are negatively and significantly correlated. But in the second period they record a significant positive correlation. The findings for the first period are in line with the Third SFC Report, which estimated evasion in property tax to be high during this period. However, in the second period there is some improvement, as an increase in the construction component of GSDP is correlated with an increase in property tax collections. The same associations are visible between the real-estate component of Delhi’s GSDP and property tax collection. One plausible explanation forthe decline in property tax collection after the introduction of the unit area methodcould be higher evasion in the initial years, which then declined in the period 2007-11 and was reflected in an improvement in the collection of property tax in this period.
Non-tax revenues
The non-tax revenues of MCD comprise rents, fees, fines and miscellaneous income. Rents, fees and fines consist of: rents from municipal properties; licence fees (eg factory licences, food trade licences), fees relating to rickshaws, tehbazari, car parking, and education; user charges on various services; and fines from offences relating to cattle pounds and buildings. ‘Miscellaneous income’ includes conversion charges, development charges, road maintenance charges, reimbursements of administrative costs,and charges for mobile phone masts.
The ‘fees and fines’ componentof non-tax revenues has been low but steadily increasing throughout the study period (Figure 2.7).The behaviour of non-tax revenues is mainly driven by the ‘miscellaneous’ component data on individual elements of this component is not available).The rising trend is more pronounced in the 2007-11period.
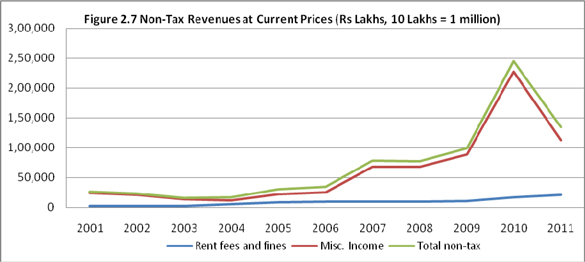
The heterogeneity of revenue sources in the ‘miscellaneous income’ component has resulted in a huge fluctuation in the most recent two years, which is also reflected in own revenues – even if tax revenues dominate this category in the other years. However, conversion charges showed a steep rise from 2008/09 to 2009/10 (plateauing thereafter), after the drive in 2007/08 when shopkeepers were made to pay for doing business in residential areas and these fees were collected through conversion charges. Post 2009/10, this component fell sharply and has reduced the contribution of non-tax revenues to own revenues over time. From 2009 onwards one-time parking charges also experienced a strong increase, contributing to the increase in non-tax revenues in the second period during 2007 to 2011.
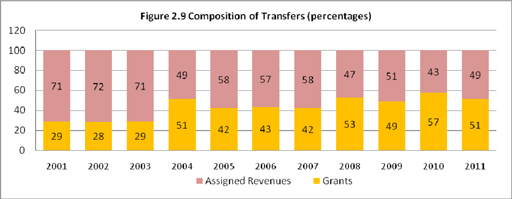
Transfers
Grants and assigned revenues together constitute the transfers MCD receives from upper tiers of government. MCD’s non-plan grants comprisea grant-in-aid for education, a grant-in-aid for maintenance of municipal school buildings and a grant-in-aid for maintenance of municipal assets. The assigned revenues of MCD are mainly made up of the global share of assigned taxes transferred to MCD by the state,as recommended by the State Finance Commission. GNCTD transfers 5.5% of its tax revenues to MCD as the ‘global share of taxes’.
Transfers do not show a well-defined pattern of movement in our study period; rather they show many fluctuations, caused by fluctuations in category components, ie grants and assigned revenue (Figure 2.8).
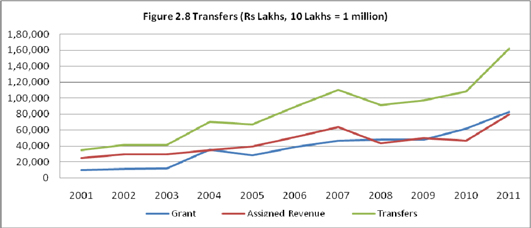
A close look at the composition of the transfers category (Figure 2.9)shows that grants increased their average contribution from 36% during 2001-06 to 49% during 2007-11.
Total expenditure
Expenditures can be categorised as revenue and capital. Revenue expenditure includes expenditure on general administration, wages and salaries, community services, horticulture and operations, and maintenance expenditure on all the services provided by MCD. Capital expenditure includes purchases of vehicles, expenditure incurred in construction of buildings, urban works and other investment components for the services provided by MCD.
All types of expenditures in MCD show an upward trendfrom2001 to 2011 (Figure 2.10).
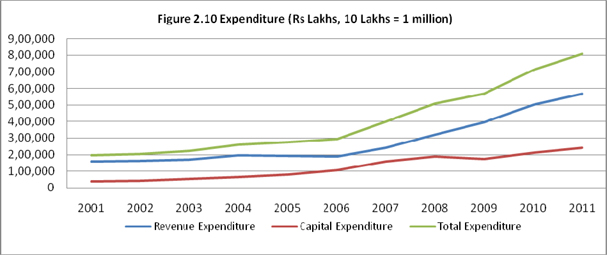
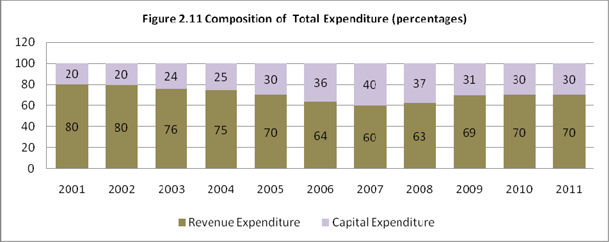
Figure 2.11 shows that revenue expenditure accounted for 70-80%,and capital expenditure 20-30%,of total expendituresduring the study period. Revenue expenditure’s share averaged 74% during 2001-06, falling to 66% during 2007-11.According to MCD officials, the ever-growingneed for revenue expenditure (especially administrative expenses) hasheld back capital expenditure. In fact, there are times when even loans taken out for capital projects end up being spent on revenue items due to inadequate financial resources.
The above analysis throws some light on various aspects of revenue generation and expenditurein MCD, and reveals many problems. Revenue bases are underutilised, and rates are not revised,leading to lower revenue yields. There are also signs of payment evasion. Revenue expenditures exceed capital expenditures. Not all the recommendations of the Third SFC Report for Delhihave been implemented. Some proposals to increase both tax and non-tax revenues have considered (eg raising rates for property taxes, parking fees, one-time street charges and fees from mobile phone masts; and introducing new charges such as conservancy and congestion charges), but political and social resistance has prevented their implementation.
Evaluation of the financial performance of MCD
After taking stock of MCD’s recent revenue generation and expenditure performance, and comparing the two periods used in this study, the next step is to evaluate the financial management performance of MCD. One way to do this is by comparing the revenues generated and expenditures incurred. Another way is to relate MCD’s performance to macro-economic variables affecting the urban sector of the state of Delhi, such as GSDP and its components, and state revenues.
Standard public finance theory on local sub-national governments posits that ideally urban local bodies should be able to finance their revenue expenditures from their own revenues. It is also desirable that total revenues are able to finance total expenditures in an urban local government. This paper now examines the scale of MCD’s own revenues compared toits revenues and expenditures, and also compares its total revenues with total expenditures. It asks the following questions:
- Are enough own revenues generated to finance revenue expenditures in MCD?
- Are there shortfalls in total revenues such that they cannot cover total expenditures?
- Have these shortfalls increased over time?
- What proportion of revenue expenditures is covered by own revenues?
- What proportion of total expenditures is covered by total revenues?
- Are transfers adequate to finance the capital expenditures?
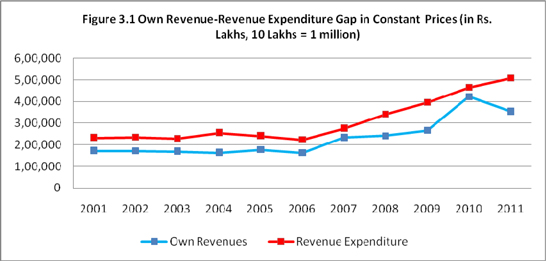
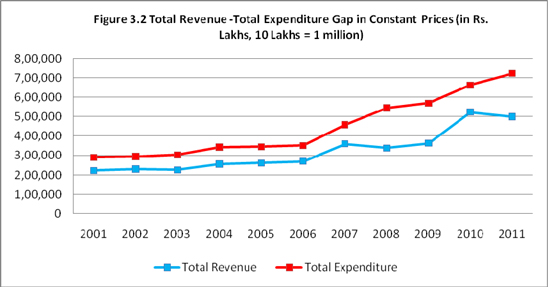
Analysis reveals that MCD had financing shortfalls in all years of the study period (2001-11). These occurred both in its capacity to finance revenue expenditures from own revenues, and to matchtotal expenditures to total revenues.Figures 3.1 and 3.2 chart these funding gaps. The major expenditure areas for MCD are social sectorssuch as education and public health.8 These areas do not earn much revenue, but their expenditure requirement is huge, resulting in large gaps being generated. (State Finance Commissions have regularly recommended transferring certain hospitals currently under MCD jurisdiction to state control, but these recommendations have not been implemented.) On average, the funding gaps were wider in the 2007-11 periodthan the 2001-06 period – both between revenue expenditures and own revenues, and between total expenditures and total revenues.
The study also looked at four additional parameters and their average values in relation to own revenues and total revenues. This allows evaluation ofthe financial performance of MCD in the two periods considered. Table 3.1 summarises these findings for thestatistical indicators collected.
Source: Annual budgets, author’s computation
The first two rows record indicators related to dependence on upper tiers of government. The ratio of grants to total revenues has on average increased in the second period,mainly due to an increase in grants-in-aid for education throughout this period. Meanwhile,average percentages of assigned revenues as a share of total revenues declined in the same period–indicating that MCD received a lesser share of resources from upper tiers of governmentin the form of assigned taxes.
The indicators in rows 3 and 4 of Table 3.1 show the capacity of own revenues to finance revenue expenditures. The gap here has, in absolute terms andon average,widened over the years(cf row 3, Table 3.1). However, in percentage terms, own revenues have been able to cover higher proportions of revenue expenditures in the second period (cf row 4, Table 3.1).
The capacity of total revenues to finance total expenditures issimilarly expressed in absolute and percentage terms in rows 5 and 6 of Table 3.1. The gap in absolute terms,on average, has widened over the years (cf row 5, Table 3.1). The same is true in percentage terms, as on average lesser proportions of total expenditures have been covered in the second period (cf row 6, Table 3.1). It is interesting to note that if the two categories of gaps discussed above are compared, it can be seen that the gaps are wider when comparing total revenues and total expenditures. This suggests that transfers are not adequate to finance capital expenditures in MCD and this problem has been particularly acute in the second period.
This paper also attempts to evaluate the financial performance of MCD within a macro-economic framework. The financial performance of a state has some impact on its local economies. A better economic performance of the National Capital Territory as a state would attract more citizens to live in the state, a sizeable proportion of whom would be in the jurisdiction of MCD, given huge migration rates into the city. This would impact the financial performance of the urban local body. More population within a city’s jurisdiction could add revenue-generating potential, as these new settlers would pay the local government various tax and non-taxpayments. On the other hand, it would also add to expenditures services would need to be provided to more people. An increase in state revenues can also result in an increase in transfers, since assigned taxes are fixed proportions of tax revenues collected by states. However, the net impact on the financial performance of the local body would need to be established empirically.
The present study considers macro-economic indicators such as GSDP and its different components (eg tertiary sector GSDP, construction GSDP and real estate GSDP) separately,as these are particularly relevant for the urban sectordueto their type of activity. It is interesting to assess the impact of these variables on local finances in Delhi over the study period and explore links between them and the financial performance of MCD.
A detailed look at the share of MCD revenues in total GSDP and trends over time reveals that both MCD’s own revenues and total revenues as a percentage of GSDP have on average remained the same in the two periods: around 1.3% and 1.9% respectively.9
During 2001-06, despite an average annualGSDP growth rate of 9%, MCD revenues experienced very low growth rates. The average growth rates of non-tax revenues and total revenues were 1.6% and 4% respectively, while tax revenues and own revenues experienced negative average growth rates. Transfers grew at 16% and expenditures at 2.3%. During 2007-11, the average annual GSDP growth rate was 11%. MCD’s tax and non-tax revenues experienced average growth rates of 13% and 24% respectively; its own revenues grew at a rate of 17% and total revenues at 13%; while transfers grew at 6% and expendituresat 13%. This indicates that GSDP growth in the first period boosted the transfers component of municipal revenues but none of the own revenue components. In the second period, it was the other way round. Allthe components of own revenues recorded above-GSDPaverage annual growth rates, while transfers recorded a lower growth rate than GSDP. Even the average growth rate of expenditures is higher than that of GSDP in this period. This roughly indicates that MCD has moved towards better financial performance over the two periods studied.
As far as the other components of GSDP are concerned, the tertiary sector experienced an average growth rate of 11.4% in the period 2007-11, higher thanthe 8.8%of the first period. This sector also experienced a rise in its share of GSDP in the second period, from 81.7% to 83.1%. The average growth of the construction sector component within GSDP remained at around 12% in the two periods. However, the average share of the construction GSDP within total GSDP has risen from 8.5% during 2001-06 to 9.4%during 2007-11. Turning to the real-estate sector of GSDP, this component’s share of total GSDP rose from 19% in the period 2001-06 to 23% in the period 2007-11. However, the average growth rate for this component fell from 14.8% in 2001-06 to 11.2% in 2007-11.
It is interesting to note that all the components of GSDP likely to impact the local economy of MCD recorded a higher share on average of total GSDP in 2007-11 than they did in 2001-06.Since the tertiary sector employs many people inDelhi (around 28%), its increase is likely to boost the local economy through the employment multiplier. This should be detectable in the financial performance of MCD. If the revenue-generating opportunities generated by better economic performance of the state outweigh the expenditure requirements, then financial performance will improve.
In order to assess the impact of macro-economic indicators on finances of MCD this paper poses a few interesting questions:
- HasDelhi’s higher GSDP and its components had an impact on MCD revenues?
- If so, is the impact via transfers or own revenues?
- How does the impact differ in the two study periods?
- How are MCD expenditures affected by a rise in Delhi’s GSDP?
Interestingly, in the second period macro-economic variables seem to have had little effect on city-level finances. While a higher GSDP (and its tertiary sector component) in Delhi led to higher transfers in the first period, there wasno visible impact on own revenues – although positiveimpacts on capital expenditures and total expenditures were visible in the same period. This suggests that the impact of increases in GSDP and its components on MCD finances has been through increased transfers and expenditures.10
This study also assesses the impact of higher GSDP components oncertain MCD financial performance indicators, by asking the following questions:
- Can higher GSDP and its components in Delhi reduce MCD’s dependence on transfers from upper tiers of government?
- Can higher GSDP and its components in Delhi reduce MCD’s revenue expenditure gaps?
Analysis found that in the first period a higher GSDP and its tertiary-sector component could not reduce dependence on higher tiers of government: the grants-to-total-revenues ratio and the assigned-revenues-to-total-revenues ratio were unchanged. However, the second period is somewhat different.11 A higher GSDP and its components is associated with higher revenue expenditure gapsthroughout the study period. Thisunderlines the fact that higher GSDP and its tertiary-sector components does not seem to improve the financial health of MCD by driving higher own revenues generation.
Conclusions
The main objective of this paper was to see whether MCD has gained more financial autonomy over the years. In order to understandits progress better, the paper compared the period before and after the submission of the Third State Finance Commission Report of Delhi.
Some efforts have been made to reduce reliance on transfers from upper tiers of government and to strengthen the ‘own revenues’ of MCD. There has been a noticeable change in the composition of total revenues over the years, driven by a greater diversification of tax and non-tax revenue sources. Property tax has been and remains an important source of local revenues for MCD. However, in the second period, other tax sources like corporation tax and electricity tax increased their importance. Non-tax revenues were also strengthened by higher collection of certain components,such as conversion charges. These resulted in higher own revenues collection,leading to a predominance of own revenues in total revenues in the latter half of the study period. This indicates some success in implementing recommendations from the Third State Finance Commission Report of Delhi to utilise taxes other than property tax, and boost the non-tax potential of MCD.
However, MCD has not managed to expand its tax and non-tax baseas far as it could. Proposals to raise the rates of certain non-tax components (eg car parking fees, one-time parking charges andfees on mobile phone masts) have been rejected. There have also been recommendations to levy congestion charges and conservancy charges, but these have failed due to political resistance. The High Powered Expert Committee (HPEC, 2011) report recommends tapping revenues from sources such as‘betterment charges’, ‘impact fees’, ‘development charges’ and the pricing of the Floor Space Index. However, this study did not detect any significant progress by MCD on implementation of these recommendations, even though there is considerable scope for all these instruments to yield high returns in its jurisdiction.
On the expenditure side, revenue expenditures at MCD have been high, including on social aspects and administration,whereas capital expenditureshave been quite low over the years.
The evaluation of MCD’s financial performance suggests that although there has been some increase in own revenues over the years, this has not been enough to cover revenue expenditures.Thegap between own revenues and revenue expenditures in 2011 was about 2.5x as great as in 2001, while the gap between total revenues and total expendituresfor the same year wasover 3xthat of 2001.It is worrying that these gaps have widened over time; however, own revenues do cover a higher proportion of revenue expenditures in the second period compared to the first.
The study also investigated potential macro-economic links between city-level performance and MCD financial management. Significant growth in the tertiary sector of Delhi was observed in the study period, and rises were also recorded in the construction and real-estate components of GSDP. This could be expected to have some impact on the city finances through different chains and linkages A higher GSDP and its tertiary sector components were found to be associated withhigher expenditures in MCD, and higher GSDP was also associated with higher transfers in to MCD. However, no discernible impact was found on own revenues.
Higher GSDP for Delhi as a whole was associated with higher dependence by MCD on upper tiers of government, but it was unable to reduce MCD’s gap between revenues and expenditures. One possible explanation for this is that higher GSDP has impacted expenditures more than revenues, such that spending has risen faster than income for the MCD. It would thus seem that in MCD’s case macro-economic impacts do not show encouraging results for city-level finances and have not enabled MCD to strengthen its ‘own revenues’ base.
References
City Development Plan of Delhi (2006), Department of Urban Development, Government of Delhi.
Comprehensive Annual Financial Report of the Municipal Corporation of Delhi (2007-08)
Directorate of Economics and Statistics, Delhi Statistical Handbook (2012), Government of National Capital Territory of Delhi
Directorate of Economics and Statistics, Employment and Unemployment Situation in Delhi (2012), National Capital Territory of Delhi
Directorate of Economics and Statistics, Estimates of State Domestic Product (2011-12), Government of National Capital Territory of Delhi
Directorate of Economics and Statistics, Report on Economic Classification of the Budget Expenditure of Local Bodies (2007-08), Government of National Capital Territory of Delhi
Directorate of Economics and Statistics, Report on Economic Classification of the Budget Expenditure of Local Bodies (2008-09), Government of National Capital Territory of Delhi
Directorate of Economics and Statistics, Report on Economic Classification of the Budget Expenditure of Local Bodies (2009-10), Government of National Capital Territory of Delhi
Directorate of Economics and Statistics, Report on Economic Classification of the Budget Expenditure of Local Bodies (2010-11), Government of National Capital Territory of Delhi
Directorate of Economics and Statistics, Report on Fifth Economic Census in Delhi (2005), National Capital Territory of Delhi
Directorate of Economics and Statistics, Report on Fourth Economic Census in Delhi (1998), National Capital Territory of Delhi
Directorate of Economics and Statistics, Report on Service Sector Enterprises in Delhi (2007), National Capital Territory of Delhi
HPEC (2011): Report on Indian Urban Infrastructure and Services, High Powered Expert Committee (HPEC) For Estimating the Investment Requirements for Urban Infrastructure Services, March 2011.
IIHS (2011): Urban India 2011: Evidence
Mckinsey (April 2010): India’s urban awakening: Building Inclusive Cities, sustaining economic growth
Municipal Corporation of Delhi, Non Plan Income and Expenditure Budget (2011-12)
Municipal Corporation of Delhi, Non Plan Income and Expenditure Budget (2010-11)
Municipal Corporation of Delhi, Non Plan Income and Expenditure Budget (2009-10)
Municipal Corporation of Delhi, Non Plan Income and Expenditure Budget (2008-09)
NIPFP (2007): Improving the Fiscal Health of Indian Cities: A Pilot Study of Delhi, Report Submitted to the World Bank.
Report of Second Delhi Finance Commission (2002), National Capital Territory of Delhi
Report of Third Delhi Finance Commission (2006), National Capital Territory of Delhi
State Finances: A Study of Budget (2003-04), Reserve Bank of India
State Finances: A Study of Budget (2004-05), Reserve Bank of India
State Finances: A Study of Budget (2006-07), Reserve Bank of India
State Finances: A Study of Budget (2007-08), Reserve Bank of India
State Finances: A Study of Budget (2008-09), Reserve Bank of India
State Finances: A Study of Budget (2009-10), Reserve Bank of India
State Finances: A Study of Budget (2010-11), Reserve Bank of India
State Finances: A Study of Budget (2011-12), Reserve Bank of India
State Finances: A Study of Budget (2012-13), Reserve Bank of India
The Delhi Municipal Corporation Act (1957)
The Delhi Rent Amendment Bill, 1997
Wadhwa, K (1991): Delhi Rent Control Act: Facts and Fallacies, EPW 26: May 25, 1991
FOOTNOTES
1 The author would like to thank Dr Isher Judge Ahluwalia for her help and guidance in different stages of the work. Sincere thanks are due to Mr Debraj Bagchi for his excellent research assistance. The paper has benefited from discussions with officials in the Budget and Finance Department, MCD, especially Mr Mayank Sharma, Additional Commissioner (Finance, Accounts and Planning), MCD and Mr M S A Khan, Assessor and Collector, MCD. The author also thanks MsJyoti Chauhan, Accounts Officer, Mr Sanjay Gupta, Deputy Collector of Accounts (Plan) and Ms Julia Michael, Assistant Accounts Officer, for their help and co-operation in clarifying doubts related to the budgets. However, the usual disclaimer applies.
2 The Public Works Department is the premier agency of the state government that is responsible for planning, designing, construction and maintenance of government assets, mainly related to infrastructure like roads etc.
3 Article 243 (I and Y) of the Indian Constitution mandated that the governor of the states shall form a Finance Commission within a year (and thereafter once in every five years) from the commencement of the 73rd Amendment Act, 1992. The commission would prepare a report (the State Finance Commission Report) to review the finances of the state and the rural and urban local bodies. This report will also provide principles for the vertical devolution of fiscal transfers from state to local bodies, and horizontal sharing of transfers among the local bodies. It should also determine measures that the state needs to undertake in order to ensure better fiscal management by the local bodies.
4 Tax revenues levied by the MCD can be classified as “obligatory” and “discretionary” taxes. The MCD levies all the “obligatory” taxes (which include property tax, corporation tax, tax on advertisement etc), but only levies two “discretionary” taxes (tax on consumption and toll tax). It is recommended that the MCD could also levy the other “discretionary” taxes like betterment tax, professions tax which would help to strengthen their own revenues. MCD could strengthen its own revenues through collecting revenues from non tax sources like impact fees.
5 Conversion charges are the charges that are levied on the commercial units (like small shops etc.) that have been established in certain residential areas. These constructions generally happen without any type of legal permission and hence are not taxed. Since such units are also a source of livelihood for many, they are not destroyed either. However, since commercial activities have been performed in those units MCD has taken initiatives to collect conversion charges from the owners of these commercial units since 2006.
6 Duty paid on transfers of property is accounted for as ‘corporation tax’ within tax revenues in MCD budgets.
7 The circle rate is the minimum rate for valuation for a plot, an independent house or an apartment in a particular area. The circle rate varies across categories of colonies (which refers to localities with mainly residential units) and is fixed by the state revenue ministry in Delhi. For example, as per the recent revisions of 2012, the circle rate for ‘A’ category colonies (which include places likeDefence Colony, Green Park, Panchsheel Enclave and HausKhas) has been fixed at Rs 645,000 per m2. For ‘B’category colonies thecircle rate is Rs 204,600 per m2, for ‘C’ category colonies it is Rs 133,224 per m2, for ‘D’ category colonies it is Rs 106,384 per m2, for ‘E’ category colonies it is Rs58,365 per m2, for ‘F’ category colonies it is Rs47,140 per m2, for ‘G’ category colonies it is Rs 38,442 per m2and for ‘H’ category colonies it is Rs19,361 per m2. Circle rates are determinedwith reference to the infrastructure in a particular locality and other factors (cost of construction, type of structure, multiplicative use factors). In Delhi, properties are registered at circle rates. If circle rates rise, stamp duty and the registration fee, which is calculated as a percentage of the registered price, are also expected to rise.
8 During 2007-11 the expenditure on education in total revenue expenditures accounted for 11-12%, and that of public health and medical relief for 21-28.3%.
9 The state’s revenues as a percentage of GSDP, however,marginally increased – from 8.8% in 2001-06 to 9.3% in 2007-11.
10 During 2001-06, the coefficient of correlation between transfers (and their components grants and assigned revenues) and the GSDP of Delhi was positive and significant. In the period 2007-11, although these coefficients were positive, they were no longer significant. The same is true for tertiary sector GSDP and transfers. GSDP (and tertiary sector GSDP) of Delhi was also positively and significantly correlated with total revenues in 2001-06. In the period 2007-11, although these coefficients were positive, they were again no longer significant. Expenditures (capital and total) were also positively correlated with GSDP and its tertiary component in the first period but not the second period. Own revenues however were not found to be associated with either GSDP or tertiary GSDP in either period.
11 The coefficient of correlation between GSDP (and its tertiary component) and indicators of dependence on higher tiers of government (grants-to-total-revenues and assigned-revenues-to-total-revenues) is high and positively significant in the period 2001-06. In the period 2007-11, it is negative and insignificant. The coefficient of correlation between GSDP and its tertiary components and revenue expenditure gaps during 2001-11is positive and significant.