Construction Economics and Building
Vol. 26, No. 2
2026
ARTICLES (PEER REVIEWED)
Structural Equation Modelling for the Impacts of Transactional Leadership Styles on Project Performance
Dr. Femi-favour Olabode Olasunkanmi
Department of Building, Niger Delta University, Wilberforce Island, Bayelsa, Nigeria
Corresponding author: Dr. Femi-favour Olabode Olasunkanmi, femifavour.ff@gmail.com or femi-favourolasunkanmi@ndu.edu.ng
DOI: https://doi.org/10.5130/5wwvh077
Article History: Received 14/05/2025; Revised 29/09/2025; Accepted 29/10/2025; Published 15/07/2026
Citation: Olasunkanmi, F.-F. O. 2026. Structural Equation Modelling for the Impacts of Transactional Leadership Styles on Project Performance. Construction Economics and Building, 26:2, 1–22. https://doi.org/10.5130/5wwvh077
Abstract
Construction firms are intensifying efforts to strengthen the construction process through the engagement of professionals with sound management and leadership acumen against only technical ability. This study, therefore, determines how the transactional style of leadership impacts project outcomes (successful delivery or otherwise) in the Nigerian construction sector. A quantitative survey method, 5-point Likert ordinal-scale cross-sectional questionnaires, was used to elicit the respondents’ response. Valid feedback from 975 participants out of 1,233 administered on project managers, project team members (only construction professionals), and firms’ supervisors with a response rate of 79.8% was initially analysed descriptively, then inferentially using the structural equation modelling (SEM) approach. Results show a negative direct effect of passive management by exception of transactional style on deliveries of Nigerian projects. SEM output with a squared multiple correlation of 0.219 indicates that passive factors of transactional style accounted for 21.9% of the variance in success indices of projects. The standard regression weight of −0.47 implies that passive management factors of transactional style reduce project performance by 47%. The study establishes that passive factors of transactional style exert direct negative effects on project performance in Nigeria. The survey’s peculiarity enables the project managers to filter through and improve upon the advantageous aspect of transactional leadership already in use towards successful project outcomes. Engaging a SEM approach to identify the transactional variables that exert negative effects on project outcomes takes the lead in the leadership aspect of management discourse as previous researchers only mentioned the effect on worker’s performance, thus enriching literature on project management in Nigeria and globally.
Keywords
Transactional; Leadership Style; Construction Industry; Structural Equation Modelling; Project Performance
Introduction
Leadership in the construction industry is yet to receive adequate attention as much as it should; rather, construction firms have intensified effort in project management via principles, techniques, and tools. PMI (2021) emphasised the importance of leadership in construction more now than before as a crucial success factor. However, the trend is fast changing with firms looking at strengthening the construction process through the engagement of professionals with sound management and leadership acumen instead of only technical ability (Ali et al., 2020; Oke & Aigbavboa, 2022; Yusuf & Aibinu, 2019). The structure of our school system curricula over the years has led to the production of prospective employees with little or no leadership capacity. The curricula consist of more academic theories with little emphasis on leadership development. The major requirement that will enable an individual to manage organisational affairs so as to yield desired results is leadership development capacity. Meanwhile, construction firms are making progress in this regard through training and enhancing the capacity of personnel in leadership development. Also, most institutions are incorporating leadership skill and entrepreneurial development in the school curriculum across the nation. Many still believe that the construction industry had focused more on management than leadership training. Moreover, Owusu-Manu et al. (2021), Toor and Ofori (2008), Wu et al. (2023) all submitted that construction project managers are seen more as managers than being perceived as leaders. Expatiating the distinctive features of manager and leader, Management Adda (2019) highlighted the roles of the leader to include, among others, motivation, inspiration, and direction of subordinates, whereas managers align with channeling the organisation’s resources to the optimum use of task accomplishment. Nonetheless, equilibrium is expected to be struck by a project manager between these two skills to be successful at the assigned role (Bans-Akutey, 2021). Construction project managers are confronted with a plethora of functions, chiefly among which is the achievement of the short-term goal of the project. With fulfilling these objectives in mind, a project manager is preoccupied with managing the task rather than leading the people. Hence, they were perceived by Ceri-Booms et al. (2017) and Koeslag-Kreunen et al. (2018) as task-oriented rather than human-oriented. They are sometimes referred to as production-oriented managers rather than relationship-oriented leaders. A manager who pays attention to the end or targeted goal at the expense of the means to achieve the goal is known as a manager with transactional leadership style (TSLS). Such a manager is mostly interested in managing the team towards the accomplishment of day-to-day task. This is a short-term objective instead of leading the team towards realising long-term objectives. A construction manager who favours TSLS employs social exchange principle in achieving results. Leadership style is regarded as the manner of managing organisation resources, both human and material inclusively; it is the way project managers enforce implementation of instructions in construction to ensure desired goals are accomplished. This entails managers’ ability to plan and organise work within their jurisdiction and particularly maintain a good working relationship with colleagues and subordinates. As earlier mentioned, among a plethora of functions confronting the project manager is achieving the short-term objective of project delivery. Achieving durable infrastructures and sustainable structures as the output of construction process is possible when the project team leader employs a suitable style that gives premium to teamwork and champion effective team commitment. This is realisable through the management of construction activities within the laid down budget, expected time frame, and the desired acceptable quality standard.
Performance of construction projects depends on the leadership ability and skills of the project manager (PM) (Oyaya, 2017). Abbas and Ali (2021) decried the neglect of this all-important success factor by construction project researchers despite its influence on project outcome (successful delivery or otherwise). Project success or failure is premised upon three major parameters known as performance indicators. These indicators of cost, time, and quality as primary concerns are without prejudice to the distinct role of other critical variables that dictate success, commonly referred to as critical success factors. Notwithstanding the presence of these variables, defining project success is a function of an individual’s interest or stake, hence subjective (Anantatmula, 2015). However, project success or performance is attributed to its efficiency and effectiveness. Efficiency dwells on meeting the combined indices of timely delivery within budgeted cost and to a specified quality standard. Effectiveness relates to satisfying both the clients and the project team. Johan and Piet (2014) added that accomplishing these goals must be with regard to safety, environment, and legislation. In summary, project outcome is successful when simultaneously efficient and effective, thereby fulfilling its conceptual purpose (Allen et al., 2014). Other secondary considerations such as quality of implementation process, technology and business improvement, and personnel capacity building were highlighted in Kerzner’s (2017) discussion.
A study by Liphadzi et al. (2015) revealed the positive correlation of TSLS with a successful delivery of the project in South Africa but did not mention whether a particular component is responsible for this or adoption holistically. However, Rotimi et al. (2021) reported that passive management by the exception component is a major deterrent to workers’ performance in the Nigerian industry. The desire to investigate the component of TSLS that will improve project performance in Nigeria stems from the front and back argument on the appropriate leadership style in the Nigerian industry. Some opinions believed that an autocratic and laissez-faire leadership style was appropriate whilst others argued against it. A growing concern in the industry has been the scarceness of literature on the exact leadership style, either single or combined, that can or shall boost performance. Based on findings by Oyetunji et al. (2019), realising anticipated results of successful project delivery might require combinations of few components of different leadership styles.
Given the aforementioned background, this study attempts to identify the aspect of TSLS that will be advantageous or otherwise to project delivery in the Nigerian construction industry. Specifically, the purpose is to determine how the TSLS of PM affects the outcomes of projects by using the structural equation modelling (SEM) approach to ascertain the effects of latent constructs on performance indices. Engaging the SEM approach for analysis of the relationship among latent constructs places the survey in good stead above its contemporaries in the leadership aspect of management discourse in the study area as it is rarely used. The novelty of this survey is its direct response to the recommendation of previous studies of factors of TSLS in the Nigerian construction industry based on the ambiguity created by their conclusions. Though TSLS was concluded to positively and significantly influence construction employees’ performance, no particular component was revealed as being responsible and very limited in scope (Oyetunji et al., 2019). Then, Rotimi et al. (2021) warned of the detrimental effect of passive management by the exception component of TSLS still on workers’ performance. Neither of these studies mentioned project performance.
Relationship between leadership characteristics and project performance/success
Turner and Pearce (2011) opined that style and ability of leadership are key to successful business outcomes, whereas Jarad (2012) asserted that the study of association between management style and types of projects by few researchers is yet to yield any indication that PMs’ personality impacts project deliveries and outcomes. However, other studies especially Wu et al. (2023) had ascertained the existence of interaction between those indices and management performance. Again, the significance of leadership in project to successful delivery could be linked to project type (Wu et al., 2023). It has been mentioned in the literature the possible impact the moderating role of project complexity is having on the interaction of leadership practices and rate of success. Jarad (2012) enthused that the requirement of skill in the technical leadership field is non-negotiable for effectiveness as PM, though no evidence of the clear relationship among the three – skills, personality and project success. On the other hand, according to Fareed et al. (2023), the type of influence a project leader exerts on performance is project-specific as he may exhibit a considerably different characteristic in another type of project. Some PM’s abilities listed by Maqbool et al. (2017) to be correlated with project outcomes include emotional toughness, motivation, communication, sensitiveness, and thoroughness but went on to suggest the appropriateness of different styles that match different project specifics. The project leader’s effectiveness is among the factors that culminate in project implementation output (Al Malki & Wang, 2018). A study by Liphadzi et al. (2015) already revealed that TSLS positively interacted with project outcomes or deliveries but did not mention whether a particular component is responsible for this or not. Therefore, this survey intends to build on this and relate the findings to the Nigerian construction environment.
Underpinning theories and hypothesis
The context of the survey is premised on transactional theory otherwise called management theory where the system concentrates on functions of the supervisor, entities, and individual or group with performance rewarded or punished accordingly. This theory is emphasised mostly among groups when employees are successful in the assigned task or responsibility. A transactional leader is task-oriented, hence with a sole aim of ensuring attainment of goal by removing all impediments at whatever cost because achieving the target is a must. The leader deploys any means to realise this aim. A blend of path-goal theory is also included in this context as it emphasised the importance of project leaders adopting a contingency approach in their dealings (EPM, 2019). The expectation of a tangible reward by the subordinate upon achieving the target given by the leader explains the expectancy theory component of path-goal. Northouse (2016) posited that whilst employees are rewarded for being successful, they are punished or reprimanded for failure. Complementing this theory is a contingency theory that took care of all situations, people, task assigned, nature of the organisation, and other environmental factors. This research agreed with the Management Adda (2021) opinion that no singular leadership style could be appropriate in all construction cases; therefore, a leader must employ the style that would yield a positive outcome on the task at hand. Many combinations of variables account for success, such as managers’ style, project environment, and employees’ attributes. Effective leadership according to Lamb (2013) is a function of how coherent is the manager’s personality and adopted style with the particular project situation.
Going by the aforementioned, a theoretical framework of how transactional style impacts the delivery of the construction project in the Nigerian construction sector was developed (see Figure 1). The framework displays the components of transactional style-coded FTS: social exchange system of contingency reward (CTR), active management by exception (AME), and passive management by exception (PME), which exert a significant effect on project performance indicators (PPIs) measured by cost, time, quality (QTY) and stakeholders’ expectation (STE). Therefore, the study hypothesis formulated based on the framework stated thus:
H1: Transactional leadership style (TSLS) exerts a significant impact on project performance.
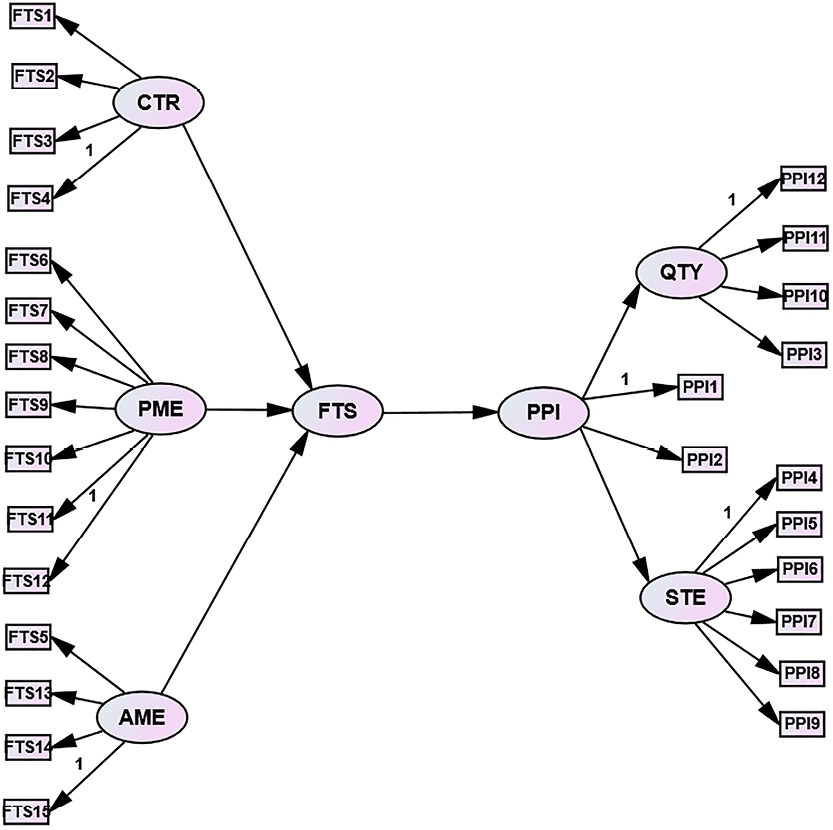
Figure 1. Conceptual framework and hypothesis for the study.
Research methodology
A descriptive survey design method that justifies the desired feedback and purpose of the study was employed. The methodology according to Babbie (2020), Creswell (2014), and Taherdoost (2016) is that of a cross-sectional survey in which data were collected once from different sources that form the population. Construction workers from firms in FCT (Abuja), Lagos, and Rivers were the population source for the study. Ikediashi and Ogwueleka (2014) considered the study area in previous research as important locations to Nigerian landscape based on their status as macro-capital cities and hub of economic investments. This is confirmed by the volume and type of old and current construction activities executed by indigenous and foreign companies and firms. The construction professionals within the firms were divided into groups based on their job description as respondents for survey purposes: project managers (PMs) as the team leader; project team members (PTMs)—the professional subordinates (architects, builders, engineers, and quantity surveyors for the project); and supervisors (SUP) in charge of other semi-skilled and unskilled firm workers. The population frame sourced from the tax collection agency—Federal Inland Revenue Service—comes with an advantage of a higher number of registered firms that will match the level of feedback desired by the survey compared to others. The active dashboard of any firm on the portal of this agency as validated by recent tax remittal is a proof of its existence and such were selected for participation. The firms were divided into strata based on location, job specialisation, and other considerations, hence the use of stratified random sampling for the firms’ selection. The main participants within were purposively selected as recommended by the PMs based on their levels of education, job experience, and professional affiliation. The popular equation by Taro Yamane (1967) tagged as Eq. (1) was used to extract the sample size.
n = N/(1+N) (e)2(1)
n represents the sample size; N is the population frame; e is the marginal error of 0.05.
Shown in Figure 2 is the sample size for each location.
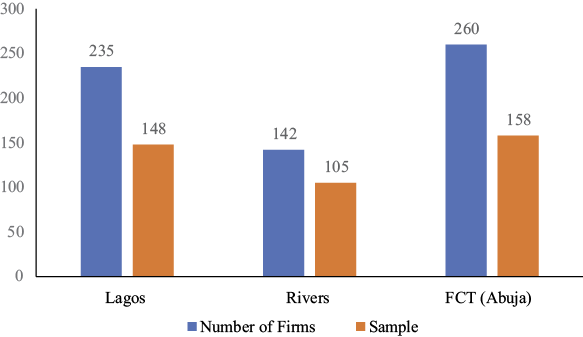
Figure 2. Frame and sample sizes.
Out of 637 study frames, 411 firms were extracted as the sample size with 1,233 participants in all (three per firm). The order display in Figure 2 has FCT (Abuja) with 158 firms; Lagos, 148 firms; and Rivers, 105 firms.
The extant variables from literature known as TSLS measurement indices and used by previous researchers, Agaa (2016) and Oyaya (2017), were modified and adopted by the study. The outcome of the pilot study conducted and validated by academia and industry practitioners helped to reframe the variables, same as those of PPIs peculiar to Nigeria as shown in Tables 1 and 2, respectively.
The latent variables of TSLS in Table 1 and PPI in Table 2 are further divided into components and coded accordingly as required by SEM analysis in Table 3.
Questionnaire preparation
The use of structured, cross-sectional questionnaires was considered appropriate for the study. There were 975 questionnaires returned and correctly filled from 1,233 administered, indicating a response rate of 79.8%. The research instrument has two divisions; the first division contains the demographic features of participants with 14 items and the second division has 27 items (15 for factors of TSLS and 12 for PPIs). Participants’ opinion on the level of application of elements of transactional style by the team leader (PM) and the extent at which they perceive that their project had achieved compliance with performance indicators were solicited in part 2. The two parts were measured on three different scales of nominal, ordinal, and interval. The first division used nominal and interval scales for demographic features, whereas the five point-Likert ordinal scale of measurement of strongly agree, agree, moderate, disagree, and strongly disagree and a great deal, quite a lot, moderate, just a little, and not at all ranked 5, 4, 3, 2, and 1, respectively, was used for the second section. Some research instruments were administered/retrieved in person and also through selected research assistance, whilst others were through email to PMs. All participants were compelled to align with a rank as neutral position was omitted based on their understanding and expertise in the crux of the subject of investigation (Nowlis et al., 2022).
Each questionnaire was accompanied by a cover letter attached (indicating the researcher’s detail) stating the purpose of the study in conformity with the ethics requirements; also, this aims to increase the respondent’s confidence by ensuring they know with whom they are dealing. The letter also assured that the disclosed information is kept confidential without revealing their identities.
Demographic features of the participants
Participants’ demographic features were descriptively analysed and presented in percentages as output of SPSS software version 24 as displayed in Table 4. The participants’ sex distribution shows minimal involvement of females in Nigerian construction activities compared to their male counterparts as depicted by a ratio of 1:7. The challenges of stereotype, pressure of proving self-worth, masculinity orientation, inadequate recognition, insufficient female examples, and the demand of working extra hours faced by women (Rotimi et al., 2024) might prevent them from embracing career opportunities in construction. Over 90% of participants have more than 6 years of cognate experience, thereby validating the credibility of feedback received, whilst only 7.4% of them possess a minimum academic qualification of ND (National Diploma). Nearly all the participants were affiliated with major construction professional bodies in Nigeria with only 11.4% excluded. This excluded category mostly consisted of firms’ supervisors whose appointment as supervisor was predicated on their length of years on the job that equipped them with relevant knowledge and expertise.
Preliminary checks and results of data analysis
Preliminary tests were conducted to check for possible characteristics such as missing data, outliers, reliability, and validity (convergent and discriminant validity). Missing values were eliminated from the data by excluding items with a response rate < 95% from the dataset, thereafter treated with a method of expectation maximisation (Hair et al., 2019). Both the Mahalanobis distance calculation method and graphical illustration were used to ensure there are no data outliers. Methodological steps were taken to eliminate data bias by explaining the survey concept to unwilling or confused participants to ensure a fuller understanding and to assure them that their responses would remain confidential and anonymous, thereby reducing survey bias (Kyeremeh & Kamewor, 2023). An examination of the total variance explained by each component also revealed values below the recommended threshold, indicating the absence of common method bias. Evaluation of respondent firms’ features such as types and nature of executed project, operational mode, and geographical spread compared to declined firms shows no statistical difference, thus eliminating non-response bias statistically.
As recommended and used by various researchers (Livingston, 2019; Kennedy, 2022), at an interval of 14 days, the reliability of instrument was tested on two separate occasions in two out of the three locations of study area among the participants. This period is sufficient to confirm the stability of anticipated results. The research instrument was adjudged reliable and consistent with the values of Cronbach alpha coefficient ranging from 0.88 to 0.93, which was higher than the 0.7 minimum threshold (Table 5).
| Respondents | No. of items | Cronbach’s alpha |
|---|---|---|
| Project managers | 83 | 0.924 |
| Project team members | 83 | 0.885 |
| Supervisors | 83 | 0.894 |
The adequacy and suitability of data were confirmed for analysis of factors of latent constructs through KMO and Bartlett’s test before carrying out the main hypothesis testing using SEM with the result shown in Table 6. The measure of adequacy of 0.740 is higher than the stipulated minimum of 0.6 according to Achoba et al. (2021a) and Aule et al. (2022a, 2022b) with the Bartlett’s test significant at P < 0.05.
Further analysis was done through CFA and SEM with AMOS 23 as output of SPSS version 24. According to Tuhul et al. (2021), values, pleasure, self-esteem, and accomplishments are intangible qualities that cannot be directly gauged or quantified but, through SEM, could be evaluated. Abstract traits of people or things can be measured effectively on an ordinal scale of measurement (Kline, 2016). Hence, CFA and SEM are considered to be an instrument to test and explore relationships among variables in ordinal scale data (Achoba et al., 2021b). SEM, in some cases, could be referred to as covariance structure modelling or analysis (Kline, 2016), done in components referred to as orders. These orders are the processes of carrying out SEM; the first process or order is CFA whilst SEM is the next phase or second-order. CFA establishes a link between exogenous and endogenous constructs represented by many measured variables (Malhotra, 2020). Satisfaction of reliability and validity criteria with achievement of required fit indices brings first-order CFA to completion. The second order, on the other hand, gives a detailed model by using the results of the SEM.
There are two spheres of operation as evolution of SEM (Rigdon, 2012; Rigdon et al., 2017), based on either factor or component. Factor-based modelling focuses on individual factors, whereas component-based modelling employs a composite model composed of multiple components. Factor represents the immeasurable latent variable in attributes and traits by explaining its content and meaning; its main assumption is the covariation of all indicators with substantial correlation with one another. The manifest variables associated with factor are referred to as reflective indicators, and correspondingly, in the reflective model, the measurement model correlates the factors with their effect on respective indicators, whereas the manifest variables that form the component are called composite indicators (Bollen & Bauldry, 2011). Also, the corresponding composite model exhibits the link between components and their respective composite indicators (Bollen & Diamantopoulos, 2017; Henseler et al., 2014; Schuberth et al., 2018). The latent variables in this study are similar to common factors; therefore, the choice of AMOS package for modelling that is designed for factor-based SEM against PLS is meant for component-based SEM.
The research hypothesis postulated that TSLS exerts a significant impact on delivery of a construction project in Nigeria. The hypothesised path diagram of the initial model is depicted in Figure 3. SEM was employed to assess the level of interaction between factors of transactional leadership style and project success indicators. The hypothetical model comprises two latent constructs of TSLS and PPIs with eight and seven measurement variables, respectively, after skewness and kurtosis test.
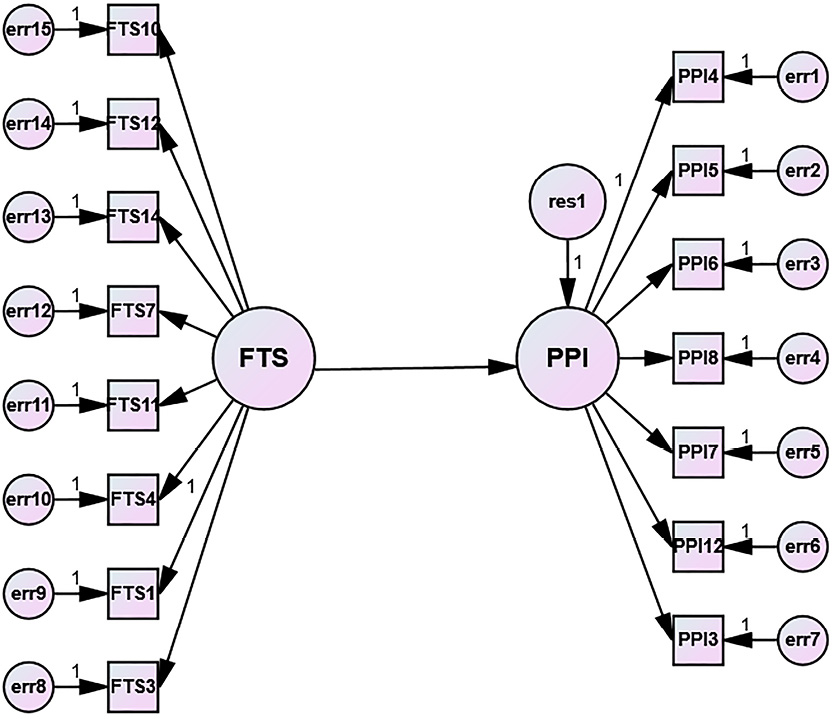
Figure 3. Initial path model for transactional leadership and project delivery.
Exploratory factor analysis (EFA) and the factor extraction model: EFA was conducted to ascertain the level of confidence in the measurement model, such that the most feasible model is arrived at during SEM. Consequent upon the outcomes of data screening, especially skewness and kurtosis, measurement items of transactional leadership style (TSLS) were reduced to eight and those of PPIs to seven. EFA of the 15 variables was done to identify the factor structure. This is in line with the same procedure adopted by Ikediashi and Mbamali (2014). Two major procedures of rotation and extraction in EFA were followed. Whilst the procedure of extraction helped in determining the underlying components of variables (Brown, 2015; Morin et al., 2016), the rotation process uses the loading pattern in such a way that makes interpretation easier. PCA was employed to extract variables whilst varimax rotation, a form of orthogonal model, was employed to perform factor analysis.
The results of factor extraction are presented in Table 7, with criterion of Eigenvalue > 1 used for extracting factors. This helped in identifying five factors that accounted for 62.00% of the total variance in the model. The confirmation or otherwise of the proposed factor structure was made possible by principal axis factoring through Varimax rotation. By this, such items with a factor loading below 0.4 were dropped as they are perceived to be weak indicators and are likely to interfere with the outcome of analysis (Byrne, 2010). The factor extraction model comprises eight items of TSLS and seven items of PPIs, out of which only five factors were extracted.
Loading of measured variable on latent factors: The results of the factor loading of indicator variables on the latent construct of transactional leadership styles and project performance indicators are displayed through a pattern matrix presented in Table 8. Included in Table 8 are the factors that comprise the first attempt of the measurement model. It reveals a relatively high loading of indicators on the construct as any loading less than 0.5 is discarded.
Confirmatory factor analysis (CFA), model specification, and estimation: A two-stage process of establishing the measurement model’s confidence level and strength was performed with CFA prior to running the final SEM model. This process enables the checking of validity and modification (where necessary) of the measurement model in spite of its being grounded on sound and proven theory. Whenever a causal link connecting the latent constructs and respective measurement variables is specified a priori by a hypothesised and conceptualised model grounded in theory, CFA enables the determination of fit between them and the observed data (Mohamed, 2011). Through the use of an acceptable threshold of goodness-of-fit (GOF) indices also referred to as a model in general (Byrne, 2010), this was established.
The outcome of EFA and factor extraction in Table 7 shows the extraction of five factors that contributed significantly to the initial model. The measurement model in the CFA was assessed using two main approaches: evaluation of model fit through GOF indices and validity/reliability of the measurement model.
Goodness-of-fit indices
Absolute fit, incremental fit, and parsimonious fit indices are the three key fits measuring indices in SEM. CFA was done on the measurement model with, first, all the 15 factors thrown up as a result of skewness and kurtosis test as the initial model and, second, all the 6 factors that contributed significantly to the model as extracted from loading on components in a pattern matrix shown earlier in Table 8. These six factors are “Enjoy applying sanctions to punish employees for wrongly executed work” (FTS7), “At times slow in attending to problems on site” (FTS10), “Usually focus attention on handling errors and failures” (FTS11), and “Continually pay attention to non-compliance and departure from standard” (FTS12) that loaded on component 2 of the pattern matrix, and “Lead to improved project team satisfaction” (PPI4) and “Increase the level of productivity” (PPI5) loaded on component 5 of the same matrix. All the factors loaded on component 2 represent the passive management with the exception of the TSLS.
The evaluation of the measurement model using the SEM output of the initial model shows the significance of chi-square statistics at P < 0.05. However, the data fit to the model was unsatisfactory and thus rejected. Meanwhile, there are other reliable main indicators of model specification and evaluation such as GFI, AGFI, CFI, NFI, and RMSEA used in assessing model fit satisfaction that were employed. AMOS 23 output of the initial model shows inconsistency of results of these fit indices with allowable threshold values displayed in Tables 9 and 11.
| Estimates | Recommended values | References |
|---|---|---|
| Factor loading | >0.5 acceptable; >0.7 good | |
| Critical ratio (t-value) | >1.96 | Hair et al. (2018); Byrne (2010) |
| Standard residuals | 2.8 | Byrne (2001); Hair et al. (2018) |
| Standard regression weight (SRW) | >0.5 | Byrne (2010), Kline (2016). |
| Square multiple correlation (SMC) | >0.25 | Byrne (2010), Kline (2016). |
Consequent upon the result of the model fit indices of the initial model, which is at variance with recommended values, further review was done to refine and re-specify the model for improvement and to arrive at a better model fit as suggested by Kline (2016). The process for model refinement stipulates that factor coefficient or standard regression weight (SRW) must be above 0.5 with the value of squared multiple correlation (SMC) also above the 0.25 cutoff point of Kline (2016). Additionally, Hair et al. (2018) recommended standard residual values to be above 2.58 or below −2.58 (Table 9).
Subsequent review and evaluation of the initial unfit model resulted in dropping all such factors with a loading of less than 0.5 until the final fit model shown in Figure 4 was achieved. Fulfilling these requirements led to dropping factors with an SRW of less than 0.5 (Byrne, 2010). The final fit model thus has four measurement items of TSLS and two of PPIs with AMOS 23 output estimates shown in Table 10, which satisfy the recommendation of Byrne (2010) that a minimum of two factors each is required to perform SEM analysis. Other conditions for a fit model as required in Table 9 were satisfied by the model. The estimates, critical ratio, SRWs, and SMCs as output of the AMOS 23 package for the constructs TSLS and PPI are all well above the recommended limits. The measurement items of the constructs are statistically significant to the model with P-value < 0.05 and at a high confidence level of 95%.
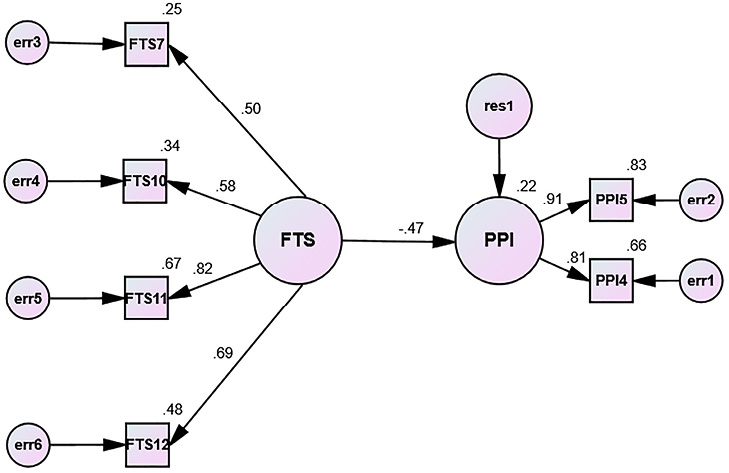
Figure 4. Final SEM for transactional leadership and project delivery.
Based on the outcome of SEM analysis, Figure 4 shows the path diagram with SRWs indicated on each of the arrows linking observed variables to their latent construct, showing a direct relationship with the construct whilst the variables’ SMCs are displayed on each depicting a measurement rectangle (Table 10). The contributing factors for TSLS are “Usually focus attention on handling errors and failures” (FTS11), “Continually pay attention to non-compliance and departure from standard” (FTS12), “At times slow in attending to problems on site” (FTS10), and “Enjoy applying sanctions to punish employees for wrongly executed work” (FTS7), which are mainly passive management by the exception component. Those of PPI are “Lead to improved project team satisfaction” (PPI4) and “Increase the level of productivity” (PPI5)—an aspect of stakeholders’ expectation. Another indicator that explains the strength of influence of variables of transactional style on performance is the SMC of each of the variables. This helps to know the degree of variability in the dependent variables that are accounted for by the predictors, with either direct or indirect influence.
The assumption of SEM is that each of the variables in the estimates is dependent; meanwhile, its approaches have a unique feature of being able to analyse various dependent variables together at once. Based on the output, a PPI with SMC of 0.219 implies that 21.9% of the variance in projects’ success indicators is accounted for by the passive management variables of transactional style. The implication therefore remains that variables of transactional styles (passive management component) reduce project performance by 21.9%. The negative SRW of −0.47 is indicative of the negative direct effect of (passive management by exception) factors of transactional style of leadership on project delivery. This signifies a direct opposite relationship between the model constructs. Although a satisfactory model fit was achieved as shown in Table 11, the positively hypothesised relationship (H1) between predictor and predicted constructs was not supported even when they are statistically significant.
| Index measure | Sources | Recommended | Initial model | Final model |
|---|---|---|---|---|
| Normed chi square (χ2/df) | Bryne (2010). Zulu (2007) | 1.0 < χ2/df < 3.0 1.0 < χ2/df<5.0 (acceptable fit) | 26.47 | 4.921 |
| Goodness-of-fit index (GFI) | Bryne (2001); Hair et al. (2019) | >0.90 | 0.69 | 0.987 |
| Root mean square error of approximation (RMSEA) | Tabachnick and Fidel (2007) | <0.05 good fit <0.08acceptable Fit | 0.162 | 0.06 |
| Normed fit index (NFI) | Molenaar et al. (2000) | >0.90 | 0.43 | 0.978 |
| Comparative fit index (CFI) | Kline (2016) | >0.90 | 0.44 | 0.983 |
| Adjusted goodness-of-fit index (AGFI) | Bryne (2010); Hair et al. (2019) | >0.90 | 0.59 | 0.965 |
| Incremental fit index (IFI) | Molenaar et al. (2000) | >0.90 | 0.38 | 0.983 |
Assessment of the statistical significance of parameter estimates was based on critical ratio and P-values. The P-values of most variables as indicated in Table 10 show that they are less than 0.05, thus implying an existence of a significant influence of transactional leadership style on performance. However, the influence is weak and negative, considering the fact that among the factors of transactional leadership styles, factors of passive management by exception contributed significantly to the model as observed in the loading of factors on component in the pattern matrix. Note that factors of TSLS have three aspects of contingency rewards, and active and passive management by exceptions.
Model validation and CFA results
After having conducted CFA to confirm the measurement model parameters of unidimensionality, reliability, and validity of measures, coupled with stipulated two-stage process and outcome obtained, then comes the model validation. The outcome of model fit measure indices for the survey and the adopted threshold limits is shown in Table 11. The major fit indices (χ2, GFI, AGFI, RMSE, NFI, CFI, and IFI) of the initial model fell outside the threshold limit; therefore, further detailed examination was done for the refinement and re-specification of the model to enable the improvement of discriminant validity, thereby realising optimum model fit as suggested by Byrne (2010) and Kline (2016). The model fit is validated by the SEM output that satisfied the threshold displayed in Table 10. This was achieved by subjecting the initial model to continuous review and evaluation where all the paths with less than 0.5 regression weight were discarded as they did not contribute significantly to the model until a final fit model was realised.
Discussion of results
The objective was achieved by examining the effects the measurement indicators of TSLS known as factors of transactional leadership (FTS) exert on PPIs. Based on the statistical significance of the model estimates (output of AMOS 23 shown in Table 10), the model measurement indicators of all constructs were adjudged significant (with the general P-values < 0.05 and at 95% confidence level for all the estimates); however, the hypothesis is not supported and thus rejected. Both critical ratio (CR) and P-values were used as test statistics to assess whether the parameters estimated are statistically significant or not. The path diagram in Figure 4 shows a negative direct effect of (passive management by exception aspect) transactional style on projects’ success indicators. The FTS to PPI standardised regression weight of −0.47 and CR of −11.565 is a significant but negative relationship and therefore leads to the rejection of postulated hypothesis. This is interpreted to mean that the more the usage of this component of TSLS in project delivery, the lesser the level of team members’ productivity and satisfaction. All the assertion still remains valid and significant, but in this case, it is a reflection of the research measurement variables of the transactional leadership construct that contributed significantly to the model. Therefore, factors of TSLS that contributed to the model had a negative direct effect on success indicators in the study area. The crucial aspect of indicators affected is productivity level (PPI5) and project team satisfaction (PPI4), which subsequently may have dire consequences on cost and schedule overruns of the entire project. This is expected as literature had shown that passive management by the exception component of TSLS is alien to the construction industry. The study outcome revealed this with a squared multiple correlation of 0.219 that implies that 21.9% of the total variance in PPI is explained by passive factors of TSLS. The negative regression weight of −0.47 shows much of the direct negative impact TSLS exerts on team member productivity (PPI5) and level of satisfaction (PPI4). Thus, passive management by the exception component of TSLS reduces this dimension of performance by 47%, which is a concern to project stakeholders and the firm as the consequential effect on cost and time results in the nonrealisation of organisation and project goal. This outcome corroborated the submission of Rotimi et al. (2021) that passive management by the exception component is a major deterrent to workers’ performance, and therefore, it is thus affirmed detrimental to construction project performance in Nigeria. Oyetunji et al. (2019) earlier concluded that TSLS exerts significant positive impacts on employees’ performance in Nigeria, but did not mention which component, whether wholly or partially. Just as suggested by Buba and Tanko (2017) that inappropriate choice of leadership style could have a negative consequence on project delivery, it is thus attested by this research outcome. The two earlier researchers had conflicting reports on the influence of TSLS on workers’/employees’ performance. While Rotimi et al. (2021) was categorical about the exact component of TSLS—passive management, Oyetunji et al. (2019), however, was silent on it. Also, the conclusion of Mabasa and Eresia-Eke (2022), who reported the negative correlation of the passive component with workers’ commitment in South African enterprises, supports the study’s finding.
The passive component of TSLS delays the involvement of PM until the problem had escalated, thereby hindering the contingency reward mechanism, which is an appropriate sanction/punishment as proposed by the contingency theory. This component encourages ambiguity, discourages useful feedback from PM, contrary to transactional theory, and therefore eventually results in low team productivity and satisfaction. The current survey, therefore, brings to the fore the implication of adopting the passive management component of TSLS on project delivery. Its impact on level of productivity and project team satisfaction is a testament of its disadvantage to project delivery in Nigeria and the global construction industry.
The negative influence is a result of only the passive management by exception variables of TSLS that contributed to the model. The implication of this finding is that it enables project managers to filter through and improve upon the positive style that had already been in use and discard those not yielding positively on their construction product output, especially those of the passive components of TSLS.
Conclusion and recommendation
The SEM approach was used to test the validity of the hypothesis postulated. The hypothesis that stated that TSLS exerts a significant impact on project performance is thus rejected. After model identification, specification, estimation, and validation, the finding from the result is that usage of passive management by the exception component of TSLS has a negative influence on project delivery in the study area. This was the result of negative values of test statistics used to assess whether estimated parameters are statistically significant. The main reason for this is the indicators of the construct that contributed significantly to the model, which are negative in form to what is expected of PM generally. The general submission by the respondent is that passive management by exception components of TSLS has a significant negative influence on project delivery indices of “Lead to improved project team satisfaction” and “Increase the level of productivity” in the Nigerian construction sector. In essence, this component of TSLS is anti-productive to construction projects and an adversity to the industry. Previous researchers concluded that passive management by the exception component is a major deterrent to workers’ performance. However, through this study, it is a deterrent not only to worker’s performance but also to project performance.
The study revealed the existence of negative impacts of TSLS (especially passive management component) on project deliveries in the area of project team satisfaction and workers’ productivity. The findings beckon on construction practitioners especially PM to shift attention to all such required during the construction process to ensure that project team members are satisfied if not optimally but averagely, as this will enhance their level of productivity; otherwise, the project suffers. The eventual consequence of lack of satisfaction and productivity is schedule and cost overrun, which culminates in the derailment of project objective. Moreover, self-appraisal by PM intended at ensuring best approach as a leader is maintained consistently, and pleasing all workforce on a project is impracticable but could be improved through feedback from the team.
The study findings using the multivariate method of analysis underscore its attribute as a unique attempt at unraveling new ideas about this aspect of leadership style and hence possibly to the awareness of entire stakeholders in the industry. Additionally, the significance of the study stems from the variables of the latent constructs (predictor and predicted) that contributed significantly to the model, which are oftentimes not considered relevant during the construction phase but have the potential to derail the project goal. Furthermore, engagement of the SEM technique to unravel the negative effect of transactional variables on project outcomes, though a rarity, introduces another dimension to the leadership aspect of management discourse as previous researchers only mentioned the effect on worker’s performance. The study has theoretically established empirical evidence of the negative interaction of passive management by the exception component of TSLS, thereby enriching the dearth of literature and removing its implicative or appropriated assertion in project management discourse.
The conclusion therefore is that contingency reward and active management by the exception aspect of TSLS may work in the study area where passive management has failed. Therefore, passive management by exception with negative effect on construction projects should be avoided in its entirety.
Based on the outcome, the study therefore recommended the following:
1. Project managers in the study area can adopt other components of transactional leadership except passive management by exception.
2. The scope of the research should be widened to cover other regions for optimum generalisation of findings.
3. Further research should investigate the departure from a priori hypothesis witnessed in this survey by shaping the construct relationship so as to unravel the basis for negative correlation and find out its applicability across different populations/samples.
4. Another noticeable limitation that requires further study is the introduction of either mediating variable of team commitment or moderating variable of organisation culture to enrich the study outcomes based on the new level of interaction that will ensue.
References
Abbas, M., & Ali, R. (2021). Transformational versus transactional leadership styles and project success: A meta-analytic review. European Management Journal. https://doi.org/10.1016/j.emj.2021.10.011
Achoba, M. I., Majid, R. B. A., & Obiefuna, C. O. (2021a). Relationship between window and view factors in the workplace: A SEM approach. International Journal of Built Environment and Sustainability, 8(2), 103–113. https://doi.org/10.11113/ijbes.v8.n2.667
Achoba, M. I., Majid, R. B. A., & Obiefuna, C. O. (2021b). The relationship between workplace window and seating arrangement. IOP Conference Series: Materials Science and Engineering, 1051(1), 012103. https://doi.org/10.1088/1757-899X/1051/1/012103
Agaa, D. A. (2016). Transactional leadership and project success: The moderating role of goal clarity. Procedia Computer Science, 100, 517–525. https://doi.org/10.1016/j.procs.2016.09.190
Ali, H., McCutcheon, R., Pitt, M., & Anumba, C. (2020). Leadership competencies for construction professionals: A review. Engineering, Construction and Architectural Management.
Allen, M., Alleyne, D., Farmer, C., McRae, A., & Turner, C. (2014). A framework for project success. Journal of Information Technology and Economic Development, 5, 1–17.
Al Malki, M. & Wang, J. (2018). Leadership styles and job performance: A literature review. Journal of International Business Research and Marketing, 3(3), 40–49. https://doi.org/10.18775/jibrm.1849-8558.2015.33.3004
Anantatmula, V. S. (2015). Strategies for enhancing project performance. Journal of Management in Engineering, 31, 1–8. https://doi.org/10.1061/(ASCE)ME.1943-5479.0000369
Aule, T. T., Majid, R. B. A., & Jusan, M. B. M. (2022a). Exploring cultural values and sustainability preferences in housing development: A structural equation modeling approach. Scientific Review Engineering and Environmental Studies, 31(3), 149–160. https://doi.org/10.22630/srees.2971
Aule, T. T., Majid, R. B. A., & Jusan, M. B. M. (2022b). Influence of agricultural activities on housing and settlement patterns of rural communities in Benue State, Nigeria. Journal of Agriculture and Crops, 8(4), 283–292. https://doi.org/10.32861/jac.84.283.292
Babbie, E. R. (2020). The practice of social research (15th ed.). Cengage Learning.
Bans-Akutey, A. (2021). The path-goal theory of leadership. Academia Letters, Article 748. https://doi.org/10.20935/AL748
Bollen, K. A., & Bauldry, S. (2011). Three Cs in measurement models: Causal indicators, composite indicators, and covariates. Psychological Methods, 16(3), 265–284. https://doi.org/10.1037/a0024448
Bollen, K. A., & Diamantopoulos, A. (2017). In defense of causal-formative indicators: A minority report. Psychological Methods, 22(3), 581–596. https://doi.org/10.1037/met0000056
Brown, T. A. (2015). Confirmatory factor analysis for applied research (2nd ed.). Guilford Press.
Byrne, B. M. (2010). Structural equation modeling with AMOS: Basic concepts, applications and programming (3rd ed.). Routledge.
Ceri-Booms, M., Curseu, P. L., & Oerlemans, L. A. (2017). Task and person-focused leadership behaviors and team performance: A meta-analysis. Human Resource Management Review, 27(1), 178–192. https://doi.org/10.1016/j.hrmr.2016.09.010
Creswell, J. W. (2014). Research design: Qualitative, quantitative, and mixed methods approaches (4th ed.). SAGE Publications.
EPM. (2019). Path-goal theory of leadership [Video]. https://youtu.be/62Hs-4QJf5Q
Fareed, M. Z., Su, Q., & Aslam, M. U. (2023). Transformational leadership and project success: The mediating role of psychological empowerment. SAGE Open., 13(1). https://doi.org/10.1177/21582440231154796
Hair, J. F., Black, W. C., Babin, B. J., & Anderson, R. E. (2014). Multivariate data analysis (7th ed.). Pearson Education.
Hair, J. F., Risher, J. J., Sarstedt, M., & Ringle, C. M. (2019). When to use and how to report the results of PLS-SEM. European Business Review, 31(1), 2–24. https://doi.org/10.1108/EBR-11-2018-0203
Henseler, J., Dijkstra, T. K., Sarstedt, M., Ringle, C. M., Diamantopoulos, A., Straub, D. W., ... Calantone, R. J. (2014). Common beliefs and reality about PLS: Comments on Rönkkö and Evermann (2013). Organizational Research Methods, 17(2), 182–209. https://doi.org/10.1177/1094428114526928
Ikediashi, D. I., & Mbamali, I. (2014). Modelling the impact of outsourcing decisions on facilities management service-level performance: A case of Nigeria’s public hospitals. Construction Management and Economics, 32(11), 1130–1147. https://doi.org/10.1080/01446193.2014.961497
Ikediashi, D. I., & Ogwueleka, A. C. (2014). Assessing the use of ICT systems and their impact on construction project performance in the Nigerian construction industry. Journal of Engineering, Design and Technology, 14(2), 252–276. https://doi.org/10.1108/JEDT-08-2014-0047
Jarad, G. H. (2012). The construction manager leading characteristics for the success of construction projects in the Gaza Strip (Master’s thesis, The Islamic University of Gaza).
Johan, S., & Piet, S. (2014). Does measurement theory impact project performance? Procedia - Social and Behavioral Sciences, 119, 635–644. https://doi.org/10.1016/j.sbspro.2014.03.071
Kennedy, I. (2022). Sample size determination in test-retest and Cronbach alpha reliability estimates. British Journal of Contemporary Education, 2(1), 17–29. https://doi.org/10.52589/BJCE-FY266HK9
Kerzner, H. (2017). Project management: A systems approach to planning, scheduling, and controlling. John Wiley & Sons.
Kline, R. B. (2016). Principles and practice of structural equation modeling (4th ed.). Guilford Press. www.guilford.com
Koeslag-Kreunen, M., Van den Bossche, P., Hoven, M., Van der Klink, M., & Gijselaers, W. (2018). When leadership powers team learning: A meta-analysis. Small Group Research, 49(4), 475–513. https://doi.org/10.1177/1046496418764824
Kyeremeh, A., & Kamewor, T. F. (2023). The performance implications of sustainable project management in emerging economies: Does operational excellence matter? International Journal of Academic Research in Business and Social Sciences, 13(12), 589–607.
Lamb, R. (2013). How can managers use participative leadership effectively? http://www.task.fm/participative-leadership
Liphadzi, M., Aigbavboa, C., & Thwala, W. D. (2015). Relationship between leadership styles and project success in the South African construction industry. Procedia Engineering, 123, 284–290. https://doi.org/10.1016/j.proeng.2015.10.091
Livingston, S. A. (2019). Test reliability—Basic concepts. Educational Testing Service. ETS Research Memorandum Series.
Mabasa, T., & Eresia-Eke, C. (2022). Facets of the transactional leadership style of black top-managers and employee commitment in state-owned enterprises. Journal of Contemporary Management, 19(1), 1–20. https://doi.org/10.35683/jcm21083.153
Malhotra, N. K. (2020). Marketing research: An applied orientation. Pearson Education.
Management Adda. (2019). Leadership theories [Video]. https://youtu.be/WOtBp0D85LI
Maqbool, R., Sudong, Y., Manzoor, N., & Rashid, Y. (2017). The impact of emotional intelligence, project managers’ competencies, and transformational leadership on project success: An empirical perspective. Project Management Journal, 48(3). https://doi.org/10.1177/875697281704800304
Mohamed, S. (2011). System dynamics modelling of construction safety culture. Engineering, Construction & Architectural Management, 18(3), 266–281. https://doi.org/10.1108/09699981111126179
Morin, A. J. S., Marsh, H. W., & Nagengast, B. (2016). Exploratory structural equation modeling. Psychological Methods, 21(4), 336–356.
Northouse, P. G. (2016). Leadership: Theory and practice (7th ed.). Sage Publications.
Nowlis, S., Kahn, B. E., & Dhar, R. (2022). Coping with ambivalence: The effect of removing a neutral option on consumer attitude and preference judgments. Journal of Consumer Research, 29(3), 319–334. https://doi.org/10.1086/344431
Oke, A. E., & Aigbavboa, C. O. (2022). Leadership competence and its impact on construction project success. International Journal of Construction Management.
Oyaya, O. W. (2017). Influence of leadership style on performance of construction projects: A case of housing projects in Westlands Sub-County, Nairobi, Kenya (Master’s thesis, University of Nairobi).
Owusu Manu, D. G., Debrah, C., Amissah, L., Edwards, D. J., & Chileshe, N. (2021). Exploring the linkages between project managers’ mindset behaviour and project leadership style in the Ghanaian construction industry. Engineering, Construction and Architectural Management, 28(9), 2690–2711. https://doi.org/10.1108/ECAM-03-2020-0149
Oyetunji, A. K., Adebiyi, J., & Olatunde, N. A. (2019). Leadership behavior and worker performance in the Nigerian construction industry. The Journal of Value-Based Leadership, 12(2), 1–18. https://doi.org/10.22543/0733.122.1264
Price, J. J. (2009). The conception and operationalization of leadership in construction companies (Master’s thesis, University of South Africa).
Project Management Institute. (2021). A guide to the project management body of knowledge (PMBOK® guide) (7th ed.).
Rigdon, E. E., Sarstedt, M., & Ringle, C. M. (2017). On comparing results from CB-SEM and PLS-SEM: Five perspectives and five recommendations. Marketing ZFP, 39(3), 4–16. https://doi.org/10.15358/0344-1369-2017-3-4
Rotimi, F. E., Brauner, M., Burfoot, M., Naismith, N., Silva, C., & Mohaghegh, M. (2024). Challenges faced by women in New Zealand’s construction industry and the impact of demographic factors. Construction Economics and Building, 24(4/5), 114–141. https://doi.org/10.5130/AJCEB.v24i4/5.8911
Rotimi, J. O. B., Witton, F., & Rasheed, E. O. (2021). The predictive power of managers’ leadership attributes on workers’ performance: A case of the New Zealand construction industry. International Journal of Construction Management, 23(7), 1214–1222. https://doi.org/10.1080/15623599.2021.1964919
Schuberth, F., Henseler, J., & Dijkstra, T. K. (2018). Confirmatory composite analysis. Frontiers in Psychology, 9, 2541. https://doi.org/10.3389/fpsyg.2018.02541
Taherdoost, H. (2016). Sampling methods in research methodology: How to choose a sampling technique for research. International Journal of Academic Research in Management, 5(2), 18–27. https://doi.org/10.2139/ssrn.3205035
Toor, S., & Ofori, G. (2008). Leadership vs. management: How they are different, and why. Leadership and Management in Engineering, 8(2). https://doi.org/10.1061/(ASCE)1532-6748(2008)8:2(61)
Tuhul, H. S., El-Hamouz, A., Hasan, A. R., & Jafar, H. A. (2021). Development of a conceptual framework for occupational safety and health in Palestinian manufacturing industries. International Journal of Environmental Research and Public Health, 18(3), 1338. https://doi.org/10.3390/ijerph18031338
Wu, G., Zheng, J., Liu, D., et al. (2023). Effects of organizational leadership on project citizenship behaviour and management performance in complex construction projects. Buildings, 13(1), Article 259. https://doi.org/10.3390/buildings13010259
Yusuf, A. M., & Aibinu, A. A. (2019). Effect of leadership styles on construction project performance. Journal of Construction Engineering and Management.
Zulu, S. (2007). Impact of project management on project performance: A structural equation modelling approach. Association of Researchers in Civil Engineering.