Construction Economics and Building
Vol. 25, No. 3/4
December 2025
RESEARCH ARTICLE
Enhancing Profitability and Cost Efficiency in China’s Construction Industry
Lin Xiaoa,c, Noor Aisyah Mokhtara,*, Mohd Khairul Azhar Mat Sulaimana
a Department of Architecture and Built Environment, Faculty of Engineering and Built Environment, Universiti Kebangsaan Malaysia, 43600 UKM Bangi, Selangor, Malaysia
b Universiti Putra Malaysia, Faculty of Humanities, Management and Science, 97000, Bintulu, Sarawak, Malaysia
c Art College of Sichuan Technology and Business University, 611745, No. 65, Xueyuan Street, Pidu District, Chengdu, China
Corresponding author: Lin Xiao, aisyahmokhtar@ukm.edu.my
DOI: https://doi.org/10.5130/AJCEB.v25i3/4.9660
Article History: Received 07/03/2025; Revised 11/08/2025; Accepted 21/08/2025; Published 05/12/2025
Citation: Xiao, L., Mokhtar, N. A., Sulaiman, M. K. A. M. 2025. Enhancing Profitability and Cost Efficiency in China’s Construction Industry. Construction Economics and Building, 25:3/4, 1–21. https://doi.org/10.5130/AJCEB.v25i3/4.9660
Abstract
This paper aims to investigate the profitability status and cost structure of the construction industry in China, as well as to conduct a case study analysis on the profit gap and differences between industries for cost drivers and strategies for taking returns. Using descriptive statistics, multiple regression, Monte Carlo simulation, and cluster analysis, this study draws from national statistics, industry reports, and company financial statements to determine the influence labor costs, material prices, and taxes have on earnings. The study finds that there is a substantial return distribution across sub-sectors: residential construction shows shorter projects lives and higher returns, while the long-term nature of civil engineering (and associated infrastructure) results in lower profitability despite large capital outlays. The biggest headwinds appear to be material and labor costs, while tax burdens compound the issues. While Monte Carlo simulations quantify the uncertainty of profitability, cluster analysis is used to detect the cost–profit structure and offers insights for developing focused efficiency strategies. In addition to operational effectiveness and resilience, some measures are encouraged like lean construction, digitalization (BIM and AI), and prefabrication, advancing public–private partnerships. They are actionable insights for policymakers and industry leaders to inform evidence-based cost containment, strategic investment, and sustainable growth in construction.
Keywords
Construction Profitability; Cost Structure Optimization; Monte Carlo Simulation; Cluster Analysis; China Construction Industry
Introduction
Background
The building and construction industry is a key driver of China’s gross domestic product (GDP), employment, and infrastructure development, and it is an important sector of the Chinese economy. In 2023, the sector constituted 6.8% of China’s GDP, indicating its strategic position in the country’s economic development (National Bureau of Statistics of China, 2023). Furthermore, this business segment remains one of the main creators of employment with over 50 million workers, making it a key player in urbanization and the economic framework. However, as long as financial markets continue to be affected by labor costs, material prices, and regulations, the construction industry will remain vulnerable to instability. Effective change order management is crucial for project cost control, especially in residential projects where frequent design changes can lead to increased labor and material costs (Mohammad and Hamzah, 2019). The Chinese government continues to account for a rising share of construction spending. However, the pace of expansion is slowing now that financing is tighter, environmental regulations are tougher, and the property market is declining. These government-led construction investments and development measures are becoming more difficult for construction firms to make profitable and competitive in terms of cost.
On the world stage, the benefits of the Chinese construction industry are not comparable to those of developed economies like the U.S. and Europe, where the majority of advanced cost management models and e-transformation strategies have already been implemented, bringing higher efficiency. Because of its time lag and capital intensiveness, infrastructure construction is indispensable to long-term economic growth. It also demands close attention to financing mechanisms and financial management due to its late-stage financial return (Hwang et al., 2020). The digital transformation and the green building market in the construction industry will have a significant impact on cost structures and profitability. These trends in digital transformation and the growth of the green building market will have a significant impact on cost structures and profitability. The adoption of Building Information Modeling (BIM) and artificial intelligence (AI) is often cited as a driver of digital transformation, and utilizing these technologies can lead to improved resource allocation and efficiency (Zhang et al., 2020). For example, BIM enhances project visualization and helps with design coordination, preventing rework and enabling better resource management. Similarly, the incorporation of AI and blockchain into smart contracts is expected to offer solutions for efficient supply chain management and financial forecasting. The rise of green building practices, fueled by government incentives and environmental regulations, has also been a draw. Green practices reduce man-made environmental effects and increase cost savings and profitability in the long run (Wang and Li, 2021). This methodology combines the novel technologies and advances discussed previously and paves the way for new frontiers regarding cost savings and environmentally sustainable construction.
Objective of the study
While previous studies have focused on macroeconomic effects or industry-wide surveys, this paper aims to improve the understanding of the financial performance of Chinese construction companies. Specifically, the paper examines the sector cost structure and sources of revenue that affect profitability, taxation, and operational efficiency (Yu et al., 2023). This information is important for policymakers and managers to use in strategic planning and developing financially sustainable practices (Wang and Yuan, 2011). This article paper addresses three related research questions (Table 1).
| Research question | Corresponding study objective |
|---|---|
| What are the main cost components for construction enterprises in China? | To identify the primary cost categories (e.g., labor, materials, taxes, and regulatory fees) affecting different construction subsectors. |
| What is the influence of labor costs, material expenses, and tax policies on financial performance and profitability? | To assess how external and internal cost factors impact project-level and firm-level profitability in the construction industry (Yu et al., 2023; Xie et al., 2022). |
| What strategies can be used to optimize costs and improve profitability and long-term viability? | Propose practical, industry-specific strategies to reduce costs, improve performance, and achieve financial sustainability across each sub-sector. |
This study evaluates project performance in terms of budget execution and operational efficiency through a systematic analysis of cost-to-income ratios, return on investment (ROI), and profitability. Thus, the study bridges the gap between theoretical cost management frameworks and the empirical reality of the Chinese construction industry.
Literature review
Overview of construction industry profit models
Much research has been conducted on cost estimation models, cost drivers, financial risk, and the effect of digitalization on cost efficiency to better understand the profit models in construction. Precise cost estimation and expenditure control are important for minimizing overruns and achieving profitability. While the relationship between cost estimates, budgets, and project success has been established, conventional models lack real-time analytics and AI-based forecasting, which significantly limit their flexibility in dynamic markets. According to Kim and Reinschmidt (2012), the enterprise-level profit is affected by organizational efficiency, market position, and financial management systems. In China, material and labor expenses are the primary cost components (Zhang and Wang, 2023); therefore, process innovations and supply chain efficiency are likely to impact profit. However, current models generally do not consider the effects of regional taxes and regulations on enterprise financial efficiency.
Because the construction industry is capital-intensive and subject to distinct market fluctuations, it bears greater financial risks. As Wang and Li (2021) suggested, “The intensification of competition will lead to the compression of profit margins, but cost efficiency will still be of great significance for firms.” The China-style construction sector is facing three financial problems: government curbs on finance, difficulties in the real estate market, and changes in tax policy. The debt levels of developers and local governments are also making financial planning more difficult. Although there are several models for industry risk assessment, there are no AI-based predictive applications that evaluate long-term risks or optimize investment strategies.
Previous research on profitability and cost structures
Some recent research concerning the Chinese construction industry focused on profitability and cost features, as well as well-being. For instance, Xian et al. (2019) employed data envelopment analysis to examine the trade-offs between environmental and cost efficiencies within the industry. They discovered notable disparities in resource utilization and pollution. In another study, Wen et al. (2020) examined the relationship between the environment and the economy of the construction industry using a multi-regional input–output model. They emphasized the industry’s energy intensity and environmental impact. Construction costs can be categorized into two main types: labor costs and material costs. However, there are other, less visible costs due to regulations, funding constraints, or taxes that equally or even more greatly affect profitability but have received little attention in the literature. Effective implementation of environmental management accounting can help identify such hidden costs and improve the overall financial performance of construction companies (Hassan, Maelah and Palil, 2018). A recent systematic review revealed the inconsistent use of key performance indicators (KPIs) in cost control, particularly at the project level. Technological advancements, such as BIM and AI, have the potential to enhance resource use and financial performance. However, they are costly to implement and have not been widely adopted, particularly among small- and medium-sized enterprises (SMEs). Epic infrastructure projects, such as China’s high-speed rail, are often financed with long-term debt, raising concerns about long-term financial sustainability. Ansar et al. (2016) posited that such mega-infrastructure developments can introduce economic fragility rather than robust economic development if not controlled well.
International experience and China’s challenges
Cost overruns and project delays are widespread in the global construction industry. Insufficient funding, design modifications, and inefficient management were also identified as the main reasons affecting cost and schedule performance in the Tripoli Road Construction Project in Libya (Alfakhri, Ismail and Khoiry, 2018). However, countries exhibit greatly varying levels of cost control and efficiency gains within projects. For instance, the Netherlands is renowned for its ability to mitigate cost overruns in railroad and bridge projects. On average, cost overruns on its rail projects are 11%, which is much lower than in other regions of Northwest Europe (27%) and other regions (44%) (Cantarelli et al., 2013). These results suggest that the locale and types of national governance significantly impact cost performance at the project level. Regarding project management, implementation phase duration, project size, and project ownership type were all significantly related to cost overruns. Research has also suggested that implementation duration and project size are factors associated with an increased likelihood of cost overruns. Furthermore, cost overruns are more frequent in public than in private projects, but only in countries without an effective system of accountability (Flyvbjerg et al., 2010).
In terms of sustainable building, countries like Singapore and the UK pursue national strategies by taking a proactive stance in promoting sustainable building practices through conducting research and development (R&D) and issuing industry guidelines. For example, Singapore’s government published the Sustainable Singapore Blueprint in 2009 and established the S$50 million Built Environment Research Fund in 2007 to advance sustainable research (Building and Construction Authority of Singapore, 2023). Conversely, China has invested heavily in infrastructure, yet has made little profit, failed to reduce debt, and exposed itself to the vulnerabilities that come with being an economy. Extensive infrastructure investment in China has been found to not generate positive risk-adjusted value, but rather induce structural instability and economic fragility in financial markets (Ansar et al., 2016). Furthermore, systematic underestimation of project cost estimates is an international phenomenon. Research has shown that cost estimates for many public works projects are extremely underreported, and China’s are no different. This may not be a case of general misestimation, but rather, deliberate deception (Flyvbjerg et al., 2010).
In summary, to better ensure the profitability and economic efficiency of the Chinese construction industry, the country should learn from international experience, strengthen project management, improve the system of checks and balances, and promote green construction. Meanwhile, China also needs to solve existing policy problems, such as low investment returns, debt servicing risks, and cost deviations, to implement sustainable development in the construction industry.
Gaps in current research
Despite the growing body of literature on profitability and cost structure in China’s construction industry, there are gaps in the existing research. Most of the existing research has focused on large firms, providing little insight into the cost pressures and financial constraints that smaller companies face. This is significant because SMEs are a major component of the construction industry. Furthermore, many studies in the present era rely heavily on cross-sectional data. Only a few studies adopt a longitudinal perspective on changes in profit rates to account for the impact of economic cycles or policy interventions. Although firm-level performance measures are examined, project-level indicators (e.g., budget performance, return on investment, and life cycle cost gains) remain understudied. Recent reviews underscore the importance of detailed project-level assessments that inform enterprise-level strategy. Although BIM and AI are acknowledged as revolutionary technologies, few empirical studies have examined their financial implications, particularly in China’s specific environmental and economic landscape. Furthermore, the Chinese building industry has significant regional differences in cost factors, policies, and resources. Only a few studies offer region-specific economics, which limits the applicability of macro results to investment levels. Addressing these gaps is essential for developing rigorous and comprehensive cost optimization guidelines that can ensure the construction sector’s long-term financial and economic viability.
Methodology
Data sources
The study uses a quantitative research design based on statistical modeling and econometric tools to analyze the profitability and cost structure of the construction industry in China. The main data source is the 2023 China Statistical Yearbook, which was compiled by the National Bureau of Statistics of China (NBS). The yearbook contains detailed statistics on gross output value, completed floor space, revenue, expenses, and profitability for each industry subsector (NBS, 2023). To improve the robustness of the analysis, additional data were collected from industry reports and company annual reports. These sources include market overviews, competitive forces, and companies’ financial statements. Thus, they contribute to the data and provide a multifaceted view of the industry’s financial performance. Monte Carlo simulation was used to carry out risk analysis and estimate uncertainty in cost. For example, unmanned aerial system (UAS) applications have been used in earthwork volume estimation to improve measurement accuracy and reduce measurement costs (Romeli, Zakaria and Ishak, 2023). This stochastic method considers cost and financial risk variations, providing a more comprehensive view of expected results (Deng and Jian, 2022). Incorporating project management approaches, such as earned value management (EVM) and life cycle cost analysis (LCCA), helps evaluate cost structures at the enterprise and project levels. Furthermore, big data analytics and machine learning algorithms are used to handle and analyze massive datasets. These advanced analytics, such as clustering and classification algorithms, help uncover the main sources of profitability or cost efficiency. Accordingly, they offer more insight into the financial reality of the construction business (Gong et al., 2023).
Analytical approach
This study employs a structured analytical framework to directly address three research questions: identifying cost components, examining influencing factors, and proposing optimization strategies for China’s construction industry. For Research Question 1 (key cost components), we employed descriptive statistics to calculate indicators such as means, standard deviations, and distributional statistics for key financial variables (e.g., gross output value, floor area, revenue, expenses, and industry-specific profitability). These statistics provide a comparative analysis of cost components across industries. For Research Question 2 (the impact of labor costs, material costs, and tax policies), we employed econometric models to examine the causal relationship between independent variables (revenue, labor costs, material costs, tax-related variables, and firm type) and profitability. Under the assumptions of linearity, independence, homoscedasticity, and normality, we estimated a multivariate linear regression model using ordinary least squares. The coefficient size and statistical significance of the model indicate the impact of each cost driver on profitability at the firm and project levels.
To investigate Question 3 (optimization strategies), we employed additional analytical tools. Machine learning algorithms (such as clustering and classification) identify patterns in cost performance and group projects according to their financial characteristics, highlighting both high and low efficiency (Tayefeh Hashemi, et al., 2020). While this study primarily employs descriptive and econometric techniques, its conceptual framework draws on established tools such as LCCA and EVM to structure the discussion of long-term cost efficiency and performance evaluation (Abdul-Rahman et al., 2015). The overall process is outlined in Figure 1, which outlines six phases: data collection, preprocessing, statistical analysis, modeling, results analysis, and report writing. Preprocessing ensures data consistency and comparability; statistical analysis detects correlations, significant patterns, and outliers; modeling quantifies the impact of cost drivers; results analysis interprets the findings and tests their robustness; and the synthesis phase integrates empirical evidence with policy implications. This integrated, problem-driven approach ensures that each analytical step is clearly linked to one of the three research objectives, thereby providing a coherent, evidence-based understanding of the financial drivers of profitability and cost structure in China’s construction industry (Castro Miranda et al., 2022).
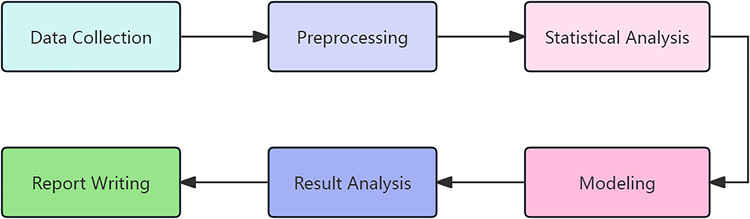
Figure 1. Data analysis process flowchart
Metrics for profit and cost structure analysis
Only the key financial indicators of construction enterprises in China were referred to, such as revenue, cost, liabilities, and revenues. According to the basis of the tendering stage, revenue in the construction industry mostly includes contracted project value, project completion value of self-completed projects, and completion value of subcontracted projects. Table 2 shows the total contracted value of residential buildings, as well as civil engineering and other infrastructure projects, which are the two primary sources of income for construction contractors. The total contracted value from construction units in 2022 was 296,799,900,700 RMB (NBS, 2023), reflecting the magnitude of construction activities. Furthermore, breaking down the income sources (self-completed vs. subcontracted values) contributes to understanding the financial inflow from each sector and shows that the residential building sector contributes the most to the total contracted value.
Construction project expenditures are classified as direct or indirect costs. These costs include the necessary labor, materials, and equipment for the construction project. Indirect costs include A&G, accounting, sales, and sometimes R&D. Total output and completion in each construction sector provide additional evidence of this, highlighting railway, civil engineering, and hydraulic engineering. Table 3 provides an overview of how these projects contribute to the value of each sector’s output. A more detailed analysis of the margin and costs per output by project type is necessary.
Construction material suppliers must link revenues and costs by examining the combined effects of both sides of the income statement on the company’s profitability profile, especially the relationships between them and their impact on company performance. Ultimately, they must participate in defining the value chain that transforms business drivers into profitability or loss.
Expected outcomes
According to this study, there were differences in profitability and cost structure among sectors of the Chinese construction industry. The project size, the local economic situation, and the building category were identified as factors that influence financial performance. For instance, housing and infrastructure projects generate higher income; however, they also incur higher costs due to their complexity and scale (Chuai et al., 2021). An examination of cost management revealed differences in the staff-to-material-to-subcontracting ratio. These differences indicate a lack of uniformity in cost control measures throughout the industry (Gong et al., 2023). These results have practical ramifications for construction managers and policymakers. Tailored approaches that take industry characteristics into account can increase profitability, reduce risk, and achieve higher cost efficiency. Furthermore, relying on uniform cost planning methods may result in predictable financial patterns for certain construction types.
The sensitivity analysis in Figure 2 shows that output per employee has the most significant positive impact on profitability (+50.31%), further demonstrating that productivity improvements are the primary driver of construction companies’ financial performance (Rajala, Yl-Kujala, Sinkkonen and Krri, 2023). In contrast, variables such as R&D expense ratio and fixed asset intensity per employee exhibit negative sensitivities, which echoes previous research showing that, in some cases, overinvestment in R&D or capital can suppress short-term profitability (Hartwig and Kockat, 2016). The regression coefficients and 95% confidence intervals in Figure 3 further illustrate these dynamics: the financial expense ratio exhibits a significant positive correlation with profitability, while the R&D expense ratio maintains a negative correlation. These relationships are consistent with earlier research on cost structure optimization and project delivery efficiency (Chan and Park, 2005; Oo, Drew and Lo, 2007). The limited effect of completion rates is similar to findings from research on workplace conditions, in which nonfinancial factors, such as job attractiveness and employee happiness, indirectly influence economic outcomes (Yokouchi, Ambe, Fujisaki-Sueda-Sakai and Ozawa, 2024). Taken together, these results suggest that targeted improvements in labor productivity and financial management may yield the greatest earnings gains, while unbridled increases in certain spending categories should be viewed with caution.
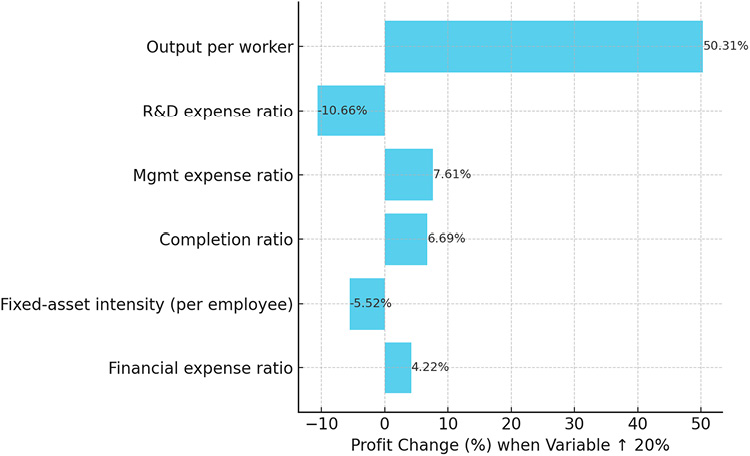
Figure 2. Sensitivity analysis of profitability drivers (20% increase scenario)

Figure 3. Regression coefficients with 95% confidence intervals (horizontal layout)
Results
Total output and completion value
The construction industry has always played a significant role in China’s economic growth and has developed at a high rate as a fundamental part of China’s output and completion value. Figure 4 shows the significant sectoral trend of the total output value of various construction disciplines. The total output value of railway, road, tunnel, and bridge engineering is about 623.5 billion RMB, which is greater than the total output value of the construction installation industry and building decoration, renovation, and other construction industries. This indicates that the total output value differs by industry sector. Construction completion value, i.e., the value of completed construction projects, is displayed as a scatter plot in Figure 3. It can be seen that completion values vary greatly across different industries. Conversely, hydraulic and waterway engineering promises far greater value than its total output. The likely reason is that the state prefers large projects.
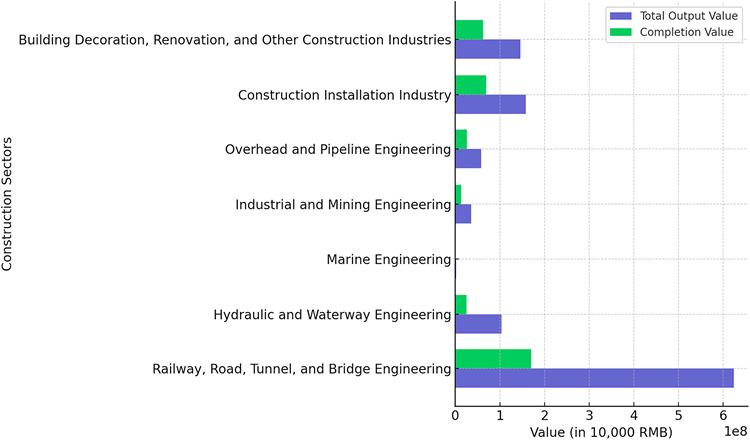
Figure 4. Total output value and completed value for construction sectors
Moreover, the gross production value of the construction industry as a whole is concentrated in the three major infrastructures listed in Table 3, and the total values refer to the actual investment completed in these sectors. Although railway, road, tunnel, and bridge engineering have the highest total output value at 623.5 billion RMB, the completion value was just 169.86 billion RMB. This suggests that this sector has a number of long-term projects that have not yet been completed. Building decoration, renovation, and other construction industries have a relatively high completion ratio compared with other industries, reflecting the faster in-project turnover of these industries. However, project lifetime differences are highlighted by such long-term project-based industries as energy, manufacturing, and resources. These industries have a more pronounced gap between full-run output and completed projects, though it is far less ambiguous (Figure 3 and Table 4). This reaffirms China’s commitment to infrastructure-based economic growth.
Building area and completion area by sector
In China, the differences in building and finished areas between regions are much more dramatic. The finished construction area nationwide was 998.31 million m2 and grew 17.0% from the same period in 2022. Residential buildings accounted for the largest share, with 724.33 million m2 completed, up by 17.2%. This upward pressure on residential construction reflects a much bigger urbanization trend and the necessity for housing in China. Meanwhile, the total floor space of all newly started buildings amounted to 953.76 million m2, down by 20.4%, indicating that new property projects remained lackluster. Figure 5 shows the annual differences between finished and new starts by sector.
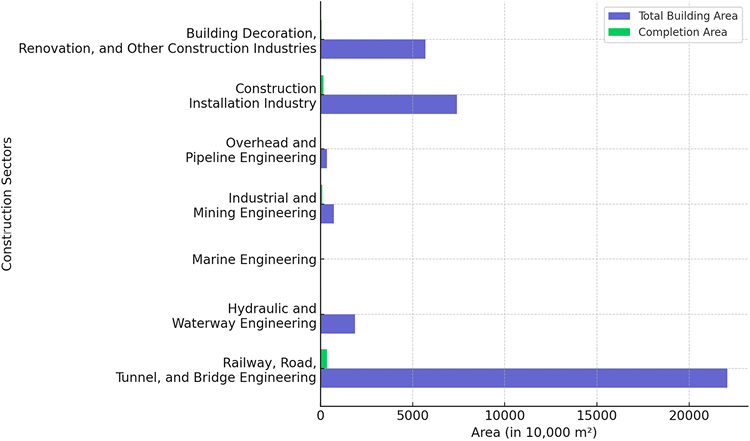
Figure 5. Total building area and completion area by sector
By sector, residential buildings dominate the building stock and working floor area. Office buildings were down by 9.4% in 2023, while commercial businesses were up by 16.9%. This change comes as economic conditions continue to shift, and companies reconsider how much commercial real estate they need. A more detailed sector-wise view of building and completion areas is shown in Table 5. The enormous expansion of the residential construction industry has been the foundation of government policies to raise living standards and promote urban migration. The significant growth seen in the large project pipeline continues to be counterbalanced by the reduction in new projects, indicating a cautious approach by developers in light of the current economic situation.
Revenue and cost breakdown
The financial condition of China’s construction industry is related to income and spending. In 2021, the industry’s output value was approximately 8,013.85 billion RMB, which equaled 7% of the national GDP. However, the profit margin was much lower at 2.9%, compared to 6.8% in the manufacturing sector (NBS, 2022). This demonstrates the need to examine the industry’s specific profit and cost structures. The industry is divided into three segments: residential building construction, non-residential building construction, and civil engineering construction. Residential building construction is the largest segment and is driven by the increasing demand for construction work. On the other hand, infrastructure projects are expensive due to their high investment and low margin. They take much longer and are subject to many regulations. In terms of expenses, labor is also a key cost because staffing levels are high. Additionally, raw material costs are a significant consideration since they directly impact pricing. Product costs increase due to administrative and implementation costs, such as project management and compliance. Figure 6 shows the respective shares of revenues and expenses by construction sector. Figure 7 shows the revenue and cost analysis process flowchart. A numerical summary is also provided in Tables 6 and 7 regarding the distribution of financial resources in the industry.
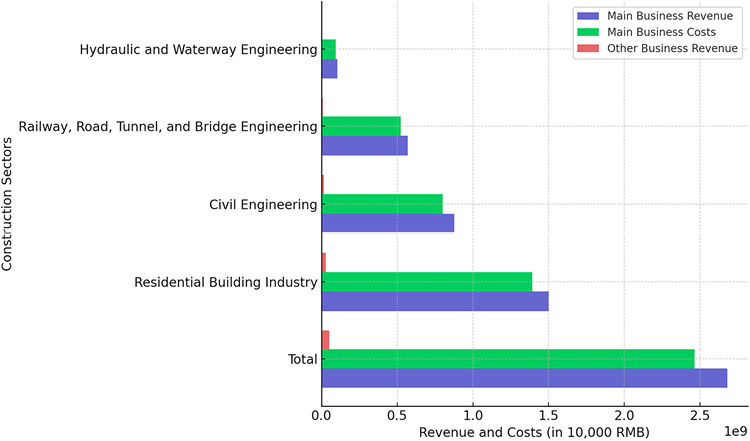
Figure 6. Breakdown of main business revenue and costs

Figure 7. Revenue and cost analysis process flowchart
Profitability metrics
Figure 8 compares the total profits, income taxes, and main business taxes and surcharges for the three major construction industries: railways, highways, tunnels, and bridges; civil engineering; and residential construction. The residential construction industry has the highest total profits, while civil engineering, despite similar tax contributions, has slightly lower profitability. The railway, highway, tunnel, and bridge industries have the lowest total profits but relatively lower tax burdens. These differences highlight how the operating models, market conditions, and cost structures of specific industries influence economic efficiency. This is consistent with the observation of Ingrige (2016): while profitability indicators are crucial for assessing financial performance, they should be interpreted within a broader strategic and contextual framework, particularly in an environment influenced by external pressures such as regulatory changes, disaster risk reduction priorities, and resilience goals. Incorporating these contextual factors ensures that profitability assessments go beyond short-term gains to consider the industry’s evolving social and environmental responsibilities.
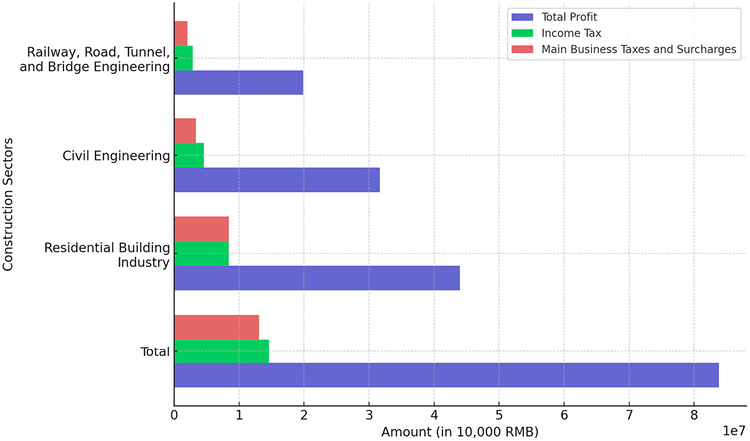
Figure 8. Profit margin, tax rates, and economic efficiency
In recent years, the development of policies and the market has led to high volatility in the profit index of China’s construction industry. The industry also experienced a slowdown in revenue growth in 2025, with an anticipated deceleration to 4%–7%, down from the projected growth of 7%–10% in 2023. This trend is the result of a high revenue base and a moderate pace of growth for new orders (S&P Global, 2024). Although revenue expansion was projected to decline, a slight increase in profitability was anticipated due to tighter management of selling and administrative expenses and possibly a lower receivables impairment ratio. Table 6 illustrates growth rates in revenues year over year and presents revenue and profit margins of the biggest companies, respectively.
The Monte Carlo cost–benefit uncertainty analysis in Figure 9 reveals an average profit margin of 3.1% within a relatively narrow 95% confidence interval, indicating moderate volatility in profitability across the simulated scenarios. This probabilistic approach aligns with prior applications of Monte Carlo methods to construction cost and risk assessment, enabling stakeholders to more effectively incorporate uncertainty into financial forecasts (Hu, Nippala, Kallioharju and Pelsmakers, 2022; Cheah and Liu, 2006). The cost–profit cluster analysis in Figure 10 reveals distinct sub-industry groupings based on cost ratios and profit margins, demonstrating that strategic segmentation can reveal patterns in operational efficiency and profitability drivers. These findings are consistent with research on cost structure optimization in demolition projects (Pun, Liu and Langston, 2006), innovative classification of strategic decisions (Lim and Ofori, 2007), and enhancing industry competitiveness using a technology clustering framework (Al-Bizri and Gray, 2010). Furthermore, the application of clustering techniques to map profitability patterns reflects emerging approaches in construction research, such as blockchain-based cluster analysis, which can identify interrelated performance factors (Elbashbishy, Ali and El-adaway, 2022). Overall, these results highlight the value of combining probabilistic simulation with cluster-based analysis to inform evidence-based profitability strategies in the construction industry.
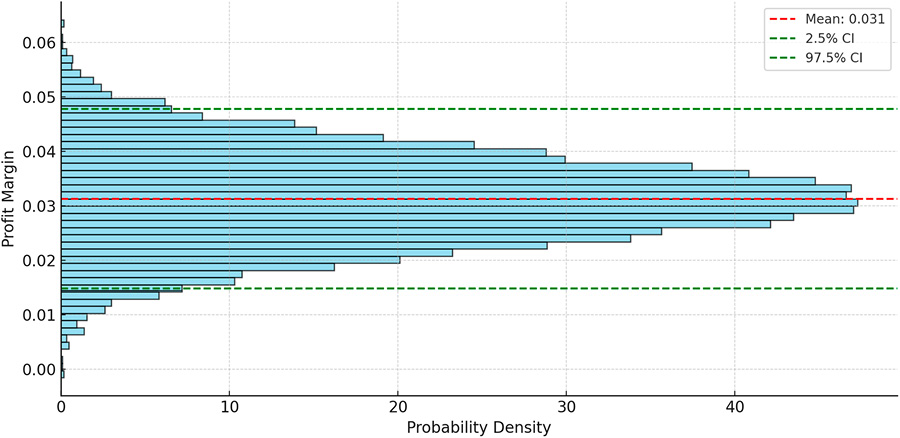
Figure 9. Monte Carlo cost–benefit uncertainty diagram
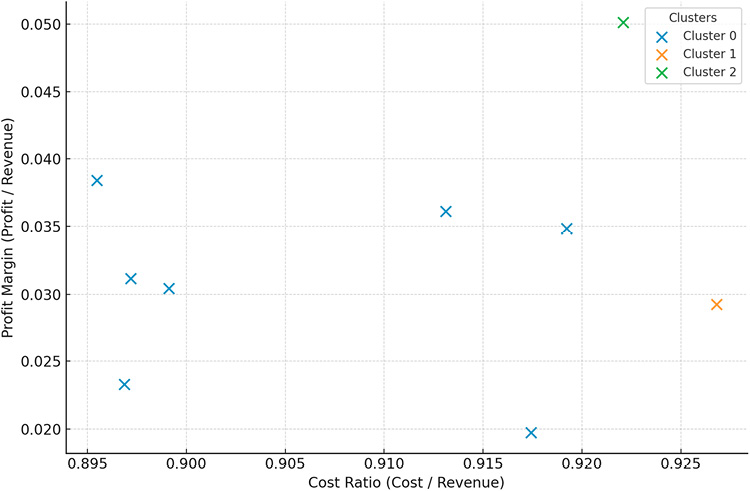
Figure 10. Cost–profit clustering of construction industry subsectors
While larger construction companies make up a large part of the overall amount, there are marked differences in the quality of profit growth. China Communications Construction’s main revenue soared by 116.32% in the past 10 years, and CSCEC’s main revenue rose by 202.14%. Net income for the two companies increased by 57.37% and 142.73%, respectively. These numbers suggest that, for example, CSCEC was growing its revenue base in a larger or faster way and improving profitability in a more effective manner. Figure 11 plots the cumulative profit margins of these firms over the considered timeframe, while Table 9 compares metrics for these efforts.
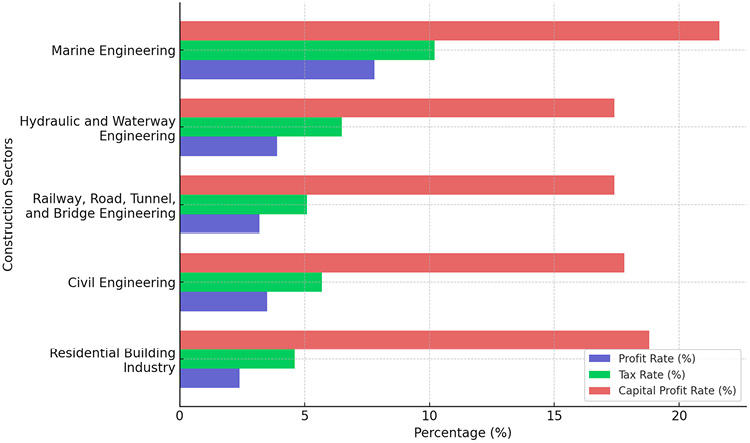
Figure 11. Key profitability indicators, such as profit rate and tax rate
Additional economic variables, such as those external to the construction sector, also influence this sector’s profitability. The persistent woes in the property market, with falling home prices and a bulging supply of homes, have dragged down the profit margins of builders. For instance, new house prices in China were stable in January 2025 as sales were softer than initially expected despite a government effort to revive market sentiment. While it is easy to simply say that in times of a slump, especially at a time when established developers are feeling the pinch even, this is more evidence that the industry needs serious fiscal discipline and planning to weather the economic storm and make money.
Discussion
Components with the highest cost sensitivity
Regarding the first research question, the regression results (Figure 11) show that the ratio of material costs to labor costs has the largest negative coefficient on profitability, which is statistically significant (p < 0.05). Specifically, a one percentage point increase in any cost category is associated with a 0.15–0.18 percentage point decrease in profitability. Monte Carlo sensitivity simulations further confirm this conclusion, showing that the 95% uncertainty interval for material costs is within ±12% of the mean, while the fluctuation range for labor costs is ±9% of the mean. This makes them not only the most volatile items in China’s construction industry but also one of the most critical inputs affecting operational efficiency. Residential projects have higher average profit margins than public infrastructure projects, primarily due to shorter project cycles and faster revenue realization. In contrast, civil engineering projects such as railways, roads, and bridges, while producing larger total outputs, have lower economic returns due to longer investment horizons, high fixed capital intensity, and a complex tax system. As shown in Table 10, surcharges and capital-based taxes further erode infrastructure returns, resulting in a significantly lower profitability (0.04) for civil engineering projects than for residential projects. These quantitative results confirm that contract manufacturing, raw materials, and taxes are the most influential cost components for optimizing gross profit, providing a concrete, data-driven basis for developing targeted cost control strategies.
The least efficient sectors in the cost structure
When evaluating return on investment, infrastructure (particularly public works projects such as transportation) is the least cost-effective sector, a finding supported by descriptive statistics and previous research (Wang and Yuan et al., 2011). As shown in Table 8, transportation-related civil engineering projects have the highest cost ratio, reaching 0.93, and correspondingly low profitability, averaging approximately 0.03. In contrast, residential and shipbuilding projects exhibit faster cash flow turnover, higher profit margins, and more efficient cost structures. Railway, highway, and other large-scale infrastructure projects underperform not only due to their long delivery cycles and capital ties, but also due to persistent cost overruns and increasing regulatory surcharges. High capital taxes and compliance costs further erode returns, magnifying the impact of extended payback periods. In contrast, niche markets such as residential construction and marine engineering maintain lower cost ratios (0.90–0.91) and higher profitability (up to 0.04), offering greater potential for optimization. These patterns highlight the need for a targeted efficiency strategy in the infrastructure-intensive civil engineering sector, where improvements in capital structure, taxation, and cost control mechanisms must work in tandem to enhance financial flexibility.
Recommended strategies and policy tools
Based on the patterns revealed by our empirical analysis, several targeted strategies can be recommended to address the third research question. Clustering results (Figure 10) show that Cluster 1 (residential construction and marine engineering) outperforms other sub-sectors, with a cost ratio between 0.90 and 0.91 and a profitability of 0.04. Cluster 3 (infrastructure-intensive civil engineering, including railways and roads) has the highest cost ratio (0.93) and the lowest profitability (0.03). These differences highlight where interventions could have the greatest impact. Lean construction practices, which streamline processes and eliminate waste, are particularly beneficial in labor-intensive clusters. The adoption of digital technologies such as BIM and AI-based planning tools—which has been shown to improve scheduling performance and reduce rework (Zhang et al., 2020)—aligns well with the operational profiles of the top-performing residential and marine clusters, where shorter cycle times can amplify the benefits of efficiency gains. Digital transformation, combined with design for manufacturing and assembly (DfMA) approaches, can further improve cost-effectiveness (Abd Razak, Khoiry, Badaruzzaman, Hussain and Zain, 2023). Public–private partnerships (PPPs) are particularly well-suited for infrastructure clusters with low profitability; by enabling companies to operate as both contractors and asset operators, PPPs can reduce financing risks and diversify revenue streams (Hwang et al., 2020), thereby increasing the financial resilience of capital-intensive projects. Supply chain hedging through long-term procurement contracts and bulk purchases can mitigate material price volatility found in Monte Carlo sensitivity analyses, which show an uncertainty range of ±12%. Prefabrication and modular construction methods reduce labor requirements and shorten delivery times, with precast concrete structures offering significant cost and time advantages in the residential sector (Naz, Abro, Memon and Ahmed, 2023). Government subsidies for energy-efficient, green buildings can improve profitability and sustainability by reducing the tax burden (a key determinant of our regression results), while utilizing oil industry by-products as alternative materials can offer further cost savings and environmental benefits. Finally, strategic project selection should prioritize high-ROI sectors, digitalization, adoption of PPPs, and sustainable construction practices (such as cleantech-driven geopolymer composites) that offer pathways to long-term financial sustainability while reducing life cycle maintenance costs.
Conclusion and future work
Conclusion
This study provides empirical evidence on the profitability and cost structure of China’s construction industry, directly addressing three research questions: (1) the extent of profitability differences across sub-sectors; (2) the underlying cost drivers; and (3) the strategic implications of different business models. The results show significant differences in profitability, primarily driven by differences in cost structure, project size, payback period, and tax uncertainty. While residential real estate projects tend to generate higher revenues, they are constrained by high tax rates and volatility. In contrast, infrastructure investments such as railways, roads, and bridges have lower profit margins due to their long investment cycles and high capital intensity. Table 10 shows descriptive statistics that support this finding. Civil and marine engineering projects have the lowest cost ratios (0.91 and 0.90, respectively), and the highest profitability (0.04), while residential and general infrastructure projects have higher cost ratios (up to 0.93) and lower profitability (0.03). These contrasts highlight disparities in financial effectiveness between construction sub-industries and suggest the need for construction-specific strategies. Deeper analysis confirms that materials and labor are still the primary cost drivers, and companies are eager to optimize sourcing and digitize the supply chain. Specialty subcontractors demonstrate greater cost efficiency and a faster ability to recoup capital than general contractors, which underscores the importance of specialized capabilities in sustaining profitability. Furthermore, companies with more revenue bases and PPP models are more resilient to market shocks. This supports the idea that diversified institutions are valuable alternative risk management strategies.
The findings provide actionable insights for policymakers and industry leaders, offering a data-driven foundation for cost control and investment planning in specific industries. By identifying cost–profitability patterns and efficiency drivers, the study supports evidence-based resource allocation and risk aversion. However, the scope of the study is limited by the limited availability of aggregate industry-level data, which restricts analysis of firm-level behavior, and the cross-sectional nature of the dataset, which cannot capture temporal dynamics. Future research should incorporate longitudinal data, explore firm-level heterogeneity, and integrate advanced modeling techniques such as machine learning and scenario simulation to better predict profitability under different market and policy conditions.
Future work
Future work may apply econometric models to evaluate the impact of digital technologies, including AI-based cost forecasting, blockchain-based contract management, and real-time analytics, on financial transparency and project performances and not only to benchmarking descriptive measures. More importantly, rigorous studies are required to examine the impacts of environmental policy, carbon tax, and green building incentives on the firm-level financial sustainable development. Because of changes in the macro- and microstructural conditions of the real estate market in China, research also needs to focus on construction firms’ adaptability and long-term stability levels that they can sustain under the influence of the fiscal and monetary policies designed to stimulate the macroeconomy. This research will provide a programmatic structure applicable to understanding wider industrial reforms and the enhancement of efficiency, sustainability, and competitiveness in the construction industry in the developing world.
References
Abd Razak, M. I., Khoiry, M. A., Badaruzzaman, W. H. W., Hussain, A. H., & Zain, M. Z. M. (2023). Development of application framework for design for manufacturing and assembly towards digital and sustainable construction in Malaysia. Jurnal Kejuruteraan, 35(2), 351–360. https://doi.org/10.17576/jkukm-2023-35(2)-06
Abdul-Rahman, H., Wang, C., & Sheik Mohamad, F. (2015). Implementation of risk management in Malaysian construction industry: Case studies. Journal of Construction Engineering, 2015, 192742. https://doi.org/10.1155/2015/192742
Al-Bizri, S., & Gray, C. (2010). Management framework for technology clusters implementation. Construction Management and Economics, 28(7), 771–782. https://doi.org/10.1080/01446191003725170
Alfakhri, A. Y., Ismail, A., & Khoiry, M. A. (2018). The effects of delays in road construction projects in Tripoli, Libya. International Journal of Technology, 9(4), 766–774. https://doi.org/10.14716/ijtech.v9i4.2219
Ansar, A., Flyvbjerg, B., Budzier, A., & Lunn, D. (2016). Does infrastructure investment lead to economic growth or economic fragility? Evidence from China. Oxford Review of Economic Policy, 32(3), 360–390. https://doi.org/10.1093/oxrep/grw022
Building and Construction Authority. (2023). Annual report 2022/2023: Connecting the dots. Building and Construction Authority. https://www1.bca.gov.sg/docs/default-source/annual-report-2023/bca-ar23_full_report.pdf
Cantarelli, C. C., Flyvbjerg, B., & Buhl, S. L. (2012). Geographical variation in project cost performance: The Netherlands versus worldwide. Journal of Transport Geography, 24, 324–331. https://doi.org/10.1016/j.jtrangeo.2012.03.014
Castro Miranda, S. L., Conte, J. C., Jara, C. A., & Skarmeta, A. (2022). Predictive analytics for early-stage construction costs: A systematic literature review. Buildings, 12(7), 1043. https://doi.org/10.3390/buildings12071043
Chan, S. L., & Park, M. (2005). Project cost estimation using principal component regression. Construction Management and Economics, 23(3), 295–304. https://doi.org/10.1080/01446190500039812
Cheah, C. Y. J., & Liu, J. C. (2006). Valuing governmental support in infrastructure projects as real options using Monte Carlo simulation. Construction Management and Economics, 24(5), 545–554. https://doi.org/10.1080/01446190500435572
Chuai, X., Lu, Q., Huang, X., Gao, R., & Zhao, R. (2021). China’s construction industry-linked economy–resources–environment flow in international trade. Journal of Cleaner Production, 278, 123990. https://doi.org/10.1016/j.jclepro.2020.123990
Deng, J., & Jian, W. (2022). Estimating construction project duration and costs upon completion using Monte Carlo simulations and improved earned value management. Buildings, 12(12), 2173. https://doi.org/10.3390/buildings12122173
Elbashbishy, T. S., Ali, G. G., & El-adaway, I. H. (2022). Blockchain technology in the construction industry: Mapping current research trends using social network analysis and clustering. Construction Management and Economics, 40(5), 406–427. https://doi.org/10.1080/01446193.2022.2056216
Flyvbjerg, B., Skamris Holm, M. K., & Buhl, S. L. (2010). How common and how large are cost overruns in transport infrastructure projects? Transport Reviews, 23(1), 71–88. https://doi.org/10.1080/01441640309904
Gong, D., Zhao, X., & Yang, B. (2023). Big data adoption in the Chinese construction industry: Status quo, drivers, challenges, and strategies. Buildings, 13(1), 1891. https://doi.org/10.3390/buildings14071891
Hartwig, J., & Kockat, J. (2016). Macroeconomic effects of energetic building retrofit: Input–output sensitivity analyses. Construction Management and Economics, 34(2), 79–97. https://doi.org/10.1080/01446193.2016.1144928
Hassan, H., Maelah, R., & Palil, M. R. (2018). Factors affecting the implementation of environmental management accounting and the impact on the performance of a construction company in Malaysia. Asian Journal of Accounting and Governance, 10, 109–122. https://doi.org/10.17576/AJAG-2018-10-10
Hu, M., Nippala, E., Kallioharju, K., & Pelsmakers, S. (2022). Monte Carlo simulation approach to understand the cost variance for energy retrofit projects: Comparative study of Finland and the United States. Construction Management and Economics, 40(3), 207–222. https://doi.org/10.1080/01446193.2022.2034906
Hwang, B.-G., Shan, M., Zhu, L., & Lim, W.-C. (2020). Cost control in megaprojects: Efficacy, tools and techniques, key knowledge areas and project comparisons. International Journal of Construction Management, 20(5), 437–449. https://doi.org/10.1080/15623599.2018.1484976
Ingirige, B. (2016). Theorizing construction industry practice within a disaster risk reduction setting: Is it a panacea or an illusion? Construction Management and Economics, 34(7–8), 592–607. https://doi.org/10.1080/01446193.2016.1200735
Kim, H.-J., & Reinschmidt, K. F. (2012). Market structure and organizational performance of construction organizations. Journal of Management in Engineering, 28(2), 212–220. https://doi.org/10.1061/(ASCE)ME.1943-5479.0000082
Lim, J. N., & Ofori, G. (2007). Classification of innovation for strategic decision making in construction businesses. Construction Management and Economics, 25(9), 963–978. https://doi.org/10.1080/01446190701393026
Mohammad, N., & Hamzah, Z. (2019). A review of causes of variation order in the construction of terrace housing projects in Malaysia. MATEC Web of Conferences, 277, 03013. https://doi.org/10.1051/matecconf/201927703013
National Bureau of Statistics of China or NBS (2022). https://www.stats.gov.cn/sj/ndsj/2022/indexeh.htm
National Bureau of Statistics of China or NBS (2023). https://www.stats.gov.cn/sj/ndsj/2023/indexeh.htm
Naz, F., Abro, S. A., Memon, N. A., & Ahmed, N. (2023). Cost analysis and economical suitability of prefabricated concrete structures in building construction. Jurnal Kejuruteraan, 35(5), 1135–1143. https://doi.org/10.17576/jkukm-2023-35(5)-14
Oo, B. L., Drew, D. S., & Lo, H. P. (2007). Applying a random coefficients logistic model to contractors’ decision to bid. Construction Management and Economics, 25(4), 387–398. https://doi.org/10.1080/01446190600922552
Pun, S. K., Liu, C. L., & Langston, C. (2006). Case study of demolition costs of residential buildings. Construction Management and Economics, 24(9), 967–976. https://doi.org/10.1080/01446190500512024
Rajala, P., Ylä-Kujala, A., Sinkkonen, T., & Kärri, T. (2023). Building renovation business: The effects of specialization on profitability. Construction Management and Economics, 41(8), 687–702. https://doi.org/10.1080/01446193.2023.2192040
Romeli, N., Zakaria, A. A., Halil, F. M., Abd Ghapar, M. A. A., & Ishak, N. (2023). Earthwork volumetric estimation via unmanned aerial system application: Perception from Penang contractors. Jurnal Kejuruteraan, 35(3), 657–669. https://doi.org/10.17576/jkukm-2023-35(3)-13
S&P Global. (2024). China Engineering & Construction 2024 Industry Outlook. Retrieved from https://www.spglobal.com/_assets/documents/ratings/research/101592333.pdf
Tayefeh Hashemi, S., Ebadati, O. M., & Kaur, H. (2020). Cost estimation and prediction in construction projects: A systematic review on machine learning techniques. SN Applied Sciences, 2, 1703. https://doi.org/10.1007/s42452-020-03497-1
Wang, Y., & Li, S. (2021). Market concentration, market power, and firm growth of construction companies. Advances in Civil Engineering, 2021, Article 9990846. https://doi.org/10.1155/2021/9990846
Wang, J.-Y., & Yuan, H.-P. (2011). Major cost-overrun risks in construction projects in China. International Journal of Project Organisation and Management, 3(3–4), 227–242. https://doi.org/10.1504/IJPOM.2011.042030
Wen, Q., Hong, J., Liu, G., Xu, P., Tang, M., & Li, Z. (2020). Regional efficiency disparities in China’s construction sector: A combination of multiregional input–output and data envelopment analyses. Applied Energy, 257, 113964. https://doi.org/10.1016/j.apenergy.2019.113964
Xian, Y., Yang, K., Wang, K., Wei, Y.-M., & Huang, Z. (2019). Cost–environment efficiency analysis of construction industry in China: A materials balance approach. Journal of Cleaner Production, 221, 457–468. https://doi.org/10.1016/j.jclepro.2019.02.266
Xie, W., Liu, H., & Chen, X. (2022). Critical factors influencing cost overrun in construction projects: A fuzzy synthetic evaluation. Buildings, 12(11), 2028. https://doi.org/10.3390/buildings12112028
Yokouchi, N., Ambe, T., Fujisaki-Sueda-Sakai, M., & Ozawa, K. (2024). Workplace bullying and harassment in the Japanese construction industry: Prevalence and associations with subjective health and work attractiveness. Construction Management and Economics, 42(8), 741–757. https://doi.org/10.1080/01446193.2024.2325364
Yu, W., Huang, H., & Zhu, K. (2023). Enhancing construction enterprise financial performance through digital inclusive finance: An insight into supply chain finance. Sustainability, 15(13), 10360. https://doi.org/10.3390/su151310360
Zhang, X., Wu, Y., & Li, Q. (2020). The impact of Building Information Modeling on project cost performance: A meta-analysis. Automation in Construction, 114, 103120. https://doi.org/10.1016/j.autcon.2020.103120
Zhang, N., Zhu, Y., & Wang, R. (2023). Digital transformation in the Chinese construction industry: Status, barriers and impact. Buildings, 13(4), 1092. https://doi.org/10.3390/buildings13041092