Construction Economics and Building
Vol. 26, No. 1
2026
ARTICLES (PEER REVIEWED)
Evaluating the Quality of Publicly Available Construction Technology Data in Indonesia
Andira Triana Putri1, Toong-Khuan Chan2, Biemo Soemardi3,*, Muhamad Abduh3
1 Doctoral student in the Department of Civil Engineering, Faculty of Civil and Environmental Engineering, Institut Teknologi Bandung
2 Department of Engineering, La Trobe University
3 Faculty of Civil and Environmental Engineering, Institut Teknologi Bandung
Corresponding author: Biemo Soemardi, b.soemardi@itb.ac.id
DOI: https://doi.org/10.5130/h4g1we40
Article History: Received 24/01/2025; Revised 29/09/2025; Accepted 27/10/2025; Published 03/03/2026
Citation: Putri, A. T., Chan, T.-K., Soemardi, B., Abduh, M. 2026. Evaluating the Quality of Publicly Available Construction Technology Data in Indonesia. Construction Economics and Building, 26:1, 1–25. https://doi.org/10.5130/h4g1we40
Abstract
This study evaluated the quality of construction technology data across four categories—intrinsic, contextual, representation, and accessibility—and examined how these factors influence potential data use. The research adopted a qualitative approach, systematically identifying and assessing publicly available data sources on construction technology from government, academia, industry, and society. Government sources include research databases, technical reports, and patents; academic sources comprise Scopus and the local repository Science and Technology Index; and industry sources encompass annual reports and social media. The evaluation revealed that government data demonstrate the highest credibility and the most complete metadata, but were updated infrequently. Despite limited metadata, industry data remain reliable due to consistent annual publication schedules. Academic data show moderate quality, offering substantial datasets but with irregular update frequencies. Most data sources are available in English or Indonesian and are predominantly open access, except for subscription-based academic journals. In summary, the vast majority of construction technology data sources in Indonesia are either unstructured with limited information or semi-structured large databases from credible institutions with unpredictable or irregular updates, presenting challenges for technology landscape mapping. Government and Scopus databases show significant potential but require greater standardisation and, in the case of Scopus, advanced natural language processing-based extraction methods to maximise their utility for construction technology landscape development.
Keywords
Construction Technology; Construction Industry; Data Quality; Data Evaluation; Indonesia
Introduction
Indonesia’s construction sector is the largest in Southeast Asia and the fourth largest in Asia, behind China, India, and Japan (Asian Development Bank, 2022). In 2023, construction accounted for 9.9% of Indonesia’s gross domestic product, a notable increase from 5.7% in 2000 (Central Bureau of Statistics, 2024). In recent years, the government has made substantial investments in infrastructure to enhance the quality of life and stimulate economic growth, prioritising projects in the road, railway, port, and power sectors. This strategic focus recognises that expanded construction capacity and capability are essential prerequisites for realising the anticipated benefits of these capital investments.
Despite this expansion, the sector continues to face challenges in improving the efficiency, timeliness, and quality of project delivery. Addressing these issues requires both innovation and the adoption of advanced technologies. Paap’s (2022) concept of the technology landscape provides a useful foundation, offering a structured tool for technology knowledge management. Technology landscape mapping supports idea generation and strategy formulation by identifying trends in current and emerging technologies (Spitsberg, et al., 2013).
The process of technology landscape mapping involves assembling and analysing data to categorise technologies and identify trends. As Yan et al. (2020) argued, transforming the wealth of data generated throughout the life cycle of construction projects into actionable knowledge is vital for enhancing company performance and project success. The construction industry generates vast amounts of data across multiple disciplines, which, if effectively managed, can contribute to national development goals (Bilal et al., 2016; Kusuma et al., 2019).
Traditional product roadmaps are insufficient to meet Indonesia’s unique requirements for rapid infrastructure development and economic transformation. With a population of 280 million (Central Bureau of Statistics, 2025), Indonesia aspires to transition from a developing nation to a globally competitive economic powerhouse. The first milestone of the Golden Indonesia 2045 vision is to achieve a per capita income comparable to that of developed countries—approximately USD 23,000–30,300—and to rank among the world’s five largest economies (Government of Indonesia, 2024). Economic growth is projected to rise significantly, from 5.3% in 2025 to 8% in 2029 (Government of Indonesia, 2025).
To support these ambitions, the development of basic service infrastructure and regional connectivity was prioritised, recognising their crucial role in strengthening economic foundations and improving the quality of life. Achieving these goals necessitates the construction industry’s adoption of advanced technologies that can replace conventional methods characterised by resource inefficiency, environmental degradation, and suboptimal performance.
This research represents an initial effort to provide industry stakeholders with enhanced information resources for strategic technology implementation. Given its macro-level scope and the need for comprehensive industry-wide insights, technology landscape mapping (TLM) emerges as a more suitable methodological approach than traditional product roadmaps, which are typically designed for individual product or organisational contexts rather than sector-wide strategic planning.
Developing a technology landscape map for Indonesia’s construction sector requires a systematic evaluation of all available data on construction technologies. For the purpose of this study, technology data encompass all construction-related techniques, including material use, manufacturing processes, construction methods, plant and machinery, and tools for planning and project management, whether currently implemented or under development within the Indonesian construction sector.
The term technology landscape is widely used in innovation research and is commonly defined as a representation of potential technological innovation (Fleming, 2001; Fleming and Sorenson, 2001, 2004; Schilling and Green, 2011; Aharonson and Schilling, 2016; Arts and Fleming, 2018; Lee et al., 2020). Adapting this concept, the technology landscape in this study is defined as an instrument to present an overview of the technologies currently available in the construction industry. By applying this approach, Indonesia’s construction sector can better align with national development goals and meet the demands of an increasingly dynamic global economy.
This study aimed to assess the quality of construction technology data available in Indonesia in order to determine whether it can be effectively utilised to develop a technology landscape map. Specifically, the objectives were as follows: (i) to evaluate the reliability of available data, (ii) to examine the contextual relevance, and (iii) to assess its representation and accessibility.
The methodology builds on prior studies that evaluated data quality at the national level across different sectors using descriptive methods. For example, Afful-Dadzie and Afful-Dadzie (2017) conducted a web content and functionality audit for Open Government Data portals in Africa. Gomes and Soares (2014) analysed the types of data that users could extract from open public data portals across six European countries. Martin et al. (2017) assessed the quality of open health data at the federal, state, and city levels in the United States. Zheng and Gao (2016) examined open government data practices in various Chinese provinces and cities, including an evaluation of the nature and qualities of datasets provided.
In Indonesia, several initiatives have attempted to evaluate open data more broadly. Gunawan and Amalia (2016) assessed the implementation of open data in large cities, while Aryan et al. (2014) examined the effectiveness of open data in selected Indonesian online resources. However, no systematic study has yet evaluated the quality of construction sector data at the national level.
This research is the first to comprehensively survey construction technology data in Indonesia, drawing from government departments, academic institutions, online platforms, industry reports, and mass media sources. It is also the first to assess both the quantity and quality of such data at the national level. The lack of a centralised, organised repository remains a critical barrier to informed decision-making, often resulting in the duplication of effort within the sector.
By identifying high-quality sources of construction technology knowledge, the findings of this study will help guide stakeholders towards reliable information. In turn, this will support innovation, improve construction productivity and safety, and promote environmental sustainability across the industry.
Literature review
Spitsberg et al. (2013) developed the TLM as a systematic framework for capturing emerging technologies and linking them to business opportunities. In this framework, technologies are characterised by the attributes that describe their essence, maturity, and drivers of their development.
Building a TLM involved four key steps:
1. identifying and prioritising sources of information based on the objectives of the scouting effort,
2. filtering the technologies according to the drivers they address,
3. prioritising technologies based on their competitive position, and
4. constructing the TLM to visualise the technology space.
The initial steps in developing a TLM were to identify relevant information sources and assess their suitability. According to Ackoff (1989), data are the products of observations, representing properties of objects, events, and environments. To generate useful information, data must be analysed, a process in which computational methods are particularly effective. Data on new and emerging technologies can originate within the broader technology ecosystem, which encompasses a global community of organisations such as academic institutions, government agencies, research laboratories, consortia, corporations, start-ups, and suppliers. These data may also be shared through local and international technical organisations and societies (Spitsberg et al., 2013).
The concept of Open Data refers to data that are freely available for use and republication by anyone without restrictions imposed by copyright or patents (Braunschweig et al., 2012). The primary goal of open data initiatives is to make all non-personal and non-commercial data—particularly those collected and processed by government organisations—freely available (Braunschweig et al., 2012). Such availability promotes transparency, participation, and innovation across society (Braunschweig et al., 2012).
Wang and Strong (1996) defined data quality as data that are “fit for use” by consumers. Data quality dimensions are the constructs used to evaluate datasets, encompassing the criteria or features deemed essential for a particular task (Cho et al., 2021). They classified data quality into three categories: (1) the intuitive approach, (2) the theoretical approach, and (3) the empirical approach. The intuitive approach is applied when the selection of data quality attributes is based on researchers’ experience or informed judgement about which attributes are most relevant. The theoretical approach, in contrast, focuses on how data may become deficient during the process of data creation. Finally, the empirical approach involved analysing data collected from consumers to determine the characteristics they used to assess whether the data are fit for use.
The advantage of the intuitive approach is its flexibility, allowing researchers to select the attributes most relevant to their specific study. Scannapieco and Catarci (2002) argued that this approach may be sufficient when only a general introduction to the data quality problem is required.
Wang and Strong (1996) developed a hierarchical framework for organising data quality dimensions, capturing aspects of data quality most important to consumers. The framework comprises four categories:
1. intrinsic data quality—accuracy, objectivity, believability, and reputation;
2. contextual data quality—value-added, relevancy, timeliness, completeness, and appropriate amount of data;
3. representational data quality—interpretability, ease of understanding, representational consistency, and concise representation; and
4. accessibility data quality—accessibility and access security.
Intrinsic quality reflects the idea that data possess quality in their own right. Contextual quality emphasises that data must be appropriate for the specific task at hand. Representational and accessibility quality highlight the role of the systems that store and deliver data: systems should ensure that information is interpretable, understandable, manipulable, consistently represented, and at the same time both accessible and secure (Lee et al., 2002). Wang and Strong (1996) further stressed that high-quality data should be intrinsically sound, contextually relevant, clearly represented, and accessible to the end user.
This four-category framework has been widely applied in quality assessment and benchmarking (Lee et al., 2002), including the evaluation of information quality in product reviews (Chen and Tseng, 2011) and credit risk assessment (Moges et al., 2013). However, Batini et al. (2009) and Scannapieco and Catarci (2002) noted that no universal agreement exists on which dimensions define data quality or on the precise meaning of each dimension.
Paap (2020) emphasised that ideas do not arise spontaneously but are generated from the information available to the idea generator—specifically, knowledge about the nature of the need and the alternative technologies that may address it. Citing an MIT study from the 1960s conducted by Meyers and Marquis in support of NASA’s Apollo program, Paap identified two key insights: (i) the innovation pipeline begins with information on needs and technology as the foundation for ideas, and (ii) the presence of stages or phases throughout the development process provides opportunities to reassess whether continuing is worthwhile as new information emerges.
Innovation thus plays a crucial role in sustaining competitive advantage and responding to evolving industry demands (Sepasgozar and Davis, 2018). Over the past decade, the implementation of new technologies in construction practice has been increasingly recognised as a critical business strategy, attracting growing attention from diverse stakeholders (Chen et al., 2022). Substantial research demonstrates that new technologies have significant positive effects on overall construction performance, productivity, safety, and efficiency (Sepasgozar and Davis, 2018).
For organisations to innovate successfully, they must access the best possible information to guide their development efforts, along with up-to-date information on external factors influencing project outcomes (Paap, 2020). Information derived from a TLM can therefore support not only sourcing but also ideation and technology strategy (Paap, 2020).
Research methodology
This study set out to evaluate the quality of data on construction technologies in Indonesia. A comprehensive search was conducted across the full spectrum of construction stakeholders—including academic institutions, government agencies, research laboratories, corporations, start-ups, and suppliers—as well as open data sources containing construction technology records.
This study adopted the four data quality categories proposed by Wang and Strong (1996) but modified the framework by adding and combining several additional dimensions. The final set of data quality dimensions applied in this study is presented in Table 1.
| Categories | Dimensions | Definitions | Sources | Description |
|---|---|---|---|---|
| Intrinsic | Reliability | The extent to which data are accepted or regarded as true, real, and credible. | Wang and Strong, 1996 | Source of the data |
| Contextual | Completeness | The extent to which data are not missing and cover the needs of the tasks, and are of sufficient breadth and depth to the task at hand. | Moges, et al., 2013 Wang and Strong, 1996 | Metadata given from the data source |
| Relevance | The extent to which data are applicable and helpful for the task at hand. | Fisher and Kingma, 2001 Moges, et al., 2013 Wang and Strong, 1996 | Context of the data | |
| Appropriate amount | The extent to which the quantity or volume of available data is appropriate. | Wang and Strong, 1996 | Data volume | |
| Timeliness | The extent to which data are sufficiently up to date for the task at hand. Frequency of updating data. | Fisher and Kingma, 2001 Moges, et al., 2013 Šlibar, et al., 2021 Wang and Strong, 1996 | Year and frequency of updates | |
| Representation | Interpretable | The extent to which data are in appropriate languages and symbols, and the definitions are clear. | Moges, et al., 2013 Wang and Strong, 1996 | Language |
| Concisely represented | The extent to which data are compactly represented, well presented, well-organised, and well-formatted. | Moges, et al., 2013 | Type of data and data format | |
| Accessibility | Accessibility | The extent to which data are available or easily and quickly retrievable. | Moges, et al., 2013 Wang and Strong, 1996 | Publicly available, paywalls, and bureaucratic barriers |
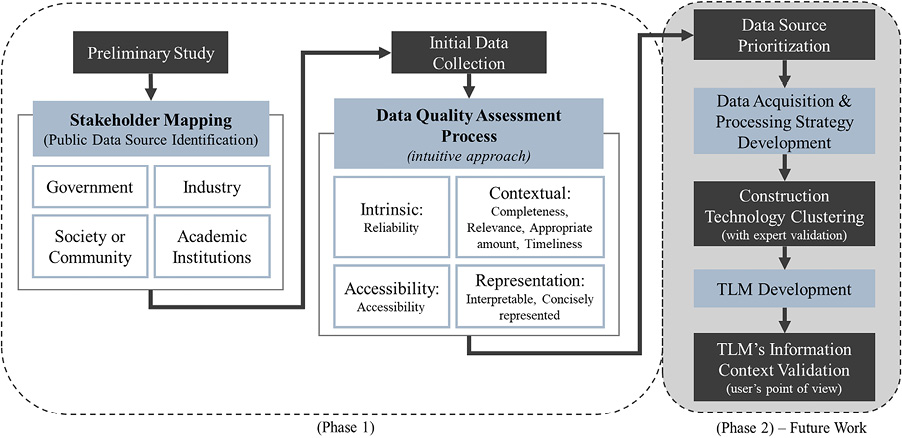
An intuitive approach to data quality assessment was employed in this initial phase of a broader research initiative aimed at developing Indonesia’s construction technology landscape map. Under this approach, the selection and evaluation of data quality attributes were undertaken by the research team, drawing on the combined experience and judgement regarding the importance and relevance of each attribute. The same team will subsequently process the data in the second phase to construct the TLM.
An overview of the methodology is presented in Figure 1. It is important to note that the present study focuses solely on phase 1, which involves the identification of data sources and the assessment of their quality.
This study drew on the list of construction actors and stakeholders proposed by Jonathan and Abduh (2021), with several modifications, as presented in Table 2. In the context of fostering innovation in the construction industry, the roles of key stakeholders are defined as follows:
• government—to act as policymakers and regulators, and to establish frameworks to support innovation;
• industry—to serve as project participants, driving implementation and investment;
• academia—to conduct research, generate innovation, and advance knowledge; and
• society/community—to bridge the gap between these groups, facilitating collaboration and encouraging the adoption of innovations.
| Sectors | Stakeholders and participants |
|---|---|
| Government | Ministry of Public Works and Housing Ministry of National Development Planning Ministry of Finance Ministry of Transportation Ministry of Manpower Ministry of Industry Ministry of State-Owned Enterprises Ministry of Villages, Development of Disadvantaged Regions, and Transmigration Ministry of Energy and Mineral Resources Ministry of Trade Central Bureau of Statistics National Professional Certification Body National Public Procurement Agency Directorate General of Intellectual Property (Ministry of Law and Human Rights) |
| Industry | Developers—public and private Insurance companies Contractors and subcontractors Infrastructure financing companies Consultants Project managers Construction workforce Suppliers of construction materials and products Association of Construction Service Enterprises Association of Construction Service Professionals Association of Construction Service Supply Chains Media companies |
| Society or community | General public Civic society organisations |
| Academic institutions | Research institutes Universities Training institutes |
Stakeholders and participants in the construction industry hold data in diverse formats, volumes, contexts, sensitivity levels, and repositories. However, not all actors manage data specific to construction technology, as this represents only one component of the broader industry. Given the commercial and often proprietary nature of much industry data, this study focused exclusively on publicly accessible digital sources.
Through actor mapping, publicly available online data related to construction technology in Indonesia were identified and categorised into three main groups: government, industry and society, and academic institutions.
Results
Government data sources
Section 4(e) of Indonesian Law No. 2 of 2017 on Construction Services empowers the central government to develop and promote domestic construction materials, equipment, and technologies. To achieve these objectives, the government is authorised to conduct research, and develop and disseminate construction technologies—including new materials and equipment—to all stakeholders. The law also grants the government authority to prioritise technology development and protect intellectual property arising from research and development (R&D) initiatives conducted by Indonesian institutions.
In line with this mandate, the government has implemented several programs to advance the construction industry, including initiatives led by public R&D agencies to develop construction technologies. These efforts have produced a range of publications and outputs that serve as valuable data sources. Examples include the following:
(a) the construction technology application portal by the Ministry of Public Works and Housing,
(b) the e-catalogue of internal R&D outputs and innovations from state-owned enterprises, and
(c) the patent database managed by the Directorate General of Intellectual Property under the Ministry of Law and Human Rights (https://www.dgip.go.id/). Patents were not only legal instruments but also valuable indicators of technological innovation (Teshome, et al., 2024).
A desk study identified seven government databases or repositories as potential sources of construction technology data, as listed in Table 3. These repositories contain diverse information, including technologies under development, technologies currently being marketed, and technologies already in use. However, navigating these databases is often challenging, as many are not directly linked to the primary websites of the relevant government agencies. Moreover, access to one major data repository was disrupted by a ransomware attack on the national data centre in June 2024 (Kurmala, 2024).
| Responsible public agency | Database(s) |
|---|---|
| Directorate General of Construction Development of the Ministry of Public Works and Housing (MPWH) | Sistem Informasi Material dan Peralatan Konstruksi (SIMPK) or (Construction Materials and Equipment Information System) https://simpk.pu.go.id/ |
| Sistem Informasi Belajar Intensif Mandiri (SIBIMA) or (Independent Intensive Learning Information System) https://sibima.pu.go.id/ | |
| Human Resource Development Agency of the Ministry of Public Works and Housing (MPWH) | Sistem Manajemen Pengetahuan (SIMANTU) or (Knowledge Management System) https://simantu.pu.go.id/ |
| Road and Bridge Engineering Development of the Ministry of Public Works and Housing | Perpustakaan Bina Teknik Jalan dan Jembatan or (Road and Bridge Engineering Development Library) https://binamarga.pu.go.id/perpustakaan/repositori# |
| Ministry of Public Works and Housing, supported by Meteorology and Geophysics Agency, Ministry of Energy and Mineral Resources, and National Disaster Management Agency | Sistem Tanggap Bencana (SITABA) or (Disaster Response System) https://sitaba.pu.go.id/ |
| Ministry of State-Owned Enterprises | E-Katalog Riset and Inovasi BUMN or (e-Catalogue of Research and Innovation of State-Owned Enterprises) https://bumn.go.id/publikasi/referensi/publikasi-lain |
| Directorate General of Intellectual Property (Ministry of Law and Human Rights) | Pangkalan Data Kekayaan Intelektual (PDKI) or (Intellectual Property Database) https://www.dgip.go.id/ |
While some government data are available in structured formats, the majority remain unstructured and presented in multiple, inconsistent formats. The quality of the seven identified databases was therefore assessed using the four categories outlined in the methodology—intrinsic, contextual, representational, and accessibility—and the results are presented in the following sections.
Government agencies are generally regarded as credible sources of information due to their accountability to the public and institutional interlinkages, which foster a process of mutual verification and reduce the likelihood of misinformation or bias. Ceolin et al. (2013) found that open government data consistently demonstrates high reliability, while experimental evidence suggests that the public tends to trust reports from government agencies (Van Ryzin and Lavena, 2013). For these reasons, data published by Indonesian government entities were assessed to be of high intrinsic quality, particularly in terms of believability and reputational credibility of the issuing agencies.
In the context of construction technology in Indonesia, the government performs multiple roles: promoting the adoption of modern technologies, developing new solutions tailored to local needs, publishing construction technology data, and safeguarding innovations arising from the technology development. These responsibilities are distributed across different government entities, resulting in data being available from multiple sources, each reflecting a specific context—for example, technology under development, ready-for-market, or already in use. An assessment of the contextual quality from several government-sourced construction technology datasets is presented in Table 4.
From a representational perspective, most published data were presented as reports in free-text format, which makes them difficult to process automatically. Manual parsing of the data is required to convert this unstructured information into a format suitable for the TLM. The representational data quality of these sources is assessed in Table 5. Examples include data from state-owned enterprises’ e-catalogue of innovations and the Ministry of Public Works and Housing’s list of construction technologies (Figure 2), as well as data from the national patents database (Figure 3).
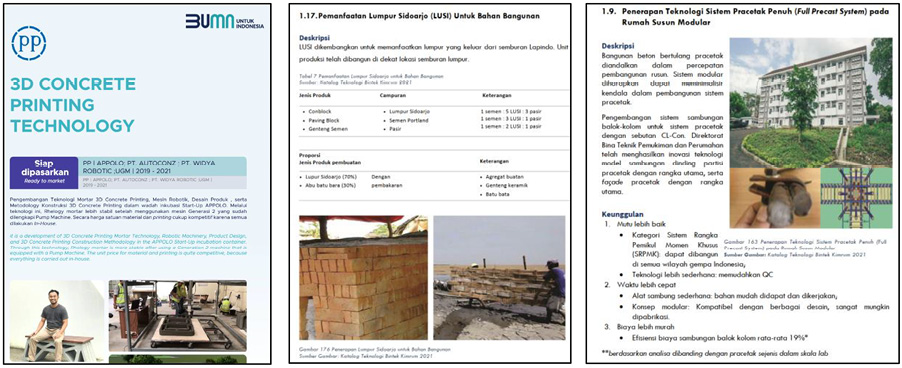
Figure 2. Sample data from government sources (left), 3D printing technology from e-Catalogue of Research and Innovation of State-Owned Enterprises (SOEs) (centre), utilisation of Sidoarjo clay as building material, and (right) precast concrete system for modular housing from the Ministry of Public Works and Housing.
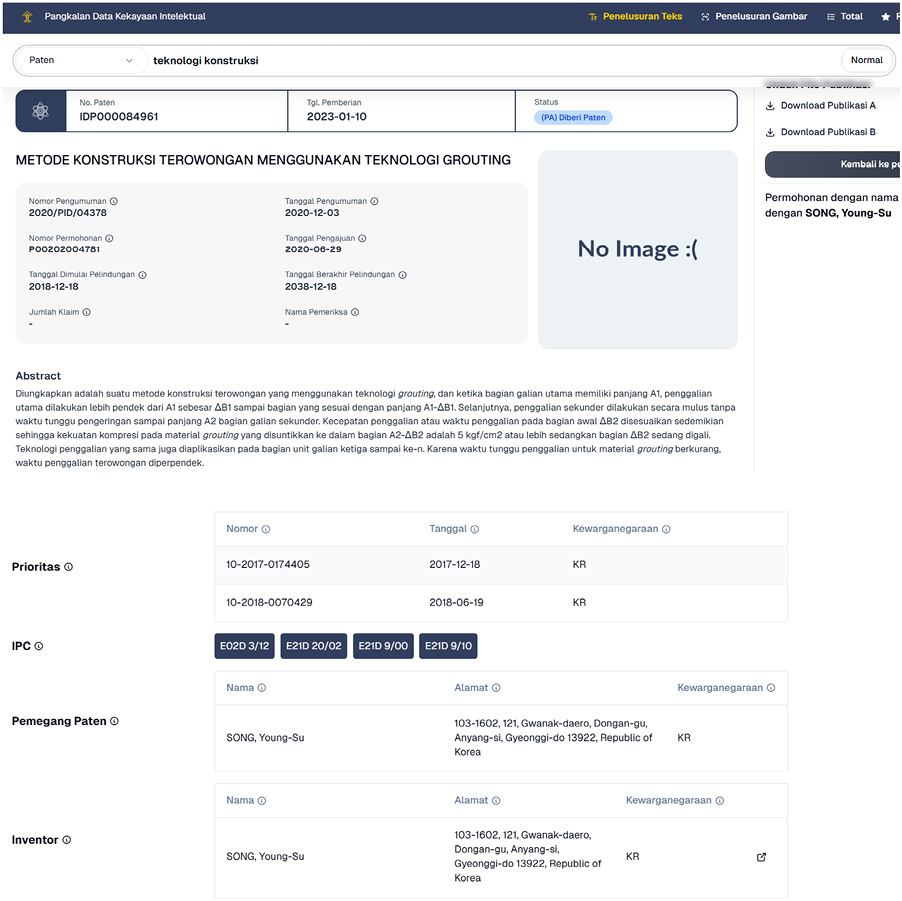
Figure 3. Sample patent data from the patents database.
Source: Database of the Directorate General of Intellectual Property.
Accessing government data sources proved cumbersome, as they were dispersed across multiple platforms managed by different ministries and agencies. More critically, the national data centre—one of the most important repositories—remained non-operational at the time of this research, 12 months after the widely publicised ransomware attack. The accessibility of the government databases is assessed in Table 6.
| Sources | Accessibility |
|---|---|
| e-Catalogue of Research and Innovation of State-Owned Enterprises (SOEs) | Free download from https://bumn.go.id/publikasi/referensi/publikasi-lain (open access). |
| Profile Book on the Application of Construction Technology by the Ministry of Public Works and Housing (MPWH) | Previously available for free download prior to June 2024. Website not operational. |
| Database of the Directorate General of Intellectual Property (Ministry of Law and Human Rights of the Republic of Indonesia) | Free access via https://www.dgip.go.id/. Document download after submitting personal details (not available for systematic download) |
Academic data sources
The next set of databases evaluated is related to academic institutions. Within the construction innovation system, academics play a significant role by conducting research on construction technology and generating innovative solutions. Their research outputs appear in various formats, including theses and dissertations, project reports, journal articles, conference papers, and presentations. Although much of this research is publicly funded, access to the resulting data is not always public; many articles are published by commercial academic publishers.
Research data management in Indonesia is governed by several policies aimed at ensuring openness and accessibility. Article 40 of Indonesian Law No. 11 of 2019 on the National Science and Technology System mandates the collation and storage of all primary data and outputs from research, development, assessment, and application activities. The law also requires that mandatory submission and storage of data be managed through a nationally integrated science and technology information system (Government of Indonesia, 2019). In practice, however, this survey found that not all university and research institution data were publicly available. Many repositories were accessible only via local campus networks or restricted to members of the academic community.
Internationally, the Scopus database is the most used source of academic research. Scopus claims to be the world’s largest, most comprehensive, and most trusted academic database, covering peer-reviewed journals, open access publications, conference proceedings, trade publications, books, and scientific websites. Beyond content discovery, Scopus also provides analytical tools for identifying research trends and mapping connections across disciplines (Newman et al., 2021). Accordingly, Scopus was identified as the primary academic data source for this study.
Since the research focus is on Indonesian construction technology, it was also important to include Indonesian-language journals indexed in the Science and Technology Index (SINTA) database (https://sinta.kemdikbud.go.id/). SINTA is a web-based research information system developed by the Ministry of Research, Technology, and Higher Education. The key features of SINTA include benchmarking institutional research strengths, analysing research trends, and providing expert directories to support collaborative partnerships.
Given the diversity of sources, the collation of academic articles required careful consideration of the reliability and accuracy. Intrinsic data quality was assessed by focusing on reputable journals (Chen et al., 2022). The evaluation of contextual data quality for academic construction technology data is presented in Table 7, while assessments of representational quality and accessibility are provided in Tables 8 and 9, respectively.
| Sources | Accessibility |
|---|---|
| Scopus database | Subscription only https://www.scopus.com/ |
| SINTA database | Open access with some limited features to non-SINTA users. https://sinta.kemdikbud.go.id/ |
Data from academic databases were generally unstructured, with metadata provided by the respective publishers. Some databases offer bulk data export in semi-structured formats, such as CSV or JSON, which can greatly facilitate analysis. For instance, Scopus allows this feature only for users with a paid subscription. In contrast, the local SINTA repository does not provide an export feature. Extracting a large dataset from SINTA therefore requires a web-scraping process, followed by comprehensive data analysis (Adila, 2022). Examples of such searches are presented in Figure 4.
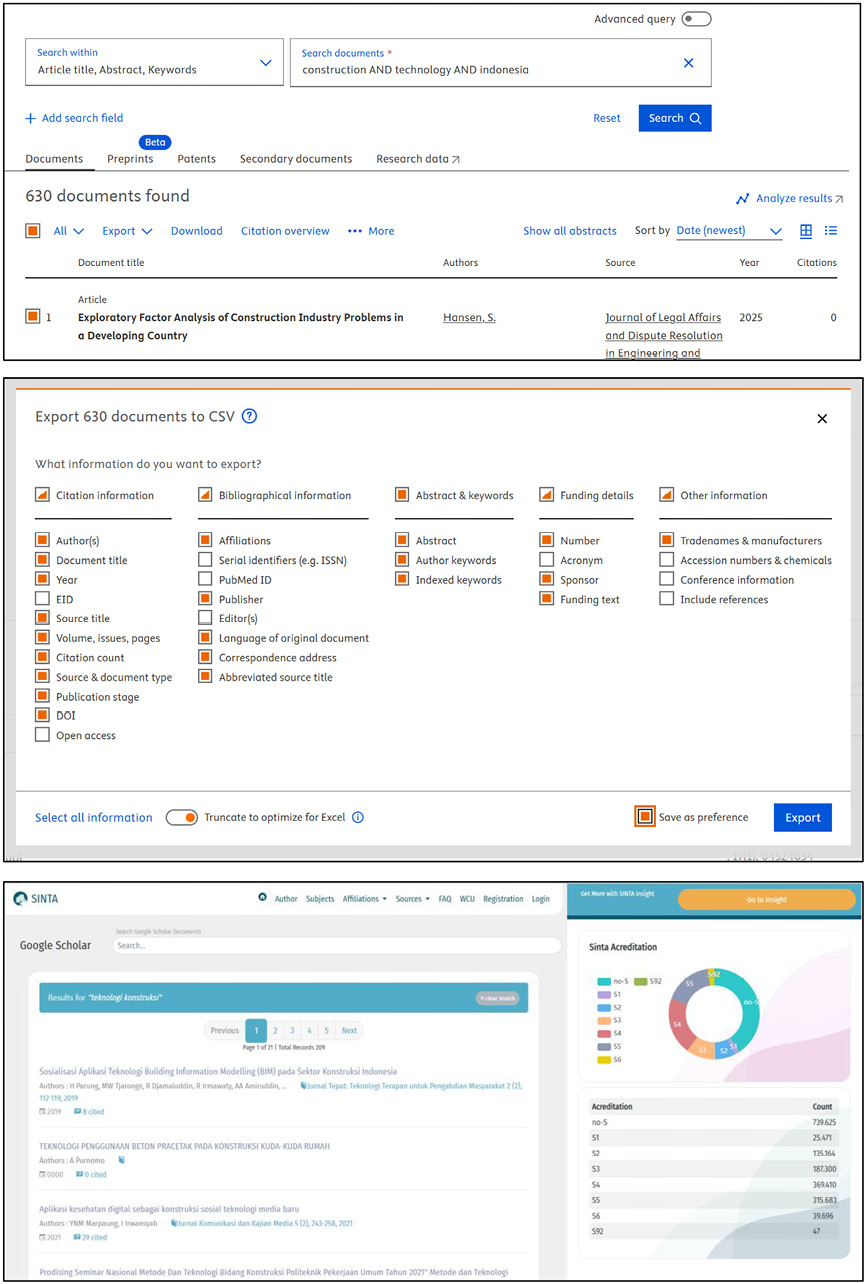
Figure 4. Samples of data from academic sources: (top) search function in Scopus, (middle) export to CSV feature in Scopus, and (bottom) search function in SINTA. SINTA, Science and Technology Index.
Industry, society, and community data sources
Industry data consist of information from practitioners, while society represents the users and beneficiaries of the built environment. As key project stakeholders, construction practitioners are expected to maintain data related to project execution, including the implementation and development of construction technologies, which serve as tools to manage technology within the firm. Technologies employed in a business constitute its technological assets, representing the collective knowledge and technical capabilities of the organisation, including its people, equipment, and systems (Khalil, 2000). Effective management of these assets at the firm level contributes to the creation and sustainability of competitive enterprises, making technology assets a form of intellectual capital. In this study, company annual reports were used as a source of intellectual capital data and information on the construction technologies utilised.
Traditional news media play a key role in disseminating information, opinions, and expectations regarding science, technology, and innovation to the wider public (Ozgun and Broekel, 2021). For new digital technologies to achieve cognitive legitimacy and institutionalised diffusion, public awareness and understanding are critical (Aldrich and Fiol, 2007). In this context, news media and social media act as important social institutions. Accordingly, this study evaluated construction technology data disseminated through news and social media, with Twitter identified as a potential source (Yu et al., 2019; de Gagne et al., 2021; Rao et al., 2021; Kapidzic et al., 2022).
Company annual reports, particularly those from publicly listed firms, were considered credible because they must comply with regulatory requirements. These reports reflect management’s integrity in objectively and comprehensively communicating the firm’s assets, and their content is subject to audit (Courtis, 1995). In Indonesia, annual reporting standards are regulated by the Financial Services Authority under Regulation No. 29/POJK.04/2016 concerning Annual Reports of Issuers or Public Companies, and Circular Letter No. 16/SEOJK.04/2021 specifying the form and content of these reports.
The public, as beneficiaries of industry outputs, also contributes to the innovation process. Public perception of new technologies influences political debates, which may translate into concrete policy decisions (Ozgun and Broekel, 2021). Therefore, social media platforms were surveyed as channels for the public’s expression and opinion on construction technologies.
Examples of data from industry and public sources are presented in Figure 5. The assessment of contextual, representational, and accessibility dimensions for industry and community data is presented in Tables 10, 11, and 12, respectively.
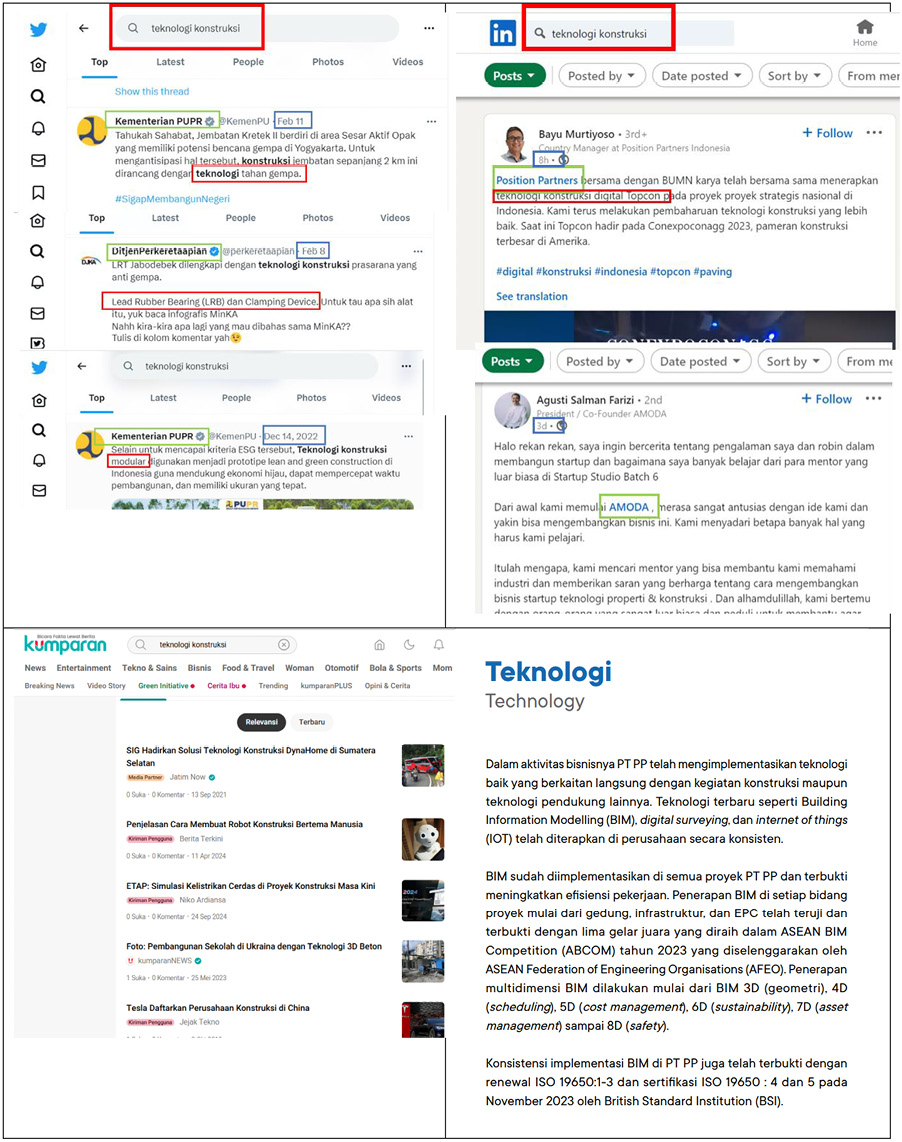
Figure 5. Samples of data from public and industry sources: (top left) search in Twitter, (top right) search in LinkedIn, (bottom left) search in online news portal, and (bottom right) technology discussion in an annual report.
| Sources | Accessibility |
|---|---|
| Mass media website (news) | Open for public (however, high-quality articles will be available under subscription). |
| Social media (Twitter and LinkedIn) | Open access with some limited features to non-users. |
| Annual report of contractors | Free download from company’s website (for example, https://www.ptpp.co.id/en/investor/company-report/annual-report?page=1 – open access). |
Discussion
The application of the enhanced Wang and Strong (1996) data quality framework, adapted to capture dimensions critical for the creation of a TLM for the construction industry, is summarised in Table 13. Using the four categories of intrinsic, contextual, representational, and accessibility, eight data sources from government, academic institutions, and industry/community were assessed and critically evaluated.
In the intrinsic data quality category, government data demonstrated the highest credibility compared to industry and academic sources. While academic publications undergo peer review, their credibility is generally dependent on being published in reputable journals. Industry data, particularly from company annual reports, were also assessed as highly credible due to rigorous auditing processes and the regulatory oversight in Indonesia. Supporting evidence comes from Yi and Davey (2010), who found that intellectual capital disclosure in the annual reports of 49 Chinese companies, although not extensive, reflected a clear awareness of its significance. Similarly, Brüggen et al. (2009) observed that firms with greater reliance on intellectual capital disclosed more comprehensive information. By contrast, both social media and mass media sources were judged to have low credibility.
For the contextual data quality, the most comprehensive information came from government repositories, including detailed metadata on construction technologies and patents. The main limitation of government databases was the relatively small number of datasets available in their technology catalogue and in-house R&D outputs. Academic sources contained the largest volume of data, while corporate annual reports provided only implicit presentations of construction technologies. According to Goh and Lim (2004), firms possess three types of capital—financial capital (e.g., cash and stocks), physical capital (e.g., buildings and equipment), and intellectual capital (e.g., innovations and brands)—with intellectual capital increasingly recognised as a driver of firm value. Corporate annual reports, which combine quantitative data, narratives, images and charts, serve to inform shareholders, creditors, and other stakeholders about a firm’s historical performance, current status, and strategic direction (Courtis, 1995).
From a representational data quality perspective, all sources were available in English or Indonesian. This posed no issue for the research team or for other Indonesian researchers, as most are fluent in English as a second language.
Regarding accessibility, all data sources were obtainable by the research team. However, significant challenges arose in accessing some government databases, which were dispersed across multiple online platforms. Academic data were generally well organised and indexed by commercial providers such as Scopus, although full access required paid subscriptions. The research team gained access to Scopus via university accounts.
When evaluated by stakeholder group, government data emerged as the highest quality source, being both comprehensive and reliable. Nonetheless, improvements are needed in update frequency and accessibility, particularly in light of the prolonged disruption of the national data centre. The absence of standardised data formats imposes additional effort for data interpretation and extraction. Moreover, the distribution of data across various platforms managed by multiple ministries and agencies further complicates access. Given the critical role of construction technology data in industry development, it is essential that the government adopts improved data management practices and consider centralising these datasets, taking inspiration from successful initiatives in other countries.
Academic data sources attained the highest reliability rating, as the academic community is widely regarded as credible, guided by rigorous scientific methods, and supported by a system of regular updates. Accessibility of academic data was generally high, although detailed technology information was often behind paywalls. Academic datasets were the most well-structured among the evaluated sources.
Although most messages on Twitter consisted of casual conversations, they did contain relevant construction-related news and information (Castillo et al., 2013). However, Castillo et al. (2013) also found that users perceived identical news headlines as significantly less credible when presented on Twitter. With no regulatory oversight on social media platforms, the quality of data from these channels is generally lower than that from traditional news sources (Shu et al., 2020). Accordingly, annual reports were considered more reliable and credible than social media data.
The overall assessment prioritises potential data sources for TLM development, comparing their relative merits across the four quality categories. Top priority was assigned based on credibility, metadata quality, and the format of the technology data (i.e., relevance and representational clarity). In contrast, data quantity and update frequency were less critical for this prioritisation. Similarly, accessibility was not a differentiating factor, as all evaluated sources were generally obtainable by the research team.
It is noteworthy that the Indonesian government recently launched the One Data Indonesia program to develop, manage, and disseminate science and technology data. This initiative aims to create a unified data structure to facilitate access and sharing between central and regional agencies. Presidential Regulation No. 39 of 2019 formalised this policy, mandating that all government data and data from other related agencies be deposited in this portal (data.go.id). However, this initiative does not currently extend to construction technology data.
The assessment indicates that government data hold substantial potential compared to other sources. To maximise this potential, government agencies should improve publication practices by increasing the frequency of data release and standardising data formats. Such improvements should include consistent formatting standards across institutions and the adoption of machine-readable formats, enhancing both accessibility and usability.
Similarly, the Scopus database holds significant promise, but effective utilisation requires targeted extraction methodologies. Construction technology information is typically embedded within articles and academic documents rather than explicitly categorised. The application of natural language processing techniques offers a promising solution, enabling automated extraction and analysis of construction technology information from large-scale bibliometric datasets.
Conclusions
This study identified valuable sources of construction technology data from three stakeholder groups: government, industry, and academic institutions. Government sources primarily include databases and repositories developed by research departments, technical reports, and patents filed with the national intellectual property office. Academic data were largely drawn from the international Scopus database and the local repository SINTA. Industry and public sources comprised company annual reports, mass media, and corporate websites. This study evaluated data quality across four categories—intrinsic, contextual, representation, and accessibility—and successfully addressed all three research objectives.
First, in terms of reliability, government data exhibited the highest credibility, followed by industry-specific company data, academic institutions, and industry/community-generated data. Credibility was primarily determined by institutional authority and the rigour of the data publication process.
Second, the contextual evaluation revealed notable differences across sources. Government data, although limited in quantity, demonstrated superior metadata completeness and clearly presented technological information. However, infrequent updates were a key concern. Industrial data contained the least comprehensive metadata, with technological information often implicit and the dataset size uncertain. Despite these limitations, enterprise data retained reliability due to consistent annual publication schedules, whereas community-generated data showed irregular updates. Academic data displayed moderate comprehensiveness with implicit technological information; although datasets were abundant, the update frequency was inconsistent.
Third, the assessment of representational and accessibility dimensions showed that most were available in English or Indonesian and were generally open access, except for subscription-based academic journals (Scopus). Most datasets were unstructured, except for Scopus and patent data, which are semi-structured and adhere to standard formats.
In summary, the majority of construction technology data in Indonesia are either unstructured with limited information or semi-structured, large-scale datasets from credible sources, but with irregular updates. This presents challenges for developing a technology landscape map, where high-quality data are essential. Government and Scopus databases demonstrate significant potential, but maximising their utility will require improved standardisation and natural language processing-based extraction methods.
References
Ackoff, R. (1989). From Data to Wisdom. Journal of Applied System Analysis, 16, 3–9.
Adila, N. (2022). Implementation of Web Scraping for Journal Data Collection on the SINTA Website. Sinkron, 7(4), 2478–2485. https://doi.org/10.33395/sinkron.v7i4.11576
Afful-Dadzie, E., & Afful-Dadzie, A. (2017). Open Government Data in Africa: A preference elicitation analysis of media practitioners. Government Information Quarterly, 34(2), 244–255. https://doi.org/10.1016/j.giq.2017.02.005
Aharonson, B. S., & Schilling, M. A. (2016). Mapping the technological landscape: Measuring technology distance, technological footprints, and technology evolution. Research Policy, 45(1), 81–96. https://doi.org/10.1016/j.respol.2015.08.001
Aldrich, H. E., & Fiol, C. M. (2007). Fools rush in? the institutional context of industry creation. Entrepreneurship: Concepts, Theory and Perspective, 19(4), 105–127. https://doi.org/10.1007/978-3-540-48543-8_5
Arts, S., & Fleming, L. (2018). Paradise of Novelty — Or Loss of Human Capital ? Exploring New Fields and Inventive Output. Organization Science, 29(6), 1–19. https://doi.org/10.1287/orsc.2018.1216
Aryan, P. R., Ekaputra, F. J., Sunindyo, W. D., & Akbar, S. (2014). Fostering Government Transparency and Public Participation through Linked Open Government Data (Case Study: Indonesian Public Information Service). 2014 International Conference on Data and Software Engineering (ICODSE). https://doi.org/10.1109/ICODSE.2014.7062655
Asian Development Bank. (2022). Key indicators database. https://kidb.adb.org/
Batini, C., Cappiello, C., Francalanci, C., & Maurino, A. (2009). Methodologies for data quality assessment and improvement. ACM Computing Surveys, 41(3). https://doi.org/10.1145/1541880.1541883
Bilal, M., Oyedele, L. O., Qadir, J., Munir, K., Ajayi, S. O., Akinade, O. O., Owolabi, H. A., Alaka, H. A., & Pasha, M. (2016). Big Data in the construction industry: A review of present status, opportunities, and future trends. Advanced Engineering Informatics, 30(3), 500–521. https://doi.org/10.1016/j.aei.2016.07.001
Braunschweig, K., Eberius, J., Thiele, M., & Lehner, W. (2012). The State of Open Data Limits of Current Open Data Platforms. Proceedings of the 21st World Wide Web Conference 2012, Web Science Track at WWW’12, 1–6. http://wwwdb.inf.tu-dresden.de/opendatasurvey/
Brüggen, A., Vergauwen, P., & Dao, M. (2009). Determinants of intellectual capital disclosure: Evidence from Australia. Management Decision, 47(2), 233–245. https://doi.org/10.1108/00251740910938894
Castillo, C., Mendoza, M., & Poblete, B. (2013). Predicting information credibility in time-sensitive social media. Internet Research, 23(5), 560–588. https://doi.org/10.1108/IntR-05-2012-0095
Central Bureau of Statistics. (2024, April 4). Construction indicators: Quarter IV 2023. https://www.bps.go.id/en/publication/2024/04/04/bd6bfe8bf916d80e06c74ba6/indikator-konstruksi--triwulan-iv-2023.html
Central Bureau of Statistics. (2025). Mid Year Population (Thousand People). https://www.bps.go.id/en/statistics-table/2/MTk3NSMy/jumlah-penduduk-pertengahan-tahun--ribu-jiwa-.html
Ceolin, D., Moreau, L., O’Hara, K., Schreiber, G., Sackley, A., Fokkink, W., Van Hage, W. R., & Shadbolt, N. (2013). Reliability analyses of open government data. CEUR Workshop Proceedings, 1073, 34–39.
Chen, C. C., & Tseng, Y. De. (2011). Quality evaluation of product reviews using an information quality framework. Decision Support Systems, 50(4), 755–768. https://doi.org/10.1016/j.dss.2010.08.023
Chen, X., Chang-Richards, A. Y., Pelosi, A., Jia, Y., Shen, X., Siddiqui, M. K., & Yang, N. (2022). Implementation of technologies in the construction industry: a systematic review. Engineering, Construction and Architectural Management, 29(8), 3181–3209. https://doi.org/10.1108/ECAM-02-2021-0172
Cho, S., Weng, C., Kahn, M. G., & Natarajan, K. (2021). Identifying Data Quality Dimensions for Person-Generated Wearable Device Data: Multi-Method Study. JMIR MHealth and UHealth, 9(12), 1–15. https://doi.org/10.2196/31618
Courtis, J. K. (1995). Readability of annual reports: Western versus Asian evidence. Accounting, Auditing & Accountability Journal, 8(2), 4–17. https://doi.org/10.1108/09513579510086795
de Gagne, J. C., Cho, E., Yamane, S. S., Jin, H., Nam, J. D., & Jung, D. (2021). Analysis of cyberincivility in posts by health professions students: Descriptive Twitter data mining study. JMIR Medical Education, 7(2). https://doi.org/10.2196/28805
Fisher, C. W., & Kingma, B. R. (2001). Criticality of data quality as exemplified in two disasters. Information and Management, 39(2), 109–116. https://doi.org/10.1016/S0378-7206(01)00083-0
Fleming, L. (2001). Recombinant uncertainty in technological search. Management Science, 47(1), 117–132. https://doi.org/10.1287/mnsc.47.1.117.10671
Fleming, L., & Sorenson, O. (2001). Technology as a complex adaptive system: Evidence from patent data. Research Policy, 30(7), 1019–1039. https://doi.org/10.1016/S0048-7333(00)00135-9
Fleming, L., & Sorenson, O. (2004). Science as a map in technological search. Strategic Management Journal, 25(8–9), 909–928. https://doi.org/10.1002/smj.384
Goh, P. C., & Lim, K. P. (2004). Disclosing intellectual capital in company annual reports: Evidence from Malaysia. Journal of Intellectual Capital, 5(3), 500–510. https://doi.org/10.1108/14691930410550426
Gomes, Á., & Soares, D. (2014). Open government data initiatives in Europe: northern versus southern countries analysis. ICEGOV ’14: Proceedings of the 8th International Conference on Theory and Practice of Electronic Governance, 342–350. https://doi.org/10.1145/2691195.2691246
Gunawan, D., & Amalia, A. (2016). The Implementation of open data in Indonesia. Proceedings of 2016 International Conference on Data and Software Engineering, ICoDSE 2016. https://doi.org/10.1109/ICODSE.2016.7936164
Government of Indonesia. (2019). Undang-Undang Republik Indonesia Nomor 11 Tahun 2019 tentang Sistem Nasional Ilmu Pengetahuan dan Teknologi. https://peraturan.bpk.go.id/Home/Details/117023/uu-no-11-tahun-2019
Government of Indonesia. (2024). Law of the Republic of Indonesia Number 59 of 2024 concerning the National Long-Term Development Plan for 2025–2045.
Government of Indonesia. (2025). Presidential Regulation of the Republic of Indonesia Number 12 of 2025 concerning the National Medium-Term Development Plan for 2025–2029.
Jonathan & Abduh, M. (2021). Identifikasi Peran dan Kebutuhan Informasi Stakeholders Utama dalam Pengembangan SITIKI. Konferensi Nasional Teknik Sipil 15.
Kapidzic, S., Neuberger, C., Frey, F., Stieglitz, S., & Mirbabaie, M. (2022). How News Websites Refer to Twitter: A Content Analysis of Twitter Sources in Journalism. Journalism Studies, 23(10), 1247–1268. https://doi.org/10.1080/1461670X.2022.2078400
Khalil, T. (2000). Management of technology The key to competitiveness and wealth creation (E. M. Munson (ed.)). McGraw-Hill.
Kurmala, A. (2024, June 24). Disruption at National Data Center caused by Brain Cipher ransomware. Antara. https://en.antaranews.com/news/316773/disruption-at-national-data-center-caused-by-brain-cipher-ransomware
Kusuma, B., Soemardi, B. W., Pribadi, K. S., & Yuliar, S. (2019). Indonesian contractor technological learning mechanism and its considerations. IOP Conference Series: Materials Science and Engineering, 650(1), 0–10. https://doi.org/10.1088/1757-899X/650/1/012001
Lee, C., Jeon, D., Ahn, J. M., & Kwon, O. (2020). Navigating a product landscape for technology opportunity analysis: A word2vec approach using an integrated patent-product database. Technovation, 96–97(September 2019), 102140. https://doi.org/10.1016/j.technovation.2020.102140
Lee, Y. W., Strong, D. M., Kahn, B. K., & Wang, R. Y. (2002). AIMQ: A methodology for information quality assessment. Information and Management, 40(2), 133–146. https://doi.org/10.1016/S0378-7206(02)00043-5
Martin, E. G., Law, J., Ran, W., Helbig, N., & Birkhead, G. S. (2017). Evaluating the quality and usability of open data for public health research: A systematic review of data offerings on 3 open data platforms. Journal of Public Health Management and Practice, 23(4), e5–e13. https://doi.org/10.1097/PHH.0000000000000388
Moges, H. T., Dejaeger, K., Lemahieu, W., & Baesens, B. (2013). A multidimensional analysis of data quality for credit risk management: New insights and challenges. Information and Management, 50(1), 43–58. https://doi.org/10.1016/j.im.2012.10.001
Newman, C., Edwards, D., Martek, I., Lai, J., Thwala, W. D., & Rillie, I. (2021). Industry 4.0 deployment in the construction industry: a bibliometric literature review and UK-based case study. Smart and Sustainable Built Environment, 10(4), 557–580. https://doi.org/10.1108/SASBE-02-2020-0016
Ozgun, B., & Broekel, T. (2021). The geography of innovation and technology news - An empirical study of the German news media. Technological Forecasting and Social Change, 167(March), 120692. https://doi.org/10.1016/j.techfore.2021.120692
Paap, J. (2020). Mapping the technological landscape to accelerate innovation. Foresight and STI Governance, 14(3), 41–54. https://doi.org/10.17323/2500-2597.2020.3.41.54
Paap, J. (2022, October 12). Using landscape maps to promote innovation. Planisware. https://planisware.com/resources/strategic-planning-alignment/using-landscape-maps-promote-innovation?target=1461
Rao, A., Morstatter, F., Hu, M., Chen, E., Burghardt, K., Ferrara, E., & Lerman, K. (2021). Political partisanship and antiscience attitudes in online discussions about COVID-19: Twitter content analysis. Journal of Medical Internet Research, 23(6), 1–13. https://doi.org/10.2196/26692
Scannapieco, M., & Catarci, T. (2002). Data Quality under the Computer Science perspective. Computer Engineering, 2(2), 1–12. https://www.researchgate.net/profile/Tiziana_Catarci2/publication/228597426_Data_quality_under_a_computer_science_perspective/links/0fcfd51169a156b61a000000.pdf
Schilling, M. A., & Green, E. (2011). Recombinant search and breakthrough idea generation: An analysis of high impact papers in the social sciences. Research Policy, 40(10), 1321–1331. https://doi.org/10.1016/j.respol.2011.06.009
Sepasgozar, S. M. E., & Davis, S. (2018). Construction technology adoption cube: An investigation on process, factors, barriers, drivers and decision makers using NVivo and AHP analysis. Buildings, 8(6), 12–15. https://doi.org/10.3390/buildings8060074
Shu, K., Mahudeswaran, D., Wang, S., Lee, D., & Liu, H. (2020). FakeNewsNet: A Data Repository with News Content, Social Context, and Spatiotemporal Information for Studying Fake News on Social Media. Big Data, 8(3), 171–188. https://doi.org/10.1089/big.2020.0062
Šlibar, B., Oreški, D., & Begičević Ređep, N. (2021). Importance of the Open Data Assessment: An Insight Into the (Meta) Data Quality Dimensions. SAGE Open, 11(2). https://doi.org/10.1177/21582440211023178
Spitsberg, I., Brahmandam, S., Verti, M. J., & Coulston, G. W. (2013). Technology landscape mapping: At the heart of Open innovation. Research Technology Management, 56(4), 27–35. https://doi.org/10.5437/08956308X5604107
Teshome, M. B., Podrecca, M., & Orzes, G. (2024). Technological trends in mountain logistics: A patent analysis. Research in Transportation Business and Management, 57(September), 101202. https://doi.org/10.1016/j.rtbm.2024.101202
Van Ryzin, G., & Lavena, C. (2013). The credibility of government performance reporting. Public Performance and Management Review, 37(1), 87–103. https://doi.org/10.2753/PMR1530-9576370104
Wang, R. Y., & Strong, D. M. (1996). Beyond Accuracy: What Data Quality Means to Data Consumers. Journal of Management Information Systems, 12(4), 5–33. http://www.jstor.org/stable/40398176. https://doi.org/10.1080/07421222.1996.11518099
Yan, H., Yang, N., Peng, Y., & Ren, Y. (2020). Data mining in the construction industry: Present status, opportunities, and future trends. Automation in Construction, 119(May), 103331. https://doi.org/10.1016/j.autcon.2020.103331
Yi, A., & Davey, H. (2010). Intellectual capital disclosure in Chinese (mainland) companies. Journal of Intellectual Capital, 11(3), 326–347. https://doi.org/10.1108/14691931011064572
Yu, H., Xiao, T., Xu, S., & Wang, Y. (2019). Who posts scientific tweets? An investigation into the productivity, locations, and identities of scientific tweeters. Journal of Informetrics, 13(3), 841–855. https://doi.org/10.1016/j.joi.2019.08.001
Zheng, L., & Gao, F. (2016). Assessment on China’s open government data platforms: Framework, status and problems. Proceedings of the 17th International Digital Government Research Conference on Digital Government Research, 408–414. https://doi.org/10.1145/2912160.2912213