Construction Economics and Building
Vol. 25, No. 3/4
December 2025
RESEARCH ARTICLE
Organizational Culture and Its Impact on Employees’ Safety
James Anthony Oppon*, Benjamin Boahene Akomah, Daniel Ebo Hagan, Chris Kurbom Tieru, Kingsley Koufie
Department of Construction Technology and Management, School of Built and Natural Environment, Cape Coast Technical University, Cape Coast, Ghana
Corresponding author: James Anthony Oppon, james.oppon@cctu.edu.gh
DOI: https://doi.org/10.5130/AJCEB.v25i3/4.9201
Article History: Received 24/06/2024; Revised 23/10/2024; Accepted 21/08/2025; Published 05/12/2025
Citation: Oppon, J. A., Akomah, B. B., Hagan, D. E., Tieru, C. K., Koufie, K. 2025. Organizational Culture and Its Impact on Employees’ Safety. Construction Economics and Building, 25:3/4, 121–142. https://doi.org/10.5130/AJCEB.v25i3/4.9201
Abstract
Workplace safety in the construction industry, particularly in developing countries, remains a critical concern owing to the high rates of accidents and fatalities. This study investigates how organizational culture influences employee safety in the construction industry, focusing on developing economies. The practical significance of this study lies in bridging the knowledge gap regarding how the different dimensions of cultural artifacts, espoused values, and assumptions affect safety outcomes. Utilizing a quantitative research approach, data were collected through structured questionnaires from 30 contractors from the Association of Building and Civil Engineering Contractors of Ghana (ABCECG) in the Cape Coast Metropolis of Ghana. Descriptive and inferential statistics, including multiple regression analysis, examined the relationship between cultural elements and safety performance. The findings revealed that all three dimensions of organizational culture (artifacts, espoused values, and assumptions) contribute significantly to enhanced safety outcomes, with symbols and dress codes emerging as strong predictors of safety practices. However, challenges remain in integrating espoused values into daily operations and adapting cultural assumptions to the evolving conditions. This study contributes to the literature by providing empirical evidence that organizational culture is pivotal in promoting safety in high-risk industries. These practical implications suggest that organizations should reinforce cultural symbols and values, foster leadership involvement, and continuously monitor safety practices to create safer work environments. These results are particularly important for developing economies where improving workplace safety can contribute to broader economic development.
Keywords
Construction Industry; Developing Countries; Employee Safety; Organizational Culture; Safety Culture
Introduction
One of the major issues that have plagued the construction industry for many years has been safety issues, and at the core of this huge problem is how some of the organizations in the industry handle issues that must deal with safety (Mustapha et al., 2024). Safety culture thus represents a subset of organizational culture that relates to the management of risks and is shaped by culture with elements of visible artifacts, espoused values, and assumptions (Schein, 1992). Thus, safety culture refers to a set of norms and values within an organization and its supporting practices that supersede other business objectives, endorsing only safety (Johnston et al., 2020; Bisbey et al., 2019). This is clear through leadership actions, worker attitudes, and the effectiveness of safety management procedures. In the construction sector in low- and middle-income countries (LMICs), the relationship between organizational culture and safety has been poorly defined due to limitations such as lack of funds and inadequate training facilities (De Brún et al., 2020).
The relationship between organizational culture and safety is particularly relevant in construction industries, where risks are inherent, and safety protocols need to be deeply embedded in daily operations. Studies have shown that positive organizational cultures that communicate safety norms and reinforce consistently reduce accident rates significantly (Espasandín-Bustelo, 2020; Irawan and Sumartik, 2023). Despite this, many construction organizations in LMICs struggle to integrate espoused values into daily practices, a challenge amplified by limited research in these regions.
Addressing this gap is critical for improving both safety outcomes and organizational effectiveness in the construction industry in LMICs. This study explores how various dimensions of organizational culture, such as symbols, dress codes, and communication of safety values, influence safety practices in construction firms operating in Ghana. It aims to provide empirical evidence to guide leadership decisions in enhancing safety culture through targeted organizational interventions. By closing this research gap, this study contributes to the broader objective of reducing workplace accidents and enhancing overall safety in the construction sector in developing economies.
Literature review
Organizational culture
Organizational culture has been a focal point in management and organizational studies because of its profound impact on business operations and employee behavior (Fernandes, Pereira and Wiedenhöft, 2023). Defined as collective values, beliefs, and practices within an organization, culture influences how individuals perceive and act in their work environment (Zakharchyn, 2022). Even in organizations where culture is not formally acknowledged, it subtly dictates behavior, attitudes, and decision-making processes (Zakharchyn, 2022; Fernandes, Pereira and Wiedenhöft, 2023). The role of organizational culture in determining overall effectiveness and shaping competitive advantage has been widely recognized (Morgan and Kidombo, 2022; Torres, Ferraz and Santos-Rodrigues, 2018).
Schein’s (1992) foundational model of organizational culture, which categorizes culture as artifacts, espoused values, and basic assumptions, has been particularly influential, as shown in Figure 1. Artifacts represent tangible, visible aspects, such as dress codes and office design. In contrast, espoused values reflect the declared principles guiding organizational behavior. Basic assumptions are deeply embedded beliefs that influence actions unconsciously. This model has been critical in understanding how organizations foster cultures that enhance employee behavior and organizational success (Saifi, 2015).
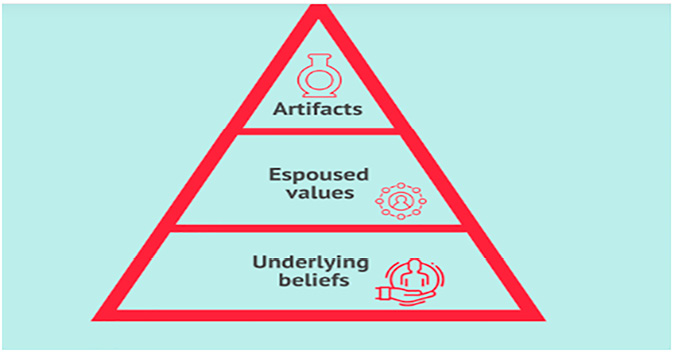
Figure 1. Organizational culture
Source: Schein (1992)
However, Schein’s model is not without its criticism. For example, the concept of a unified organizational culture often overlooks the existence of subcultures within large organizations (Berger et al., 2020). These subcultures may vary based on age, gender, and education, complicating the integration of a cohesive culture across an entire organization (Alankarage et al., 2024).
Types of organizational culture
There are different forms of organizational culture, such as strong culture, subculture, and counterculture ). Strong cultures reflect an organization’s fundamental values that are well integrated into the company, thus promoting appropriate employee behavior and enhancing organizational performance (Graham et al., 2022). However, such cultures may also have drawbacks, such as resistance to change (McMillan and Overall, 2017).
Schein (1992), for example, notes that while culture is highly resistant to change, it could increase the organization’s ability to adapt if it encourages people to differentiate assumptions from variables. Cultural robustness and flexibility can easily be argued as key to sustainable performance in present-day organizations (Chatman et al., 2014).
Organizational culture and safety
Safety culture is a part of organizational culture that defines an organization’s approach toward risk management and protecting its employees’ safety (Bisbey et al., 2019). Research suggests that a strong safety culture enhances safety performance, employee job satisfaction, and organizational effectiveness (Johnston et al., 2020). In the construction industry, particularly in LMICs, the relationship between organizational culture and safety is crucial because of the high prevalence of workplace hazards (Ahmad, Fitria and Hakim, 2022; Zhang et al., 2023).
However, few studies have attempted to explain the direct effect of organizational culture on safety performance in developing nations. Nonetheless, the literature suggests that safety culture determines how often employees observe suitable safety measures and that transmitting this culture is crucial in hazard prevention (Efimova and Komarova, 2019).
Organizational culture types and safety outcomes
This literature reveals that the impact of different organizational cultures on safety performance may be positive or negative. In particular, companies with well-established safety attitudes can indicate a 75% lower injury frequency and a 46% increased employee participation in safety procedures (Chong, 2022). On the other hand, when safety or organizational culture does not support safety, there will be a greater number of accidents and less compliance with safety measures (Irawan and Sumartik, 2023).
A study by Isa et al. (2021) found that safety culture comprises commitments from management, communication, and safety training essential to low workplace accident rates. On the other hand, other works, such as Hermanto, Syahrul and Yulihasri (2023), point out that cultural aspects are directly related to safety and the intermediary role of job satisfaction, which is affected by organizational culture concerning safety behavior.
The impact of organizational culture on employee safety
Various authors have emphasized the relationship between organizational culture and employee safety (Adekanmbi and Ukpere, 2023; Irawan and Sumartik, 2023). When an organization has a positive culture, its employees work safely without causing many accidents in the workplace (Espasandín-Bustelo, Ganaza-Vargas and Diaz-Carrion, 2020). It is important to note that ensuring leadership integrity for safety and employee participation in safety issues will enhance organizational safety, as companies that embrace an active safety culture usually post superior safety performance (Adekanmbi and Ukpere, 2023).
However, recent research has indicated this may not always be true. For example, Hermanto, Syahrul and Yulihasri (2023) argued that culture and its subsequent responses to contextual factors could be enablers or barriers to enacting the safety process due to how this is disseminated. This underlines the importance of additional studies that discuss the relationship between more specific elements of organizational culture, such as leadership and communication, and safety practices in different environments.
Methodology
Based on the research questions that were formulated in this study, as well as the type of data that would be collected in this study, this study adopts a quantitative research approach to establish the effect of organizational culture on the safety of employees in the construction industry in Ghana, with a focus on Cape Coast Metropolis. A quantitative approach was chosen over qualitative or mixed methods because this study aimed to compare the level and type of organizational culture factors, namely, artifacts, espoused values, and assumptions, with safety outcomes data (Marchand et al., 2013; Wahab, Ismail and Othman, 2017). The choice of this approach was informed by the fact that statistical generality, as well as handling of numerical data across large samples, is more efficiently managed by quantitative study designs than qualitative or mixed designs. Quantitative techniques also enable us to use inferential statistics, such as regression analysis, to confirm the existence and strength of these relations (Rana, Gutierrez and Oldroyd, 2021). The target population was 45 contractors who were members of the Association of Building and Civil Engineering Contractors of Ghana (ABCECG) operating in the Cape Coast Metropolis. Purposive sampling was performed in this study. Of all the contractors contacted, 30 were interested in the study, with a response rate of 67%. This sample size was considered adequate for developing a cross-sectional dataset of the sample space for statistical validity (Motlhale, 2018. The most effective data collection method adopted by the researcher was a structured questionnaire, which mainly included closed-ended questions.
The questions were designed using a five-point Likert scale ranging from strongly agree to strongly disagree to determine the respondents’ perceptions of organizational culture and safety. The Likert scale was selected because it provides quantifiable measures of attitudes and produces highly reliable data for statistical testing (Joshi et al., 2015). The items used to assess the dimensions were organizational culture artifacts such as symbols, dress codes, espoused values, and assumptions that were ascertained using valid measures established in the literature (Gulua, 2018). The measures used to maintain reliability and validity are as follows: First, the questionnaire was piloted using a sample of 10 contractors in the Sekondi-Takoradi Metropolis to enhance the understanding and arrangement of questions. A reliability test known as Cronbach’s alpha was employed to determine internal consistency, and all the constructs were above 0.9; hence, it had high reliability (Bujang, Omar and Baharum, 2018; Tavakol and Dennick, 2011). Construct validity was ensured by exploratory factor analysis (EFA), where demographic tests limited the factors to ensure that all questionnaire items measured the intended dimensions (Dabbagh et al., 2023). These steps ensured that the data collected were accurate and had the quality of valid data, which helped support the statistical analysis to be conducted. Descriptive [mean (M) and standard deviation (SD)] and inferential (multiple regression) statistical techniques were used with IBM SPSS Statistics (version 25) and Microsoft Excel, and the data were presented in graphical and tabular forms (Rahman and Muktadir, 2021). Ethical considerations included seeking informed consent, maintaining confidentiality, and participants’ autonomy to withdraw from the study.
Results and discussion
Demographic characteristics of the respondents
As shown in Table 1, the respondents’ demographic characteristics revealed a diverse sample of gender, age, education, and work experience. Most respondents were male (70%), aged under 30 to over 51. The most common educational qualification was a Master’s degree (43.3%), followed by a bachelor’s degree (40%). Work experience varied, with the largest group having 6–10 years of experience (30%).
Source: Field Data, 2023
Organizational culture artifacts
As shown in Table 2, the results indicate moderate to high agreement (mean scores between 3.37 and 3.73) on all items related to organizational culture artifacts. This suggests that employees perceive a positive alignment between symbols, icons, office decor, dress codes, and the organization’s values and culture. However, standard deviations ranging from 0.809 to 1.245 indicated some degree of variance in individual perceptions. These findings largely align with the existing literature that emphasizes the role of artifacts in reflecting and reinforcing organizational culture (Schein, 1992). The relatively high means suggest that the organization has created a cohesive cultural identity through its visible artifacts. However, the standard deviations highlight the nuanced nature of cultural interpretation, aligning with the critiques of Schein’s model regarding subcultures (Alankarage et al., 2024; Berger et al., 2020). The implications of these findings are twofold. Researchers have underscored the need to delve deeper into individual-level interpretations of cultural artifacts, particularly within diverse subcultures. The results positively affirm industries’ current cultural management strategies while highlighting areas where individual perceptions may differ.
SD, standard deviation
Source: Field Data, 2023
The results of the EFA in Table 3 reveal that the Organizational Culture Artifact construct comprises four distinct dimensions: abstract nouns, signs, and symbols (SI), corporate logo (CL), organized office layout (OOL), and neat dressing code (CDC). All items in each dimension have high factor loadings (above eight), which depict the high-reliability coefficients in Table 3 below. Furthermore, the item–total correlations after correction for attenuation and squared multiple correlations also suggest the validity of these dimensions. Reliability analysis displayed a Cronbach’s alpha for all dimensions greater than 0.9, indicating high reliability. These results align with the proposed switches of Schein’s (1992) model of organizational culture, which states that artifacts and behavior (symbols of an office environment, dressing codes, etc.) are observable signs of an organization’s culture. Self-generated artifacts have high factor loadings and reliability coefficients, supporting that they specify dependable cultural values. Thus, it is possible to argue that the dimensions revealed by this study mean Schneider’s model is more detailed and does not support Schein’s idea of unity in organizational culture. This is because the differentiation between symbols and icons, company logos, office environments, and dress codes suggests that these artifacts could work democratically so that they all have a part to play in shaping organizational culture.
Source: Field Data, 2023
The regression analysis in Table 4 yielded an R2 value of 0.698, indicating that approximately 69.8% of the variance in employee safety was explained by the various dimensions of organizational culture (artifacts, espoused values, and assumptions). This high R2 value suggests that organizational culture is a critical factor influencing safety outcomes within construction firms in developing countries. In practical terms, this means that enhancing the cultural dimensions within an organization, such as improving the communication of safety values and reinforcing positive symbols, could significantly boost safety performance. However, the remaining 30.2% of the unexplained variance implies that external factors such as regulatory frameworks, economic conditions, and individual behavior may also affect safety outcomes. These findings align with those of Chong (2022) and Isa et al. (2021), who highlighted the central role of organizational culture in shaping safety behaviors but also emphasized the importance of addressing external variables.
| R | R2 | Adjusted R2 | Standard error of the estimate |
|---|---|---|---|
| 0.836 | 0.698 | 0.650 | 0.42957 |
Source: Field Data, 2023
The analysis of variance (ANOVA) results presented in Table 5, an F-ratio of 14.45, and a p-value less than 0.001 indicate that organizational culture significantly influences employee safety [F(4, 25)]. This knowledge aligns with prior studies indicating that organizational culture significantly determines how employees perceive and practice safety in the workplace (Chong, 2022; Espasandín-Bustelo, Ganaza-Vargas and Diaz-Carrion, 2020). However, the study introduced some complexities in its conclusions compared to prior research. Influential organizational culture directly affects safety; however, this study influences safety through the mediating variables of job satisfaction and safety behavior (Hermanto, Syahrul and Yulihasri, 2023). This harmonizes previous findings on the relationship between organizational culture, job satisfaction, and safety practices and provides a deeper insight into how cultural factors affect an organization’s safety conditions.
| Sum of squares | df | Mean square | F | Significance | |
|---|---|---|---|---|---|
| Regression | 10.666 | 4 | 2.667 | 14.450 | 0.000 |
| Residual | 4.613 | 25 | 0.185 | ||
| Total | 15.279 | 29 |
Source: Field Data, 2023
The regression analysis results in Table 6 provide significant insights into the influence of organizational culture on employee safety. While some relationships were strongly significant, other factors, such as the company logo (beta = −0.155, p > 0.05) and office decor and layout (beta = 0.118, p > 0.05), did not show significant impacts. This lack of significance could be attributed to alternative explanations, such as the possibility that these factors are less visible or impactful in the construction industry, where the focus on safety may overshadow the importance of aesthetic elements. However, symbols and icons had a significant positive association (beta = 0.373, p < 0.05), suggesting that visual cues, such as symbols, are critical in reinforcing safety culture. Similarly, the corporate dress code had a strong positive relationship with organizational culture (beta = 0.491, p < 0.01), indicating that seemingly superficial elements, such as uniforms, can substantially promote safety. These findings align with those of Schein (1992), who emphasized the importance of artifacts in shaping organizational culture, while studies such as Alankarage et al. (2024) demonstrated how company logos may not always yield the desired cultural impact, especially in sectors such as construction, where practicality dominates aesthetic concerns.
Source: Field Data, 2023
The findings also suggest that cultural elements such as symbols and dress codes may not have uniform significance across all organizational subcultures. As highlighted by Berger et al. (2020), organizational subcultures, such as those based on departments or employee roles, can interpret and respond to cultural artifacts differently. For example, in construction, site workers may view uniforms as crucial for their identity and adherence to safety, whereas office staff may place less emphasis on such elements. This discrepancy points to organizational subcultures, which can complicate creating a homogeneous safety culture. Future research could investigate how these subcultures, especially those divided by job roles, gender, or seniority, differ in their perceptions of and adherence to cultural symbols. This approach would help address the varying influences of cultural elements across organizational layers.
Organizational culture espoused on values
The results in Table 7 show that the employees display positive perceptions toward the degree of value their organizations espouse since the mean score is above the midpoint of the Likert scale, which is 3. The most appreciated statement is “Concerning organizational commitment to values, I think that our organization holds breaches of values seriously” (M = 3.76, SD = 0.988). On the other hand, there is still significant potential for improvement, as indicated by two statements that received the lowest ratings: “Employees are encouraged to adhere to our values at work” (M = 3.03, SD = 1.239) and “recognize our organizational values reflected at work” (M = 3.13, SD = 1.210), where the relevance and incorporation of values in practice is of concern. These results are comparable with current knowledge concerning how espoused values define organizational culture (Schein, 1985). The positive perception of an organization’s commitment to values aligns with research that emphasizes the significance of leadership in fostering a strong culture (Chatman et al., 2014). However, lower ratings for integrating values into daily activities and decision-making echo concerns about the gap between espoused values and actual practices, a phenomenon often observed in organizational culture studies (McMillan and Overall, 2017).
Source: Field Data, 2023
The EFA used to discuss the dimensionality of the organizational culture-espoused values (OCVs) is presented in Table 8. All components had a corrected item–total correlation of 0.597 to 0.839, meaning that all items loaded well into their respective factors and had adequately squared multiple correlations, meaning they had good factor loadings. Using the first set of items, the Cronbach’s alpha values ranged from 0.905 to 0.918. By contrast, Cronbach’s alpha values ranged from 0.928 to 0.932 using the second set of items, confirming the scale’s internal consistency. Cronbach’s alpha was 0.918, indicating high organizational culture reliability. These findings are a result of the current research that discusses the complexity of organizational culture, including the identification of its components and the role of espoused values in enhancing organizational culture for the benefit of the organization, as embraced by scholars such as Schein (1992) and Chatman et al. (2014). The high item–total correlations and Cronbach’s alpha coefficients in the present study align with previous studies that have established the reliability and validity of similar organizational culture measures (Gochhayat, Giri and Suar, 2017). However, this study sheds light on organizational culture from a fresh perspective and its espoused values. It must be stated here that the choice of items presented in the scale is made carefully to capture the discretionary nature of how employees perceive and embrace the values an organization seeks to cultivate. This underlines a more distinct perception of this significant facet of organizational climate.
Source: Field Data, 2023
By analyzing the model summary shown in Table 9, it can be concluded that a strong correlation exists between organizational culture and the results regarding employee safety, as proven by the R2 coefficient (0.606). This indicates that organizational culture can predict approximately 60.6% of the variance in employee safety. Moreover, the remaining 39.4% of the variance not explained by organizational culture indicates that other factors influence employee safety. This underscores the necessity for a multifaceted approach to safety management. Organizations should focus on cultural elements and consider other influential factors such as leadership styles, individual behaviors, safety training effectiveness, and external regulatory environments. This holistic view allows organizations to identify and address all potential areas of improvement, further enhancing safety outcomes. The adjusted R2 value of 0.592 confirms the model’s goodness of fit for the total number of predictor variables in the equation. These results are consistent with prior research on safety climate and implementation, where organizational culture was identified as a critical factor in determining the maturity of safety culture, safety-related behavior, and consequent safety levels in employees (Chong, 2022; Espasandín-Bustelo, Ganaza-Vargas and Diaz-Carrion, 2020; Irawan and Sumartik, 2023; Isa et al., 2021). As Chong (2022) and Irawan and Sumartik (2023) highlighted, the organizational culture that supports its commitment to safety policies and procedures and increases overall job satisfaction effectively intervenes in the relationship between the safety climate and safety performance.
| R | R2 | Adjusted R2 | Standard error of the estimate |
|---|---|---|---|
| 0.778 | 0.606 | 0.592 | 0.46372 |
Source: Field Data, 2023
Nevertheless, this research differs from some literature findings, asserting that organizational culture and safety performance have a straightforward positive correlation (Irawan and Sumartik, 2023). This relates to those who postulate that the relationship is moderated by job satisfaction (Irawan and Sumartik, 2023) and safety behavior (Hermanto, Syahrul and Yulihasri, 2023). This illustrates the more complex and contextually mediated role that organizational culture can play in safety, where it can affect safety through its impact on employees’ perceived safety culture.
The model summary in Table 9 shows an R2 value of 0.606, meaning that 60.6% of the variance in employee safety can be attributed to organizational culture variables. While this suggests a strong association, the adjusted R2 value of 0.592 accounts for the number of predictors used in the model, thus providing a more accurate representation of this relationship. This highly explained variance indicates that initiatives to improve organizational culture, such as embedding safety values into daily routines and fostering transparent communication, can significantly enhance safety performance. However, the unexplained variance of approximately 40% suggests that factors beyond culture, such as individual employee motivation and operational procedures, may also play a crucial role. This is consistent with Misnan and Mohammed (2007), who noted that while culture is a key determinant of safety behavior, other organizational factors, such as leadership and external conditions, must also be considered.
Table 10 shows that the ANOVA outcome indicates a significant correlation between organizational culture and employee safety, F(1, 28) = 43.056, p < 0.001. Hence, organizational culture predicts the safety of employees in the workplace. This interactive influence rationale accords with the literature and previous studies regarding the centrality of organizational culture in influencing employees’ personal safety beliefs and practices (Chong, 2022; Espasandín-Bustelo, Ganaza-Vargas and Diaz-Carrion, 2020; Irawan and Sumartik, 2023; Isa et al., 2021). Furthermore, the study confirms that establishing a positive and robust organizational culture positively influences organizational and employee safety and promotes organizational effectiveness. However, the results of the present study contradict those of the previous studies. It also did not suggest a moderating influence of occupational satisfaction on the connection between organizational culture and employee safety, as highlighted by Irawan and Sumartik (2023). This difference may be due to differences in sample characteristics, industry context, or the approach used in the research. The conclusions of this study have two technological implications. The findings of this study imply that there is a need to conduct more studies on the factors that explain the relationship between organizational culture and employee safety, emphasizing the role of culture and industry in various relationships. For industries, the outcomes highlighted developing a positive organizational safety culture as one of the foremost tactical priorities to guarantee employee safety and attain company efficiency.
| Sum of squares | df | Mean square | F | Significance | |
|---|---|---|---|---|---|
| Regression | 9.259 | 1 | 9.259 | 43.056 | 0.000 |
| Residual | 6.021 | 28 | 0.215 | ||
| Total | 15.279 | 29 |
Source: Field Data, 2023
The analysis revealed a statistically significant positive relationship between espoused values within the organizational culture and employee safety practices (beta = 0.665, t = 6.562, p < 0.001, as shown in Table 11). This suggests that employees are likelier to adopt and adhere to safe practices when an organization explicitly communicates and promotes safety-related values. These findings align with previous research emphasizing the importance of values in shaping safe behavior (Dajani, 2015; Chong, 2022). Interestingly, this study did not find a significant relationship between employee safety and other dimensions of organizational cultures, such as artifacts and underlying assumptions. This diverges from Schein’s (1992) model, which posits that all three levels of culture influence behavior. This discrepancy could be attributed to the specific context of the study or measurement instruments used.
| Standardized coefficients | t | Significance | |||
|---|---|---|---|---|---|
| Beta | |||||
| (Constant) | 1.456 | 0.348 | 4.182 | 0.000 | |
| Organizational culture espoused on values | 0.665 | 0.101 | 0.778 | 6.562 | 0.000 |
Source: Field Data, 2023
Organizational culture assumptions
The findings in Table 12, which depict the mean and standard deviation of the responses to statements about organizational culture assumptions, reveal a complex landscape. Employees generally agreed that their organizations effectively communicated cultural assumptions (M = 3.69, SD = 1.004), ranking this as the most prominent feature. However, willingness to revisit and adapt to these assumptions as needed was less pronounced (M = 3.00, SD = 1.134), indicating a potential conflict between stability and adaptability. This aligns with Schein’s (1992) assertion that solid cultures can be change-oriented if they distinguish between fundamental and relevant assumptions. However, the above indications show that employees do not always distinguish between these performance types. Therefore, these results align with previous studies but differ in some ways. The emphasis on communication also corresponds well with the literature (Fernandes, Pereira and Wiedenhöft, 2023). However, the results for adaptability suggest a relatively lower index than the body of knowledge, which emphasizes the need for organizations to develop dynamic cultures to cope with the changing environmental context for work (McMillan and Overall, 2017; Ghani et al., 2022). This may be due to the competition between two opposing concepts: maintaining organizational values and pursuing the dynamism that organizations face. The critical consequences are related to the further advancement of researchers and industries. These insights indicate that organizations can become over-fixated on stability, which stifles their capacity to transform and experiment, and that organizational culture overemphasizes stability, which may be a barrier to change. This calls for more research on fostering the right culture that complements the traditional and change processes. The industry findings suggest that adopting the process of making cultural assumptions explicit and designing and implementing a framework for ongoing assessment and endorsement are crucial.
Source: Field Data, 2023
The percentage of variance explained in Table 13 arises from the EFA of the Organizational Cultural Assumptions (OCAs) scale, which depicts a robust and distinctly formed single factor. Regarding the reliability assessment, all items showed satisfactory levels of corrected item–total correlation, which varied from 0.587 to 0.839. Squared multiple correlations were found to be appropriate for this construct. This shows consistency in the responses obtained from the Thank You and Mam/Sir items since Cronbach’s alpha values range from 0.906 to 0.918, implying high internal consistency reliability. Simultaneously, the proposed structure of the unidimensional organization is consistent with Schein’s (1992) model and focuses on the organization’s coherent collection of assumptions. This high internal consistency resembles other studies with similar research that has established the reliability of the OCAs scale (Fernandes, Pereira and Wiedenhöft, 2023). Schein’s model, however, frequently points to the conception of a singular organizational culture that envelopes everyone; hence, the outcomes of this research do not exclude subcultures. A relatively high loading factor indicated that there was no second hidden culture. However, the participants’ responses specific to individual items may show minor differences in the assumptions made.
Source: Field Data, 2023
Table 14 presents an R2 value of 0.512, indicating that the underlying assumptions of organizational culture can explain 51.2% of the variance in employee safety. While this R2 value is lower than that of the other models, it still demonstrates that cultural assumptions, such as deeply ingrained safety beliefs and values, substantially impact the perception and practice of safety. This finding implies that organizations should focus on making implicit cultural assumptions explicit and continuously reassessing them to ensure they align with evolving safety needs. The unexplained 48.8% suggests that other aspects, such as leadership effectiveness, job satisfaction, or specific safety interventions, might mediate the relationship between culture and safety. This aligns with Schein’s (1992) model, which emphasizes that assumptions are foundational to organizational behavior but may require reinforcement through other organizational systems to impact safety outcomes fully.
| R | R2 | Adjusted R2 | Standard error of the estimate |
|---|---|---|---|
| 0.715 | 0.512 | 0.494 | 0.51628 |
Source: Field Data, 2023
As shown in Table 15, the results of the ANOVA test indicate a significant relationship between organizational culture and employee safety [F(1, 28) = 29.324, p < 0.001]. This finding aligns with previous research demonstrating a positive association between a strong safety culture and reduced workplace incidents (Chong, 2022; Espasandín-Bustelo, Ganaza-Vargas and Diaz-Carrion, 2020). The significant regression model (R2 = 0.512) suggests that organizational culture accounts for a substantial proportion of the variance in employee safety, emphasizing its crucial role in shaping safe behaviors and attitudes. However, the findings deviate from some studies that report an indirect effect of organizational culture on safety through job satisfaction (Irawan and Sumartik, 2023) or safety behavior (Hermanto, Syahrul and Yulihasri, 2023). In this study, the direct impact of organizational culture on safety was significant, implying that a strong safety culture may not always require job satisfaction or explicit safety behaviors as intermediaries.
| Sum of squares | df | Mean square | F | Significance | |
|---|---|---|---|---|---|
| Regression | 7.816 | 1 | 7.816 | 29.324 | 0.000 |
| Residual | 7.463 | 28 | 0.267 | ||
| Total | 15.279 | 29 |
Source: Field Data, 2023
Table 16 reports an R2 value of 0.452, showing that cultural assumptions explain 45.2% of the variance in employee safety behavior. While this is lower than in previous models, it still indicates a significant relationship between organizational culture and safety practices. The practical implication here is that focusing solely on improving cultural assumptions, while impactful, may not fully ensure safe behavior. The remaining 54.8% of the variance points to other influential factors such as external regulations, individual employee characteristics, and industry-specific risks. These findings suggest that while cultivating a positive safety culture is essential, it should be complemented by tailored safety programs and leadership initiatives to achieve comprehensive safety improvements. As Gochhayat, Giri and Suar (2017) noted, safety interventions should integrate organizational culture with broader management practices to fully realize their potential to improve safety behaviors.
| Standardized coefficients | t | Significance | |||
|---|---|---|---|---|---|
| Beta | |||||
| (Constant) | 1.409 | 0.428 | 3.289 | 0.003 | |
| Organizational culture assumptions | 0.673 | 0.124 | 0.715 | 5.415 | 0.000 |
Source: Field Data, 2023
Summary of findings
This study demonstrates that organizational culture patterns involve several aspects related to worker protection. Employees have a positive attitude toward organizational symbols, icons, and dress codes, signaling the organizational culture and flow of organizational symbols. However, the dress code is significant in the study of organizational culture. Whereas enacted values are affiliated with positive perceptions, there is room for enhancing efforts toward institutionalization in everyday processes. It was further observed that organizational culture is positively correlated with the level of employee safety, and this variable explains the remaining variation in safety results. Most notably, it can be concluded that the hypothesized connection between all three levels of organizational culture (artifacts, espoused values, and assumptions) and safety is substantial and positive, with the effects of shared assumptions being particularly salient. Specifically, these outcomes suggest that safety scientists must focus more on developing an organizational safety culture that goes beyond superficial symbols and embraces the full range of formal and informal organizational safety climates to improve employee safety and organizational performance.
Conclusions and recommendations
This study provides clear evidence that supports the fact that an organization’s safety culture influences employee safety in the construction industry in developing countries. Consequently, this study shows that organizational culture artifacts, espoused values, and assumed values correlate significantly and positively with overall perceived safety among employees. This underlines the necessity of an integrated methodological approach to form an influential safety culture by managing the stated values, easily observable symbolic signs, and structural, philosophical, and epistemological beliefs in the organizational workspace. This study is in tandem with other studies that highlight the place of organizational culture but reveal new perspectives. Notably, most organizational cultures impact safety outcomes directly and significantly, which was not moderated by job satisfaction or safety behaviors as found in previous studies; this hints at the fact that organizational culture wields a more direct and consequential influence.
Moreover, highlighting the cultural elements that are most relevant and can be appropriately associated with organizational culture, including symbols and dress codes, can provide practitioners with valuable suggestions for improving performance. The relevance of these findings is enormous because they call for a new understanding of the role of schools in producing social capital. The present study also highlights the need for more research to clarify the effects of various dimensions of organizational culture on safety behaviors. Subsequent studies should include leadership, communication, and training as elements contributing to implementing cultural beliefs in tangible security measures. The credibility of cultural change initiatives gives practitioners reason to engage in safety exoticism. This could entail a redesign of spaces such as offices and workshops to include safety signs and symbols, setting organizational standards that can enhance safe behaviors such as apparel, and providing orientation programs that address such safety culture that is unhealthy for safety. The potential and broader societal implications include minimizing losses by preventing or reducing the number of workplace accidents and deaths, particularly in the construction industry in the developing world, where workplace safety is relatively low. Thus, skillful management of safety culture within organizations helps organizations improve the safety and productivity of their employees and work processes and the development of the economy of the communities to which these organizations belong.
To effectively integrate organizational cultural changes that enhance employee safety, a step-by-step approach can be designed to draw on theoretical frameworks and practical examples from successful case studies. The suggested implementation plan is as follows.
1. Assessment of current safety culture: Conduct an internal audit using surveys and focus groups to evaluate the current state of safety-related organizational culture. Assess areas such as communication, employee engagement, and leadership involvement in safety protocols.
2. Development of a strategic plan: Based on the audit results, develop a clear strategy that outlines desired cultural changes. This should include specific goals such as improving safety communication and reinforcing safety-related dress codes. An example could be using symbols and signage, successfully implemented in Malaysia’s construction sector (Chong, 2022).
3. Leadership involvement: Ensure that leadership actively promotes a safety culture. Leaders should model safety behaviors and integrate safety into their decision-making processes. A case study from Australia’s mining industry demonstrated the importance of leadership in promoting a safety culture, significantly reducing workplace accidents (Johnston et al., 2020).
4. Training and reinforcement: Implement regular training programs to reinforce safety values and practices. Use case studies from companies like Siemens that have embedded safety training in their corporate culture, leading to enhanced safety adherence (Isa et al., 2021).
5. Monitoring and evaluation of progress: Establish a system for ongoing monitoring and evaluation. Regularly update safety protocols based on employee feedback and emerging best practices. A successful example of this approach is Singapore’s construction sector, where continuous evaluation has led to a 30% reduction in workplace accidents (Hermanto, Syahrul and Yulihasri, 2023).
The results of this study have important implications for furthering the research knowledge base for specific industries. Consequently, this study emphasizes the importance of understanding the pathways through which organizational culture impacts safety. Thus, for industries, the outcomes stress the significance of developing an organizational culture that promotes the adoption of safety-related approaches and improves employee satisfaction and compliance with safe practices. This comprehensive approach is widely accepted and positively affects safety results, results in minimal accidents, and increases industrial performance.
Implications for research
This study on organizational culture and its relationship with organizational security in terms of employee protection has shown that this is not a simple relationship that should be easily defined, and there is a need for further research. Several essential implications for subsequent research have been identified, including awareness of and advancements in this field. These implications underscore the need for more extensive, complex, and multidisciplinary research to examine the relationship between organizational culture and safety as outcomes. They also emphasized the need to refine safety culture assessments and examine diverse avenues through which culture impacts safety. The following research implications guide scholars wishing to progress their studies in this critical area and help enhance workplace safety.
This research on organizational culture and its influence on employee safety requires a total examination of the first-order and second-order effects. Researchers should further investigate how organizational culture affects safety, moderating variables, and the role of interaction effects. This approach requires management to focus on cultural dimensions, pay particular attention to details, and review the influence and impact of certain aspects of organizational culture on safety and related behaviors and orientations. Therefore, it is necessary to develop more accurate assessment instruments. Developing instruments such as Organizational Culture Values (OCV) and Organizational Cultural Assumptions (OCAs) offers practical ways to measure the influence of organizational culture on safety. These tools allow researchers to study the interactions between cultural factors and safety results. One potential direction for future research is to examine the relationships between various aspects of culture and indices of actual safety performance. To this end, researchers should examine the organizational structure and processes that translate values and behavior to explore how cultural factors develop into actual safety measures.
To conclude, this exploration should be conducted across different contexts and within various industries to help reveal the specifics of the relationship between organizational culture and safety. To obtain a broader view, further studies should consider other potential variables, including leadership, communication, and specific aspects of safety culture. By adopting this systemic perspective, it will be possible to reveal the various factors that interact to determine organizational safety concerns.
Furthermore, researchers should pay attention to the potential negative impacts of cultural assumptions on safety and recommend auditing culture concerning culture audits. Because of the layered and multifaceted nature of organizational culture and its relationship to and influence on safety, such an approach is justified. Crossing the boundaries between organizational psychology, safety science, and management studies provides a broader perspective. This comprehensive approach will generate theoretical innovation and foster a practical understanding of safety enhancements in various organizations. One critical implication for future research is the need to study how subcultures may mediate the relationship between organizational culture and safety outcomes. While an overarching organizational culture may promote certain safety-related values, subcultures may interpret and implement these values uniquely. Researchers should investigate how these subcultural variations influence safety-related behaviors, communication, and perceptions and how they align or conflict with the broader organizational culture. This inquiry could uncover why safety practices that work well in one department may not be as effective in another, highlighting the importance of customized safety strategies.
Limitations
Some of the limitations that would be worth mentioning concerning this study include the following: The data used in this study are cross-sectional, and there is also the possibility of self-reporting bias. Furthermore, this study was limited to only one industry and geographical area. Subsequent studies should use longitudinal and cross-sectional approaches with different samples to check the transportability of the conclusions to different organizational types and settings.
References
Adekanmbi, F. and Ukpere, W. 2023, “The impacts of perceived leadership integrity, psychological safety, and organizational culture in sustaining employee voice,” International Journal of Research in Business and Social Science (2147-4478), 12(7):199–207, https://doi.org/10.20525/ijrbs.v12i7.2884
Ahmad, T. L, Fitria, H. and Hakim, C. B. 2022, “The Influence of Work Safety Culture and Work Safety Monitoring System On Work Safety,” Journal of Industrial Engineering and Halal Industries, 3(1):57–63, https://doi.org/10.14421/jiehis.3486
Alankarage, S. M. H. 2024, A Framework for Managing BIM-enabled Construction Organisations Through Innovative Bim Culture (Doctoral dissertation, University of South Australia). https://hdl.handle.net/11541.2/38691
Berger, E. J., Wu, C., Briody, E. K., Wirtz, E. and Rodríguez‐Mejía, F. 2020, “Faculty subcultures in engineering and their implications for organizational change,” Journal of Engineering Education, 110(1):230–251, https://doi.org/10.1002/jee.20370
Bisbey, T. M., Kilcullen, M. P., Thomas, E. J., Ottosen, M. J., Tsao, K. and Salas, E. 2019, “Safety Culture: An Integration of Existing Models and a Framework for Understanding Its Development,” Human Factors the Journal of the Human Factors and Ergonomics Society, 63(1):88–110, https://doi.org/10.1177/0018720819868878
Bujang, M. A., Omar, E. D. and Baharum, N. A. 2018, “A review on sample size determination for Cronbach’s Alpha Test: a simple guide for researchers,” Malaysian Journal of Medical Sciences, 25(6):85–99, https://doi.org/10.21315/mjms2018.25.6.9
Chatman, J. A., Caldwell, D. F., O’Reilly, C. A. and Doerr, B. 2014, “Parsing organizational culture: How the norm for adaptability influences the relationship between culture consensus and financial performance in high-technology firms,” Journal of Organizational Behavior, 35(6):785–808, https://doi.org/10.1002/job.1928
Chong, D. 2022, “The influence of organizational justice and organizational culture on employee loyalty,” Dinasti International Journal of Management Science, 4(1):175–185, https://doi.org/10.31933/dijms.v4i1.1469
Dabbagh, A., Seens, H., Fraser, J. and MacDermid, J. C. 2023, “Construct validity and internal consistency of the Home and Family Work Roles Questionnaires: a cross-sectional study with exploratory factor analysis,” BMC Women S Health, 23(1), https://doi.org/10.1186/s12905-023-02199-1
Dajani, M. A. Z. 2015, “The impact of employee engagement on job performance and organisational commitment in the Egyptian banking sector,” Nihon Keiei Gakkaishi, 3(5):138–147, http://article.businessmanagementsciences.com/pdf/JBMS-3-5-1.pdf
De Brún, A., Anjara, S., Cunningham, U., Khurshid, Z., Macdonald, S., O’Donovan, R., Rogers, L. and McAuliffe, E. 2020, “The Collective Leadership for Safety Culture (CO-LEAD) team intervention to promote teamwork and patient safety,” International Journal of Environmental Research and Public Health, 17(22):8673, https://doi.org/10.3390/ijerph17228673
Efimova, O. V. and Komarova, Yu, V. 2019, “Safety culture as an element of organisation culture of transport companies,” World of Transport and Transportation, 17(3):234–245, https://doi.org/10.30932/1992-3252-2019-17-3-234-245.
Espasandín-Bustelo, F., Ganaza-Vargas, J. and Diaz-Carrion, R. 2020, “Employee happiness and corporate social responsibility: the role of organizational culture,” Employee Relations, 43(3):609–629, https://doi.org/10.1108/er-07-2020-0343
Fernandes, P., Pereira, R. and Wiedenhöft, G. 2023, “Organizational culture and the individuals’ discretionary behaviours at work: a cross-cultural analysis,” Frontiers in Sociology, 8, https://doi.org/10.3389/fsoc.2023.1190488
Ghani, B., Memon, K.R., Han, H., Ariza-Montes, A. and Arjona-Fuentes, J.M. 2022, “Work stress, technological changes, and job insecurity in the retail organization context,” Frontiers in Psychology, 13, https://doi.org/10.3389/fpsyg.2022.918065
Gochhayat, J., Giri, V. N. and Suar, D. 2017, “Influence of organizational culture on organizational effectiveness: The mediating role of organizational communication,” Global Business Review, 18(3):691–702, https://doi.org/10.1177/0972150917692185
Graham, J. R., Grennan, J., Harvey, C.R., and Rajgopal, S. 2022, “Corporate culture: Evidence from the field,” Journal of Financial Economics, 146(2):552–593, https://doi.org/10.1016/j.jfineco.2022.07.008
Gulua, E. 2018, “Organizational culture management challenges,” European Journal of Interdisciplinary Studies, 10(1):67, https://doi.org/10.26417/ejis.v10i1.p67-79
Hermanto, B., Syahrul, L. and Yulihasri, Y. 2023, “The Influence of Organizational Culture, Work Environment, and Competence on Safety Health Occupation (SHO) Laboratory Employees with Safety Behavior as a Mediation Variable,” Journal of Social Research, 2(8):2773–2789, https://doi.org/10.55324/josr.v2i8.1335
Irawan, B. and Sumartik, N. 2023, “Employee Performance: Organizational Culture, Occupational Health and Safety (K3), with Job Satisfaction as a Mediator,” Academia Open, 9(2), https://doi.org/10.21070/acopen.9.2024.5561
Isa, A. A. M., Wahab, W. A., Omar, R. C., Nordin, M. Z. M., Taha, H. and Roslan, R. 2021, “Factors influencing the compliance of workplace safety culture in the government linked company (GLC),” E3S Web of Conferences, 32506005, https://doi.org/10.1051/e3sconf/202132506005
Johnston, D., Pagell, M., Veltri, A. and Klassen, R. 2020, “Values-in-action that support safe production,” Journal of Safety Research, 7275–91, https://doi.org/10.1016/j.jsr.2019.11.004
Joshi, A., Kale, S., Chandel, S. and Pal, D. 2015, “Likert scale: explored and explained,” British Journal of Applied Science and Technology, 7(4):396–403, https://doi.org/10.9734/BJAST/2015/14975
Marchand, A., and Haines, V. Y. and Dextras-Gauthier, J. 2013, “Quantitative analysis of organizational culture in occupational health research: a theory-based validation in 30 workplaces of the organizational culture profile instrument,” BMC Public Health, 13(1), https://doi.org/10.1186/1471-2458-13-443
McMillan, C. J. and Overall, J. S. 2017, “Crossing the Chasm and Over the Abyss: Perspectives on Organizational Failure,” Academy of Management Perspectives, 31(4):271–287, https://doi.org/10.5465/amp.2017.0018
Misnan, M. S. and Mohammed, A. H. 2007, “Development of safety culture in the construction industry: a conceptual framework”. In: Boyd, D (Ed) Procs 23rd Annual ARCOM Conference, 3-5, September 2007, Belfast, UK, Association of Researchers in Construction Management, 13-22.
Morgan, A., and Kidombo, H. 2022, “Organisational Culture and Information Technology Projects Success: The Role of Participatory Planning and Organisational Commitment,” IJRDO - Journal of Business Management, 8(7):53–59, https://doi.org/10.53555/bm.v8i7.5199
Motlhale, K. J. 2018, An investigation of the integration challenges of informal contractors in the formal economy : a South African perspective, https://doi.org/10.51415/10321/3327
Mustapha, Z., Akomah, B.B., Zebilila, M.D., Tieru, C.K., Oppon, J.A. and Aidoo, P., 2024. Occupational Stress and Its Impact on Health, Safety, and Performance Among Construction Workers in Ghana’s Central Region. The Asian Review of Civil Engineering, 13(1), pp.22-29. https://doi.org/10.70112/tarce-2024.13.1.4231
Rahman, A. and Muktadir, MdG. 2021, “SPSS: an imperative quantitative data analysis tool for social science research,” International Journal of Research and Innovation in Social Science, 05(10):300–302, https://doi.org/10.47772/IJRISS.2021.51012
Rana, J., Gutierrez, P. L. and Oldroyd, J. C. 2021, “Quantitative methods,” in Springer eBooks, pp. 1–6, https://doi.org/10.1007/978-3-319-31816-5_460-1
Saifi, S. A. A. 2015, “Positioning organisational culture in knowledge management research,” Journal of Knowledge Management, 19(2):164–189, https://doi.org/10.1108/JKM-07-2014-0287
Schein, E.H. 1992, “Organizational Culture and Leadership: A Dynamic View. 2nd Edition”, Jossey-Bass, San Francisco.
Schein, E. H. 1985, “Organizational Culture and Leadership”. San Francisco: Jossey-Bass.
Tavakol, M., and Dennick, R. 2011, “Making sense of Cronbach’s alpha,” International Journal of Medical Education, 253–55, https://doi.org/10.5116/ijme.4dfb.8dfd
Torres, A.I, Ferraz, S.S and Santos-Rodrigues, H 2018, “The impact of knowledge management factors in organizational sustainable competitive advantage,” Journal of Intellectual Capital, 19(2):453–472, https://doi.org/10.1108/JIC-12-2016-0143
Wahab, S. F. A., Ismail, A. R., and Othman, R. 2017, “Qualitative, quantitative or mixed: which is the most preferred for healthcare studies,” in Advances in intelligent systems and computing, pp. 331–336, https://doi.org/10.1007/978-3-319-60483-1_33
Zakharchyn, H. 2022, “The Factor of Organizational Culture in the System of Organizational Behavior,” Market Infrastructure, (66), https://doi.org/10.32843/infrastruct66-19
Zhang, Q., Chan, A. P. C., Yang, Y., Guan, J. and Choi, T. N. Y. 2023, “Influence of Learning from Incidents, Safety Information Flow, and Resilient Safety Culture on Construction Safety Performance,” Journal of Management in Engineering, 39(3), https://doi.org/10.1061/JMENEA.MEENG-5223