Construction Economics and Building
Vol. 25, No. 1
March 2025
RESEARCH ARTICLE
Machine Learning Applications for Predicting Longitudinal Cracking in Continuously Reinforced Concrete Pavement
Ali Alnaqbi1,*, Ghazi G. Al-Khateeb1, Waleed Zeiada1,2
1 Department of Civil and Environmental Engineering, University of Sharjah, Sharjah P.O. Box 27272, United Arab Emirates
2 Department of Public Works Engineering, Mansoura
Corresponding author: Ali Alnaqbi, College of Engineering, University of Sharjah, UAE , U21102866@sharjah.ac.ae
DOI: https://doi.org/10.5130/AJCEB.v25i1.9143
Article History: Received 15/05/2024; Revised 17/09/2024; Accepted 27/09/2024; Published 31/03/2025
Citation: Alnaqbi, A., Al-Khateeb, G.G., Zeiada, W. 2025. Machine Learning Applications for Predicting Longitudinal Cracking in Continuously Reinforced Concrete Pavement. Construction Economics and Building, 25:1, 143–170. https://doi.org/10.5130/AJCEB.v25i1.9143
Abstract
The longevity of continuously reinforced concrete pavement (CRCP) depends on the accurate prediction of longitudinal cracking. In this work, longitudinal cracking is predicted using machine learning algorithms, and data from the long-term pavement performance (LTPP) database. Multiple models, such as support vector machines (SVM), ensemble trees, Gaussian process regression (GPR), linear regression, regression trees, artificial neural networks (ANN), and kernel approaches, are compared. The Random Forest approach is used in statistical studies and feature relevance evaluation to identify temperature and annual average daily truck traffic (AADTT) as important predictors. R-squared and root mean squared error (RMSE) metrics are used to assess the models. Regression trees and ensemble approaches also perform competitively, but the GPR model with a squared exponential kernel performs better than the others, obtaining the best R-squared value (0.78) and the lowest RMSE (11.84). The study illustrates the shortcomings of traditional regression models and the benefits of sophisticated machine learning methods for identifying intricate nonlinear correlations. Sensitivity analysis demonstrates that pavement age, traffic loads, and environmental factors—specifically, temperature and precipitation—have a considerable impact on longitudinal cracking.
Keywords
Longitudinal Cracking; Continuously Reinforced Concrete Pavement; LTPP; Statistical Analysis; Machine Learning
Introduction
Continuously reinforced concrete pavement (CRCP) is a widely used pavement type in transportation infrastructure due to its exceptional durability and longevity (Benmokrane, et al., 2020). Unlike traditional concrete pavements, CRCP employs continuous reinforcement, eliminating the need for expansion joints (Roesler, et al., 2011). This unique feature, achieved by reinforcing the concrete with a continuous grid of steel bars, provides exceptional resistance to cracking and faulting (Bansal, 2019).
CRCP exhibits remarkable durability due to the absence of expansion joints, which are the primary cause of pavement deterioration (Abadin, et al., 2023). By eliminating these joints, CRCP effectively mitigates the infiltration of moisture and incompressible materials, significantly reducing the occurrence of spalling, cracking, and faulting. This innovative design results in a pavement that can endure heavy traffic loads and adverse weather conditions for an extended period (Kohler and Roesler, 2006).
CRCP also offers superior load transfer efficiency compared to jointed concrete pavements (Benmokrane, et al., 2020). The continuous reinforcement ensures that loads are effectively distributed across the entire pavement structure, preventing localized stress concentrations and minimizing the risk of structural failure (Roesler, et al., 2011). This exceptional load transfer capability contributes to the pavement’s ability to withstand heavy axle loads and maintain its integrity under demanding traffic conditions (Abadin, et al., 2023).
Furthermore, CRCP exhibits reduced maintenance requirements due to its inherent durability (Bansal, 2019). The absence of expansion joints eliminates the need for routine maintenance tasks associated with these joints, such as sealing and crack filling (Kohler and Roesler, 2006). This design characteristic reduces the occurrence of joint-related distresses, which are common in other types of pavements. Additionally, the continuous reinforcement in CRCP helps distribute stresses more evenly, thereby reducing the likelihood of major cracking and structural failures. As a result, CRCP offers significant life cycle cost savings by minimizing maintenance expenses and extending the pavement’s service life (Roesler, et al., 2011). This extended service life and reduced maintenance requirement translate to less frequent road closures and repairs, enhancing overall road user satisfaction and safety.
The condition of pavements is of paramount importance for ensuring the safety, efficiency, and smooth flow of transportation (Chakroborty and Das, 2017). Healthy and well-maintained pavements provide numerous benefits, including improved ride quality, reduced vehicle operating costs, and enhanced safety for road users (Khahro, et al., 2021). Conversely, distressed pavements can lead to a myriad of problems that negatively impact transportation and the economy (Love and Ika, 2021).
Longitudinal cracking, a common form of pavement distress, significantly impacts pavement performance and safety (Adlinge and Gupta, 2013). These cracks, running parallel to the direction of traffic, cause multiple issues that deteriorate the pavement’s integrity. Primarily, they allow water to infiltrate the pavement structure, weakening the foundation and accelerating deterioration. This infiltration can lead to further cracking, potholes, and other structural problems, compromising the overall durability and functionality of the pavement. Additionally, longitudinal cracks can pose safety hazards to vehicles by creating uneven surfaces and potentially causing loss of control. Thus, understanding and mitigating longitudinal cracking are crucial for maintaining pavement performance and ensuring road safety.
Also, longitudinal cracks can create uneven surfaces and reduce skid resistance, making them hazardous for vehicles, especially motorcycles and bicycles. The presence of cracks can also increase noise levels generated by traffic, causing disturbances to nearby communities. Furthermore, longitudinal cracks can contribute to tire wear and increase vehicle maintenance costs for motorists.
The economic implications of pavement distress are significant (Love and Ika, 2021). Poor pavement conditions can lead to increased vehicle operating costs due to higher fuel consumption, tire wear, and suspension damage. Additionally, pavement repairs and replacements are costly, diverting valuable resources that could be used for other transportation improvements.
Predicting longitudinal cracking in CRCP using traditional methods presents several challenges (Liu, et al., 2023). These methods, often based on empirical relationships and statistical models, have limitations in capturing the complex mechanisms that contribute to cracking.
Predicting longitudinal cracking in CRCP using traditional methods presents several challenges (Liu, et al., 2023). These methods, often relying on empirical relationships and statistical models, face limitations in accurately capturing the complex mechanisms contributing to cracking. For instance, empirical models developed for jointed plain concrete pavements (JPCP), such as the one by Xiao and Wu (2018), incorporate variables like slab geometry, traffic loading, and base support. However, these models, with an R-squared value of 0.47, assume linear relationships and may not capture the nonlinear behaviors exhibited by pavement materials under varying environmental and loading conditions (Xiao and Wu, 2018). This highlights the novelty of our manuscript, which leverages advanced machine learning techniques to better model these complex interactions and improve predictive accuracy.
One of the primary challenges lies in the variability of pavement materials and construction practices (Bansal, 2019). The properties of concrete, steel reinforcement, and subgrade conditions can vary significantly, affecting the pavement’s response to traffic loads and environmental factors. Traditional methods may not adequately account for these variations, leading to inaccurate predictions.
Another challenge is the difficulty in quantifying the effects of traffic loading on CRCP (Benmokrane, et al., 2020). Traffic loads, particularly heavy axle loads, play a significant role in initiating and propagating longitudinal cracks. However, traditional methods often rely on simplified traffic loading models that do not capture the dynamic interactions between vehicles and the pavement structure.
Furthermore, current practices in pavement management often lack the necessary data and tools for accurate longitudinal cracking prediction (Peraka and Biligiri, 2020). Pavement condition data collection and analysis are typically limited to visual inspections and basic distress surveys. These methods may not provide sufficient information to identify the root causes of cracking or to develop effective maintenance strategies.
To address these challenges, researchers are exploring advanced modeling techniques and data-driven approaches for longitudinal cracking prediction (Xie, et al., 2020). These methods, such as finite element modeling and machine learning algorithms, offer the potential to better capture the complex interactions between pavement materials, traffic loading, and environmental factors. By leveraging these advancements, pavement engineers can develop more accurate and reliable prediction models, leading to improved pavement management and maintenance strategies.
Machine learning stands as a transformative approach revolutionizing the field of predicting pavement distress, as highlighted by several studies on the subject (Nash, et al., 2018; Huang, 2023; Guan, et al., 2023). Unlike traditional methods, which often rely on predetermined rules and equations, machine learning empowers systems to learn and adapt from data, offering a dynamic and efficient way to forecast pavement conditions. These studies emphasize the pivotal role of machine learning in enhancing the accuracy and efficiency of pavement distress prediction models.
One remarkable aspect of machine learning in the context of predicting pavement distress is its ability to leverage vast datasets, exemplified by the wealth of information available in the Long-Term Pavement Performance (LTPP) database (Elkins and Ostrom, 2021). This extensive repository encompasses a comprehensive range of variables, including traffic loads, environmental conditions, and material properties, providing a rich tapestry of information for machine learning algorithms to analyze. The application of machine learning techniques to pavement distress prediction has been widely acknowledged, with studies demonstrating the effectiveness of leveraging large datasets such as those within the LTPP database (Martin and Choummanivong, 2016).
The volume and diversity of data within the LTPP database enable machine learning models to discern nuanced patterns that might elude traditional analytical approaches. Utilizing big data enhances prediction accuracy, offering a nuanced understanding of pavement deterioration factors. This sentiment is echoed in the work of Wang, et al. (2017), where machine learning-based pavement performance prediction using LTPP data is explored, underscoring the significance of leveraging extensive datasets.
Machine learning transforms a deterministic process into a dynamic data-driven one, unlocking potential within large datasets like those in the LTPP database. This improves prediction accuracy and provides deeper comprehension of interactions shaping pavement conditions. Integrating machine learning into pavement management systems promises to optimize maintenance and ensure road network longevity.
The LTPP database, highlighted by various studies, serves as a comprehensive resource in pavement engineering (Selezneva, et al., 2022). Developed by the Federal Highway Administration (FHWA), it archives data from experimental pavement sections across North America (Chang, et al., 2016), covering diverse climatic zones, materials, and construction practices. This extensive collection provides researchers with rich insights into pavement performance.
In our study, the LTPP database’s extensive and longitudinal nature is crucial, as emphasized by reports on the LTPP program’s history and overview (Corley-Lay and Mastin, 2009). The database encompasses traffic loads, environmental conditions, material properties, and construction practices, allowing for robust analysis of pavement behavior over time.
Our study draws inspiration from foundational works, such as the guide for mechanistic-empirical design of new and rehabilitated pavement structures (Lali, 2023). The LTPP database helps refine and validate predictive models, identifying critical factors influencing pavement durability and resilience. This extensive temporal perspective enhances accuracy and applicability in real-world scenarios, improving transportation infrastructure sustainability and performance.
A noticeable research gap exists in applying machine learning to predict longitudinal cracking in CRCP (Mokhtari, 2015; Shtayat, 2022). While many studies explore machine learning in pavement distress prediction, few address the unique challenges of CRCP. This gap highlights the need for tailored models and methodologies, as emphasized in the LTPP Program’s comprehensive analysis (Uddin, 2015).
The motivation behind our study stems from recognizing a significant research gap in predicting longitudinal cracking in CRCP, which necessitates a comprehensive approach (Kim, et al., 2019; Won, 2011). Longitudinal cracking in CRCP poses unique challenges influenced by factors such as steel reinforcement, construction practices, and environmental conditions, as highlighted in CRCP performance analyses (Sudoi, 2008). These complexities demand a specialized machine learning approach for accurate and effective prediction.
Our motivation is twofold: first, to enhance understanding of the factors influencing longitudinal cracking in CRCP through machine learning, leveraging insights from the LTPP Program’s analysis (Uddin, 2015); and second, to develop a predictive model that improves distress prediction accuracy, facilitating more informed and proactive maintenance strategies. By addressing this research gap, our study aims to substantially contribute to pavement engineering, offering practitioners and researchers a valuable tool for optimizing CRCP maintenance practices and ensuring the sustainability of this crucial transportation infrastructure component.
Research objectives
The main objective of this research is to analyze various machine learning methods for predicting longitudinal cracking in CRCP using LTPP data. The specific objectives are as follows:
1. Data exploration: Provide an overview of the LTPP dataset’s structure and variables relevant to longitudinal cracking.
2. Statistical analysis: Analyze the distribution and variability of variables associated with longitudinal cracking.
3. Feature importance: Identify key features affecting longitudinal cracking using statistical methods.
4. Model development: Develop predictive models using Linear Regression, decision tree, support vector machine (SVM), ensemble tree, Gaussian process regression (GPR), artificial neural networks (ANN), and kernel methods.
5. Model evaluation: Assess model performance using metrics like mean squared error (MSE) and R-squared.
6. Model comparison: Compare models’ performance using root mean squared error (RMSE) and R-squared to identify the most effective approach for predicting longitudinal cracking.
7. Sensitivity analysis: Perform a sensitivity analysis on the best-performing model to understand the impact of individual variables on longitudinal cracking.
8. Practical implications: Provide practical recommendations based on the findings, emphasizing how the results can be applied in pavement maintenance and management strategies.
Methodology
The research study adhered to a systematic methodology delineated across various stages, as depicted in Figure 1. Initially, data retrieval involved extracting asphalt pavement control sections from both cold and warm climate zones, resulting in the selection of 33 sections that represented diverse climatic conditions. Subsequently, the raw data underwent thorough processing, integration, and cleaning to ensure their suitability for exploration, visualization, and modeling. In this study, longitudinal cracking in CRCP served as the primary pavement performance indicator, acting as the principal dependent variable for analysis. The research aimed to investigate the relationship between longitudinal cracking in CRCP and all other independent variables (features) to discern any notable patterns. Cutting-edge machine learning models were then employed to develop highly effective prediction models for longitudinal cracking in CRCP. Recognizing the uncertainty surrounding the optimal machine learning technique for modeling longitudinal cracking in CRCP, the study advocated the use of multiple techniques. Consequently, six state-of-the-art machine learning techniques were selected, namely, regression tree, support vector machine, ensembles, Gaussian process regression, artificial neural network, and kernel. Further details on these six techniques will be elucidated below.

Figure 1. Methodology framework.
It is important to note that the data preprocessing, filtering, visualization, and modeling stages were carried out using a combination of Microsoft Excel©, Microsoft Access©, Minitab, and MATLAB©. More details of the methodology part are mentioned in the subsections below:
Statistical analysis
In the initial stage of our methodology, we commence with a comprehensive descriptive statistical analysis aimed at shedding light on the key characteristics of the dataset. This involves calculating essential statistical measures such as mean, median, mode, standard deviation, and range for relevant variables. The presentation of summary statistics will offer a nuanced understanding of the central tendency and dispersion within the dataset. Additionally, graphical representations, including box plots, will be utilized to assess the distribution of the data visually.
A histogram of the output variable will be constructed, specifically focusing on longitudinal cracking. This histogram serves as a visual tool to illuminate the frequency distribution of the output variable, providing insights into the underlying distribution pattern. The shape of the histogram will be scrutinized to extract valuable information about the distribution characteristics.
Next, we applied conventional regression modeling using Minitab software to derive an equation representing the relationship between predictor variables and longitudinal cracking. This process involved conducting a regression analysis to calculate the coefficients for each predictor variable. To assess the significance of the regression model, an analysis of variance (ANOVA) was performed.
The subsequent step in our methodology involves the validation of the conventional regression model and its underlying assumptions. Normality, linearity, and homoscedasticity of residuals will be assessed, and diagnostic plots will be utilized for validation. Any necessary adjustments or transformations required to meet the model assumptions will be discussed in this section, ensuring the reliability of subsequent analyses.
Correlation matrix and feature importance assessment
In the initial phase of our methodology tailored for the study on longitudinal cracking, we initiate the computation of a correlation matrix to explore the relationships among input features. The dataset is imported, and using MATLAB, we calculate the correlation matrix by analyzing the relationships between the first 16 variables. Subsequently, for enhanced interpretability, we generate a heatmap visualization. This heatmap serves as a graphical representation of the correlation matrix, offering insights into the strength and directionality of the relationships among the input features.
Continuing with our methodology, we extend our approach to the assessment of feature importance utilizing the Random Forest algorithm. Using Random Forest, previously hidden and subtle linkages in the dataset were revealed, allowing for the development of a more precise and resilient predictive model for “longitudinal Cracking (m).” This method is extremely useful in pavement engineering and management because it provides critical insights into how different design aspects affect pavement longitudinal, which is necessary for informed decision-making and optimum maintenance methods.
We performed data preparation prior to using the Random Forest feature importance approach to ensure the dataset’s integrity and suitability for analysis. This procedure included cleansing the data, addressing any missing values, and confirming the presence of the critical input features and the target variable.
A Random Forest regression model was created to assess the impact of various design elements on fatigue cracking. Here is a rundown of the stages involved in building this model:
1. Data splitting: The dataset was divided into two parts: the first contained 40 design-related features of the pavement (X), while the second included the target variable, longitudinal cracking, which is critical for assessing pavement performance.
2. Ensemble learning: In this study, an ensemble of 100 decision trees was utilized, which characterizes the Random Forest technique. Employing a substantial number of trees bolsters the model’s resilience and its predictive precision.
3. Regression task: Considering the predictive nature of the task, the Random Forest model was tailored for regression, targeting the prediction of continuous values, specifically the levels of longitudinal cracking.
4. Out-of-bag (OOB) estimation: The Random Forest model’s prediction accuracy was tested using the Out-of-Bag approach, which employed a dataset subset that was not used during the training of each tree to estimate the model’s performance.
The core element of this process involves determining feature importance scores. These scores signify the individual contributions of each input factor toward the model’s capability to predict levels of longitudinal cracking (Elbaz, et al., 2020; Naeem, et al., 2023). The algorithm computes feature importance through the following steps:
1. Out-of-Bag data: While training the model, each decision tree is trained on a bootstrap sample of the data, leaving aside a subset known as the Out-of-Bag data.
2. Prediction with OOB data: The OOB data are utilized for predictions by each individual decision tree, and the variation between these predictions and the genuine target values (longitudinal cracking levels) is measured to estimate the prediction error.
3. Importance calculation: The Random Forest algorithm calculates the decrease in prediction error upon including each input feature in the model. Features that notably reduce the error are regarded as more significant.
Machine learning models
In the machine learning model development phase tailored for predicting longitudinal cracking in CRCP, our objective is to employ diverse algorithms to ensure a comprehensive approach. Six distinct models, each with unique strengths, will be implemented and evaluated rigorously. The selected models for this study encompass linear regression, regression decision tree, SVM, ensemble tree (Bagged and Boosted), GPR, ANN, and kernel methods. Table 1 summarizes the advantages and disadvantages of each model and how they are utilized in the study.
To initiate the process, the dataset, consisting of pertinent features and the target variable (longitudinal cracking in CRCP), undergoes meticulous preparation for model training. Subsequently, we embark on the development of a linear regression model, serving as a baseline for predictive performance. The dataset is split into training and testing sets, and a 10-fold cross-validation method is employed to ensure robust evaluation.
Moving forward, a regression decision tree is implemented to capture nonlinear relationships within the data. The decision tree is trained using the training set, and its performance is assessed through the 10-fold cross-validation framework.
The SVM’s predictive capability is then harnessed, focusing on handling complex relationships within the dataset. Normalization of input features precedes the training of the SVM model, and its effectiveness is rigorously evaluated using the 10-fold cross-validation approach.
Ensemble tree models, namely, Bagged and Boosted, are introduced to exploit the benefits of ensemble methods for enhanced predictive accuracy. The Random Forest (Bagged) and Gradient Boosting (Boosted) models undergo training and evaluation within the 10-fold cross-validation setup.
GPR is then employed to explore the flexibility of this probabilistic approach in capturing complex patterns within the data. Input feature normalization precedes the training of the GPR model, and its performance is rigorously evaluated through the 10-fold cross-validation methodology.
ANN and kernel methods are subsequently introduced, leveraging the capabilities of deep learning and kernelized algorithms. The input features are normalized, and an ANN model is designed and trained for regression. An SVM with a kernel, such as the radial basis function (RBF) kernel, is implemented. Both models are subjected to thorough evaluation using the 10-fold cross-validation technique.
Table 2 presents the specific configurations of the machine learning models utilized in our study, outlining the hyperparameters adjusted to optimize each model’s performance. The hyperparameters for each model were selected based on a combination of empirical evidence, literature review, and preliminary testing to ensure optimal model performance. These settings reflect our commitment to leveraging the strengths of each model to accurately predict fatigue cracking, taking into account the complexities of the dataset.
The final stage involves a comprehensive model comparison, considering relevant metrics such as mean squared error, R-squared, and others. The diverse characteristics of each model, including interpretability, computational efficiency, and predictive accuracy, are taken into account to inform the selection of the most effective approach.
Through this meticulous and systematic methodology, we thoroughly explore various machine learning approaches, providing valuable insights into their effectiveness for predicting longitudinal cracking in CRCP. The use of 10-fold cross-validation enhances the reliability and robustness of our model evaluations.
Data description, preprocessing, preliminary analysis, and visualization
The data employed for the study originated from the LTPP database, established in 1987 with the primary goal of exploring effective pavement construction methods under diverse conditions (Martin and Choummanivong, 2016). This comprehensive database incorporates information from over 600 pavement sections, including archival data from more than 1,900 pavement sections, and is managed by the Federal Highway Administration. Researchers and professionals in pavement engineering can access this valuable repository at https://infopave.fhwa.dot.gov/ to support their analyses and studies.
This research study selected 33 CRCP sections from the LTPP database based on specific filtering criteria. First, we selected sections that had not received any maintenance or rehabilitation to ensure that the data reflected the true performance of the original pavement. Second, we focused exclusively on CRCP sections. These filters resulted in the selection of 33 sections.
These 33 sections encompass a variety of conditions relevant to CRCP performance, including different climatic regions (both cold and warm) and varying environmental conditions (with and without freezing). The data selection process yielded a total of 395 individual records that met these stringent criteria. The extracted data types encompass structure, climate, traffic, and performance-related information. Table 3 outlines the chosen attributes within each category, specifying the variables used in the analysis. By selecting sections with these considerations, we ensured a robust and comprehensive analysis, enhancing the external validity of our study and making our findings applicable to a broad range of real-world conditions.
Their geographic locations were plotted on a map to visually depict the selected LTPP pavement sections and categorized according to their respective states (Figure 2). This mapping provides a spatial representation of the distribution of the 33 sections and facilitates a geographical understanding of the locations under consideration for the study.
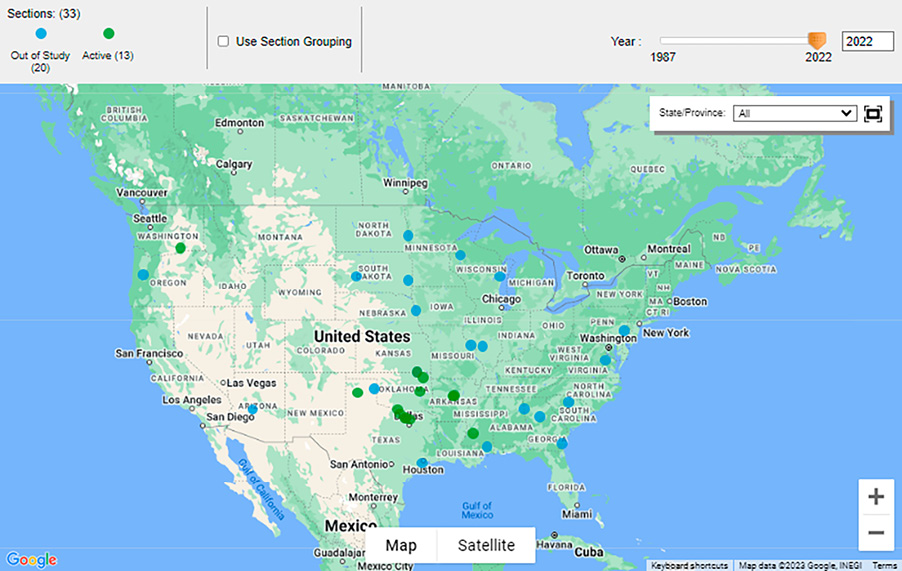
Figure 2. Mapping the geographic locations of the chosen asphalt pavement sections
Results and discussion
Statistical analysis
The analysis of longitudinal cracking in CRCP based on descriptive statistics in Table 4 reveals insightful findings. The pavement sections, sourced from the LTPP database, exhibit an average age of 18.51 years, indicating a predominance of relatively younger sections. The distribution of the number of lanes is slightly positively skewed, suggesting a tendency toward a higher number of lanes. Layer thicknesses vary, with L2, L3, and L4 displaying notable averages of 169.78, 155.95, and 142.61 mm, respectively, contributing to an overall total thickness of 468.34 mm. Precipitation averages 1,044.50 mm, showing a slightly left-skewed distribution, while temperature averages at 15.52°C with a negatively skewed distribution. The Freeze Index exhibits high variability and a right-skewed distribution, indicating potential challenges in freezing conditions. Humidity ranges widely, with minimum and maximum values showing positive skewness, suggesting a prevalence of higher humidity levels. Traffic parameters, including annual average daily traffic (AADT), average annual daily truck traffic (AADTT), and kilo-equivalent single axle loads (KESAL), display positive skewness, indicating concentrations of higher traffic conditions. The initial International Roughness Index (IRI) averages 1.33, suggesting acceptable initial pavement roughness. However, the variable for longitudinal cracking presents substantial variability, with an average of 6.69 and a right-skewed distribution, indicating the presence of extensive cracking in some sections, supported by a maximum value of 188.40. These descriptive statistics provide a foundational understanding for subsequent analyses and model development, highlighting areas of interest such as the impact of age, layer thickness, environmental factors, traffic conditions, and initial pavement conditions on longitudinal cracking in CRCP. Attention to the right-skewed distribution and outliers in longitudinal cracking is crucial for accurate predictions and effective pavement management strategies.
The conventional regression analysis was conducted to investigate the relationship between various factors and the occurrence of longitudinal cracking in CRCP. The regression equation obtained is as follows:
Regression equation
Longitudinal cracking = 94.0 + 0.299 Age + 1.69 Number of lanes + 0.0506 L2 thickness - 0.2000 L3 thickness - 0.0875 L4 thickness - 0.01486 Precipitation - 0.793 Temperature - 0.01662 Freeze index + 0.300 Min. humidity - 0.267 Max. humidity - 0.000628 AADT + 0.00730 AADTT - 0.00082 KESAL - 6.85 Initial IRI
Upon reviewing the model summary metrics, it becomes apparent that the conventional regression analysis, as indicated by the modest R-squared values (23.55% for R-sq and 20.74% for R-sq(adj)), may not comprehensively capture the nuanced relationship underlying longitudinal cracking. The predictive R-squared (14.56%) suggests a moderate ability to forecast future observations. These accuracy metrics underscore the limitations of the linear regression model in explaining the majority of variability in longitudinal cracking. This accentuates the need for more advanced modeling techniques, such as machine learning models, to better capture complex patterns and nonlinear associations within the data, aiming for improved accuracy and a more comprehensive understanding of the factors influencing longitudinal cracking in CRCP.
The results of the regression analysis are presented in Table 5, which details the coefficients, standard errors, t-values, p-values, and variance inflation factors (VIF) for each term in the model. The constant term, with a coefficient of 94.0000 and a significant p-value of 0.0040, indicates the baseline level of longitudinal cracking when all other variables are held at zero.
Among the significant predictors, age has a positive coefficient of 0.2990, suggesting that older pavement sections tend to exhibit higher levels of longitudinal cracking. This is supported by a t-value of 2.4100 and a p-value of 0.0160, indicating statistical significance. Similarly, the number of lanes, with a coefficient of 1.6900, shows a positive relationship with cracking, although this factor is not statistically significant (p-value of 0.5470).
The thickness of the second layer (L2 thickness) has a positive coefficient of 0.0506 and is statistically significant (p-value of 0.0240), indicating that thicker layers are associated with increased longitudinal cracking. Conversely, the third (L3) and fourth (L4) layers exhibit negative coefficients (-0.2000 and -0.0875, respectively), with both factors being statistically significant (p-values of 0.0000 and 0.0020, respectively). This suggests that increased thickness in these layers may reduce cracking.
Precipitation, with a coefficient of -0.0149 and a significant p-value of 0.0000, indicates that higher levels of precipitation are associated with reduced longitudinal cracking. Similarly, the Freeze Index has a negative coefficient (-0.0166) and is statistically significant (p-value of 0.0380), suggesting that regions with more freeze-thaw cycles experience less cracking potentially due to enhanced design considerations in these areas.
The analysis also highlights that traffic-related factors such as AADT and AADTT are significant predictors. AADT has a negative coefficient (-0.0006) with a p-value of 0.0050, while AADTT shows a positive coefficient (0.0073) with a p-value of 0.0040, indicating their respective impacts on longitudinal cracking. The initial IRI is another significant predictor, with a negative coefficient (-6.8500) and a p-value of 0.0440, suggesting that pavements with higher initial roughness are more prone to cracking.
Other factors, such as temperature, minimum and maximum humidity, and KESAL, do not show statistically significant contributions to the model, as indicated by their higher p-values. The VIF values for all predictors are within acceptable ranges, indicating that multicollinearity is not a significant concern in this regression model.
The analysis of variance results in Table 6 offer a detailed evaluation of the statistical importance of each predictor in the regression model for longitudinal cracking. ANOVA is utilized to determine the significance of the regression model as a whole and to identify which specific variables make a meaningful contribution to the prediction of longitudinal cracking.
The collective model shows a notable F-value of 8.36 and a corresponding p-value of 0.000, indicating that the regression model significantly explains the variability in longitudinal cracking. This suggests that at least one predictor variable has a significant impact on longitudinal cracking.
Breaking down the contributions of individual predictors, we find that several variables significantly contribute to the model:
• Age (F = 5.82, p = 0.016): Older pavement sections tend to have higher levels of longitudinal cracking.
• L2 thickness (F = 5.17, p = 0.024): The thickness of the second layer is positively associated with cracking.
• L3 thickness (F = 25.37, p = 0.000) and L4 Thickness (F = 10.03, p = 0.002): Thicker third and fourth layers are associated with reduced cracking.
• Precipitation (F = 12.95, p = 0.000): Higher precipitation levels are linked to lower cracking levels possibly due to moisture’s impact on pavement conditions.
• Freeze index (F = 4.32, p = 0.038): Areas with more freeze-thaw cycles show more longitudinal cracking.
• AADT (F = 7.99, p = 0.005) and AADTT (F = 8.57, p = 0.004): Higher traffic volumes and truck traffic are significant predictors of cracking.
• Initial IRI (F = 4.09, p = 0.044): Pavements with higher initial roughness index values exhibit more cracking.
However, some predictors, such as number of lanes, temperature, min. humidity, max. humidity, and KESAL, do not show statistically significant contributions based on their p-values.
Additionally, the lack-of-fit test within the error term has a p-value of 0.000, indicating that the model does not fully capture all relevant features. This suggests the potential need for model refinement, either through more advanced modeling techniques or the inclusion of additional variables, to enhance the overall model fit and predictive accuracy.
The residual plots for longitudinal cracking are presented in Figure 3, providing valuable insights into the performance and assumptions of the regression model. Each plot serves a specific diagnostic purpose to evaluate the model’s validity.

Figure 3. The residual plots for longitudinal cracking.
The Normal Probability Plot illustrates whether the residuals conform to a normal distribution, a key assumption of the regression model. A linear pattern in this plot indicates that the residuals are normally distributed, supporting the validity of the model assumptions. Deviations from the line suggest potential issues with normality, which could affect the reliability of the model’s predictions.
The Versus Fits Plot helps detect patterns or trends in the residuals relative to the predicted values. It offers insights into potential heteroscedasticity (nonconstant variance) or nonlinearity in the model. Ideally, the residuals should be randomly scattered around zero without any discernible pattern. Any systematic pattern may indicate issues with the model fit, such as missing variables or incorrect functional form, necessitating further model refinement.
The histogram provides a graphical representation of the distribution of residuals, aiding in the assessment of their symmetry and the presence of outliers. A symmetric bell-shaped histogram centered on zero suggests that the residuals are normally distributed. Skewness or the presence of extreme values indicates deviations from normality, which could signal that the model does not fully capture the underlying data structure.
The Versus Order Plot helps identify any systematic patterns or trends in the residuals concerning the order of observation. It is instrumental in detecting autocorrelation, which occurs when residuals are correlated across observations. In a well-fitting model, residuals should be randomly distributed with no apparent pattern over time or order. The presence of patterns in this plot may suggest the need for time series modeling techniques or the inclusion of lagged variables. Collectively, these residual plots contribute to the evaluation of the regression model’s assumptions and performance. They guide potential adjustments or enhancements for a more robust analysis of longitudinal cracking in CRCP.
Correlation matrix and feature importance assessment
The results of the heatmap correlation matrix in Figure 4 reveal the interrelationships among various variables in the dataset, providing valuable insights into potential patterns and associations. Notable correlations include a positive association between total thickness and L2 thickness (0.85) and a strong negative correlation between L3 thickness and L4 thickness (-0.89), indicating a potential trade-off between these variables. Additionally, significant correlations with longitudinal cracking are observed, such as positive associations with AADT (0.31), AADTT (0.31), KESAL (0.23), and initial IRI (0.19), suggesting a potential influence of these factors on the occurrence of longitudinal cracking. The correlation matrix also highlights relationships between environmental conditions and pavement performance, with notable correlations between precipitation and total thickness (0.26) and freeze index and temperature (-0.75), indicating potential impacts on pavement structural characteristics. These findings underscore the importance of considering multiple factors and their interplay when analyzing longitudinal cracking in CRCP.

Figure 4. Heatmap correlation matrix result.
To overcome the challenge of capturing the relationship of the correlation matrix, we used sophisticated approaches such as Random Forest to understand the complicated and nonlinear interactions between the various design components, as well as “longitudinal Cracking (m).” As an ensemble machine learning methodology, this method is adept at finding subtle relationships and interactions that an ordinary correlation analysis may miss.
The feature importance analysis in Figure 5 provides a nuanced understanding of the variables contributing to the prediction of longitudinal cracking in CRCP. Using the Random Forest algorithm, we evaluated the significance of various features in our dataset. Temperature emerged as the most influential factor with an importance score of 0.94, underscoring its pivotal role in influencing the occurrence of longitudinal cracking. This finding suggests that temperature variations significantly affect the expansion and contraction of concrete, leading to cracking.

Figure 5. Feature importance Assessment using Random Forest Algorithm
AADTT follows closely with a score of 0.91, highlighting the substantial impact of heavy vehicular loads on pavement performance. The high importance of AADTT indicates that sections of pavement experiencing higher truck traffic are more prone to longitudinal cracking likely due to the increased stress and wear from heavy loads.
Freeze index, with a score of 0.85, emphasizes the role of climatic conditions, particularly freezing and thawing cycles, in the development of longitudinal cracks. This variable’s importance suggests that pavements in regions with significant freeze-thaw cycles require more robust materials and design considerations to mitigate cracking.
KESAL, a distress indicator associated with the asphalt layer, holds a notable importance score of 0.83, suggesting that the condition of the asphalt layer significantly contributes to longitudinal cracking. This indicates that the quality and maintenance of the asphalt layer are crucial in preventing cracks.
L2 thickness, representing the thickness of the second layer, also demonstrates substantial importance with a score of 0.81. This highlights the influence of structural aspects on pavement performance, suggesting that thicker layers can provide better resistance to cracking.
Precipitation and age exhibit scores of 0.77 and 0.75, respectively, indicating the relevance of environmental conditions and pavement age in longitudinal cracking prediction. High precipitation can lead to moisture infiltration and weakening of the pavement structure, while older pavements are naturally more susceptible to cracking over time.
Total thickness, reflecting the overall pavement structure, holds moderate importance at 0.67. Initial international roughness index and annual average daily traffic show scores of 0.63 and 0.62, respectively, pointing to their contributory roles in influencing pavement performance.
Further down the importance hierarchy, variables such as min. humidity, L4 thickness, and max. humidity exhibit scores of 0.48, 0.45, and 0.32, respectively, suggesting their relatively lesser impact on longitudinal cracking. Additionally, features such as climate zone, L2 type, coefficient of retention (CN), L3 type, number of lanes, and L4 type contribute to varying extents, as indicated by their importance scores.
This detailed analysis underscores the complexity of factors influencing longitudinal cracking, emphasizing the need for a comprehensive consideration of multiple variables in predictive modeling for effective pavement management and maintenance strategies. Understanding the critical roles of temperature, AADTT, and other significant factors can help in optimizing maintenance schedules, improving pavement design, and ultimately enhancing the durability and longevity of CRCP infrastructure.
Development of machine learning models
The machine learning models and traditional regression models were evaluated using various specifications, and their performance metrics were assessed for predicting longitudinal cracking in CRCP as shown in Table 7 and Figure 6. The linear regression models, both in the linear and robust forms, exhibited RMSE values of 21.81 and 22.08, R-squared values of 0.24 and 0.22, MSE values of 475.83 and 487.66, and mean absolute error (MAE) values of 11.34 and 7.05, respectively. The training time for linear regression was recorded at 15.82 s.

Figure 6. Machine learning results.
Regression tree models, categorized as fine, medium, and coarse, demonstrated varying levels of performance. The fine regression tree yielded the lowest RMSE of 18.56, the highest R-squared of 0.45, and the lowest MSE of 344.57. The training times for fine, medium, and coarse were 15.73, 4.24, and 5.68 s, respectively.
SVM models with different kernel types showed diverse results. The linear SVM model exhibited an RMSE of 25.64, an R-squared of -0.05, an MSE of 657.36, and an MAE of 6.73, with a training time of 6.71 s. The Quadratic and Cubic SVMs, along with Fine, Medium, and Coarse Gaussian SVMs, displayed variations in performance metrics, indicating the influence of kernel choice on model performance.
Ensemble tree models, including Boosted trees and Bagged trees, demonstrated competitive results. Boosted trees showed the lowest RMSE of 18.48, the highest R-squared of 0.45, and the lowest MSE of 341.51, with a training time of 15.78 s. Bagged trees had an RMSE of 20.39, an R-squared of 0.33, an MSE of 415.91, and an MAE of 7.86, with a training time of 21.43 s.
GPR models with different kernels displayed varying performance, with Squared Exponential GPR showcasing the lowest RMSE of 11.84, the highest R-squared of 0.78, and the lowest MSE of 140.19. ANN models, including narrow, medium, and wide ANN, along with bilayered and trilayered ANN, exhibited distinctive performances, with wide ANN achieving notable accuracy.
Kernel models, such as SVM kernel and least squares regression kernel, demonstrated diverse performance metrics, with SVM kernel showing an RMSE of 25.52, an R-squared of -0.04, an MSE of 651.22, and an MAE of 6.74. Least squares regression kernel exhibited an RMSE of 20.53, an R-squared of 0.33, an MSE of 421.50, and an MAE of 8.27. The training times for kernel models varied based on the specific kernel type.
The training times for the machine learning models vary significantly, offering insights into their computational efficiency. Among the models requiring a short training time (less than 10 s), the regression tree with a fine specification stands out with a training time of 15.73 s, followed closely by the Medium and Coarse Gaussian models at 5.74 and 5.34 s, respectively. Additionally, the quadratic and cubic SVM models demonstrate low training times of 6.14 and 6.97 s, respectively, along with the Exponential GPR model at 15.75 s and the squared exponential GPR model at 19.34 s.
Moving to models with a moderate training time (between 10 and 30 s), the wide ANN with 100 neurons exhibits the longest training time at 38.83 s, followed by the bilayered and trilayered ANN models at 33.57 and 37.66 s, respectively. The least squares regression kernel model also falls within this category, requiring 36.89 s for training. Conversely, models such as Bagged trees, linear regression, and robust linear regression display relatively shorter training times, ranging from 11.12 to 21.43 s.
Finally, models with a long training time (more than 30 s) include the narrow ANN with 10 neurons and the medium ANN with 25 neurons, both requiring approximately 25 s for training. Notably, the linear SVM, fine Gaussian, and boosted trees models exhibit training times below 10 s despite their high predictive performance. Conversely, the kernel SVM model necessitates a longer training time of 34.39 s, highlighting the trade-off between computational efficiency and model complexity. Overall, understanding the training times of different machine learning models is crucial for selecting an appropriate model that balances predictive accuracy with computational resources.
Sensitivity analysis
The sensitivity analysis was conducted using the best-performing machine learning model identified in our study. This analysis aimed to evaluate how changes in individual input variables influence the predicted longitudinal cracking in CRCP. To isolate the effect of each variable, we varied the variable of interest across its range while holding all other variables constant at their mean values. This approach provides a clear understanding of the relative impact of each variable on longitudinal cracking.
The results of the sensitivity analysis are presented in Figure 7. Our analysis (Figure 7a) reveals a strong positive correlation between pavement age and longitudinal cracking, indicating that older pavements tend to develop more cracks. This result aligns with the anticipated increase in cracking due to wear and deterioration over time. This finding emphasizes the importance of timely maintenance interventions to prolong pavement life.
Figure 7. Sensitivity analysis results.
Total pavement thickness is inversely related to longitudinal cracking (Figure 7b). Thicker pavements tend to experience less cracking likely due to their enhanced structural capacity. This highlights the importance of considering pavement thickness in the design phase to minimize future cracking.
Temperature exhibits a nonlinear relationship with longitudinal cracking (Figure 7c). Both very low and high temperatures are correlated with increased cracking likely caused by thermal expansion and contraction stresses on the pavement. This suggests that climate and temperature variations should be factored into pavement design and material selection.
The Freeze Index, representing the number of freeze-thaw cycles, is positively correlated with longitudinal cracking (Figure 7d). Higher freeze-thaw cycles lead to more cracking, underscoring the need for materials and designs that can withstand such environmental stresses, particularly in regions with harsh winter conditions.
Traffic-related variables, such as AADTT and KESAL, also play a crucial role in the development of longitudinal cracking. Both variables show a strong positive correlation with cracking (Figures 7e and 7f), indicating that heavy traffic loads significantly contribute to pavement deterioration. This finding supports the need for robust pavement designs that can endure high traffic volumes.
Precipitation is another environmental factor that influences longitudinal cracking (Figure 7g). Increased levels of precipitation are associated with more cracking, suggesting that moisture infiltration may weaken the pavement structure over time. This emphasizes the importance of effective drainage systems and moisture-resistant materials in pavement design.
Finally, the initial IRI shows a positive correlation with longitudinal cracking (Figure 7h). Pavements with a rougher surface condition at the outset are more prone to cracking over time, highlighting the need for ensuring smooth surface conditions during the initial construction phase to reduce future maintenance needs.
Practical implications
Our study highlights several critical factors influencing longitudinal cracking in CRCP, such as temperature, AADTT, and freeze index. Based on these findings, we propose several strategies and recommendations for pavement engineers and policymakers to enhance the durability and performance of CRCP.
First, maintenance schedules should be adjusted to account for regions with significant temperature variations and high AADTT. These areas should have more frequent inspections and maintenance activities to address early signs of cracking. By doing so, potential issues can be identified and remedied before they develop into more severe problems, thereby extending the lifespan of the pavement.
Second, incorporating design improvements that enhance resilience to temperature fluctuations and heavy truck traffic is essential. This includes using high-performance concrete and reinforcing materials specifically designed to withstand environmental and load stresses. Such materials can significantly reduce the incidence of longitudinal cracking, leading to more durable pavement structures.
In terms of material choices, it is crucial to consider local environmental conditions. For example, in areas with high Freeze Index values, using materials and construction techniques that minimize the impact of freeze-thaw cycles is recommended. Improved drainage systems and frost-resistant layers can help mitigate the detrimental effects of freezing and thawing on the pavement.
Policymakers should consider revising existing guidelines to incorporate the specific requirements identified in this study. Setting standards for minimum material performance in regions prone to severe temperature changes or heavy traffic can ensure that pavements are constructed with long-term durability in mind. These policy changes can lead to more sustainable infrastructure development.
Lastly, pavement engineers should adopt best practices that account for the identified critical variables. Conducting thorough site assessments to understand local environmental and traffic conditions is vital. Based on these assessments, engineers can design pavements that are tailored to withstand the specific challenges of each location, thereby improving overall pavement performance and reducing maintenance costs.
By implementing these strategies, pavement engineers and policymakers can significantly enhance the durability and performance of CRCP, leading to longer-lasting infrastructure and reduced maintenance expenses. These practical implications underscore the importance of integrating our research findings into real-world applications to improve pavement management practices.
Conclusion
In conclusion, this study systematically investigated the prediction of longitudinal cracking in CRCP through a multifaceted approach encompassing descriptive statistics, conventional regression modeling, and diverse machine learning algorithms. Initial exploration of the LTPP database yielded 33 control asphalt pavement sections, forming the basis for rigorous analysis. Conventional regression analysis identified significant predictor variables, resulting in a regression equation with coefficients detailing the impact of factors such as age, thickness, and climatic conditions on longitudinal cracking. However, acknowledging the potential limitations of conventional regression models, the study expanded its scope to include machine learning techniques.
In our exploration of machine learning algorithms, diverse performances were observed across different models. Particularly noteworthy was the GPR utilizing a squared exponential kernel, which demonstrated exceptional accuracy, evident from its low root mean squared error of 11.84 and high R-squared value of 0.78. Additionally, ensemble tree models, notably Boosted trees, exhibited competitive outcomes with an RMSE of 18.48 and an R-squared value of 0.45. These quantitative metrics underscore the superior predictive prowess of select machine learning models when juxtaposed with conventional regression techniques. This comparison elucidates the specific limitations that machine learning approaches effectively address, outperforming conventional regression methodologies in terms of predictive accuracy and robustness.
Feature importance analysis emphasized key variables influencing longitudinal cracking predictions. Noteworthy contributors included temperature, average annual daily truck traffic, and freeze index, among others. The correlation matrix provided further insights into relationships among input features, enriching the dataset’s interpretability.
The sensitivity analysis confirms that pavement age, traffic loads, and environmental factors such as temperature and precipitation significantly influence the development of longitudinal cracking in CRCP. These insights are crucial for developing more targeted and effective pavement maintenance and design strategies.
In essence, this study presents compelling quantitative evidence affirming the effectiveness of machine learning models in forecasting longitudinal cracking in CRCP. While the accuracy metrics and model performances underscore the potential advantages of advanced modeling techniques over traditional regression approaches, it is imperative to delve deeper into understanding the inner workings of these models. By shedding light on how machine learning algorithms derive their predictions, and elucidating how these insights can inform decision-making processes, this research aims to bridge the gap between predictive accuracy and interpretability. These findings hold significant practical implications for pavement engineering, providing a data-driven framework for optimizing maintenance strategies and enhancing the longevity of CRCP infrastructure. As the field continues to evolve with a focus on numerical precision, elucidating the mechanisms behind machine learning predictions adds a layer of transparency and depth to pave the way for informed decision-making in pavement management practices.
Limitations and future work
Limitations
1. Limited scope of machine learning techniques: While the study employs several advanced machine learning techniques, it does not cover all possible algorithms or hybrid approaches that might offer improved performance or interpretability.
2. Resource-intensive analysis: The computational resources required to train and validate advanced machine learning models are significant. This limitation can be a barrier for smaller agencies or practitioners with limited access to such resources.
3. Generalization across pavement types: The study focuses on CRCP, and the findings may not be directly applicable to other types of pavements such as flexible or composite pavements. Different pavement types may require distinct modeling approaches.
Future research
• Incorporation of additional variables: Future studies should consider integrating new variables that could influence longitudinal cracking. These might include soil properties, pavement base and subbase characteristics, and more detailed traffic load distributions. By expanding the range of input variables, the predictive models can be refined to capture a broader spectrum of influences on pavement performance.
• Advanced machine learning techniques: While this study utilized several machine learning models, future research could explore more advanced techniques such as deep learning architectures, hybrid models, and meta-learning approaches. These advanced models have the potential to uncover even more complex patterns and interactions within the data, leading to improved predictive accuracy.
• Integration with pavement management systems: Future research could focus on integrating predictive models with existing pavement management systems (PMS). This integration would facilitate real-time decision-making and optimize maintenance scheduling based on predictive insights, ultimately leading to more efficient use of resources.
• Validation with field data: Validating the predictive models with real-world field data from various ongoing and future pavement projects would ensure the reliability and practical applicability of the models. Field validation can help refine the models further and build confidence in their use for practical applications.
References
Abadin, MJ, Kadir, A, Roy, SK, Wei, ZZ & Rahman, MW 2023, ‘First experiences with continuously reinforced concrete pavement in the national highway of Bangladesh’, International Journal of Pavement Research and Technology, pp. 1-28. https://doi.org/10.1007/s42947-023-00332-9
Adlinge, SS & Gupta, AK 2013, ‘Pavement deterioration and its causes’, International Journal of Innovative Research and Development, vol. 2, no. 4, pp. 437-450.
Bansal, L 2019, Design and economy aspects of continuously reinforced concrete pavements, PhD thesis, National Institute of Technology, Kurukshetra.
Benmokrane, B, Sanni Bakouregui, A, Mohamed, HM, Thébeau, D & Abdelkarim, OI 2020, ‘Design, construction, and performance of continuously reinforced concrete pavement reinforced with GFRP bars: case study’, Journal of Composites for Construction, vol. 24, no. 5, 05020004. https://doi.org/10.1061/(ASCE)CC.1943-5614.0001021
Chakroborty, P & Das, A 2017, Principles of transportation engineering, PHI Learning Pvt. Ltd.
Chang, JR, Huang, CT & Tseng, PJ 2016, ‘Preliminary study on the long-term pavement performance (LTPP) program under the big data concept’, 16th International Conference on Computing in Civil and Building Engineering (ICCCBE2016), Osaka, Japan, pp. 1867-1872.
Corley-Lay, J & Mastin, JN 2009, ‘Evaluation of long-term pavement performance profile data for flexible pavements’, Transportation Research Record, vol. 2093, no. 1, pp. 25-30. https://doi.org/10.3141/2093-03
Elkins, GE & Ostrom, B 2021, Long-term pavement performance information management system user guide, Federal Highway Administration, Office of Infrastructure Research and Development, FHWA-HRT-21-038.
Guan, S, Liu, H, Pourreza, HR & Mahyar, H 2023, ‘Deep learning approaches in pavement distress identification: a review’, arXiv preprint, arXiv:2308.00828.
Huang, Y 2023, ‘Machine learning applied to prediction of pavement performance under cold conditions’, International Journal of Pavement Engineering, in press.
Khahro, SH, Javed, Y & Memon, ZA 2021, ‘Low cost road health monitoring system: a case of flexible pavements’, Sustainability, vol. 13, no. 18, 10272. https://doi.org/10.3390/su131810272
Kim, K, Han, S, Tia, M & Greene, J 2019, ‘Optimization of parameters affecting horizontal cracking in continuously reinforced concrete pavement (CRCP)’, Canadian Journal of Civil Engineering, vol. 46, no. 7, pp. 634-642. https://doi.org/10.1139/cjce-2017-0679
Kohler, E & Roesler, J 2006, Accelerated pavement testing of extended life continuously reinforced concrete pavement sections, FHWA-IL-UI-289.
Lali, FA 2023, Comparison between pavement mechanistic-empirical design approaches for rubblized pavements in Michigan, PhD thesis, Michigan State University.
Liu, Y, Yang, F, Zhou, W, Chen, Z & Bobaru, F 2023, ‘Peridynamic modeling of early-age cracking behavior in continuously reinforced concrete pavement’, International Journal of Pavement Engineering, vol. 24, no. 2, 2111422. https://doi.org/10.1080/10298436.2022.2111422
Love, PE & Ika, LA 2021, ‘The context of transport project cost performance: insights from contract award to final construction costs’, Research in Transportation Economics, vol. 90, 101062. https://doi.org/10.1016/j.retrec.2021.101062
Martin, T & Choummanivong, L 2016, ‘The benefits of long-term pavement performance (LTPP) research to funders’, Transportation Research Procedia, vol. 14, pp. 2477-2486. https://doi.org/10.1016/j.trpro.2016.05.282
Mokhtari, S 2015, Analytical study of computer vision-based pavement crack quantification using machine learning techniques, PhD thesis, RMIT University.
Naeem, M, Alotaibi, E, Elbaz, Y, Abuzwidah, M, & Barakat, S 2023, Assessment of Drowsy Driving Associated Characteristics Using Deep Learning. In International Symposium on Engineering and Business Administration. International Symposium on Engineering and Business Administration. Trans Tech Publications Ltd. https://doi.org/10.4028/p-VRaT6i
Nash, W, Drummond, T & Birbilis, N 2018, ‘A review of deep learning in the study of materials degradation’, npj Materials Degradation, vol. 2, no. 1, 37. https://doi.org/10.1038/s41529-018-0058-x
Peraka, NSP & Biligiri, KP 2020, ‘Pavement asset management systems and technologies: a review’, Automation in Construction, vol. 119, 103336. https://doi.org/10.1016/j.autcon.2020.103336
Roesler, JR, Huntley, JG & Amirkhanian, AN 2011, ‘Performance of continuously reinforced concrete pavement containing recycled concrete aggregates’, Transportation Research Record, vol. 2253, no. 1, pp. 32-39. https://doi.org/10.3141/2253-04
Selezneva, OI, Hallenbeck, M & Walker, D 2022, ‘Traffic data and summary statistics available through the long-term pavement performance program for pavement modeling and beyond’, Transportation Research Record, vol. 2676, no. 10, pp. 426-444. https://doi.org/10.1177/03611981221089943
Shtayat, AAAS 2022, Dynamic monitoring and prediction of pavement degradation, PhD thesis, RMIT University. https://doi.org/10.1155/2022/7783588
Sudoi, EK 2008, Factors influencing horizontal cracking in continuously reinforced concrete pavements (CRCP), University of North Texas.
Uddin, MJ 2015, Pavement performance measures using android-based smartphone application, Deccan College of Engineering and Technology.
Won, MC 2011, ‘Continuously reinforced concrete pavement: identification of distress mechanisms and improvement of mechanistic–empirical design procedures’, Transportation Research Record, vol. 2226, no. 1, pp. 51-59. https://doi.org/10.3141/2226-06
Xiao, D X Wu, Z 2018, Longitudinal Cracking of Jointed Plain Concrete Pavements in Louisiana: Field Investigation and Numerical Simulation. International Journal of Pavement Research and Technology. https://doi.org/10.1016/j.ijprt.2018.07.004
Xie, J, Huang, J, Zeng, C, Jiang, SH & Podlich, N 2020, ‘Systematic literature review on data-driven models for predictive maintenance of railway track: implications in geotechnical engineering’, Geosciences, vol. 10, no. 11, 425. https://doi.org/10.3390/geosciences10110425
Y. Elbaz, M. Naeem, M. Abuzwidah and S. Barakat, “Effect of Drowsiness on Driver Performance and Traffic Safety,” 2020 Advances in Science and Engineering Technology International Conferences (ASET), Dubai, United Arab Emirates, 2020, pp. 1-6. https://doi.org/10.1109/ASET48392.2020.9118242