Construction Economics and Building
Vol. 25, No. 1
March 2025
RESEARCH ARTICLE
A Claim-Based Risk Mapping of Contractor’s All-Risk Insurance in Indonesia
Andreas Arianto Pramudya1, Andreas Wibowo2,*, Wimpy Santosa3,
1 Parahyangan Catholic University, Bandung, Indonesia, aapramudya@gmail.com
2 Parahyangan Catholic University, Bandung, Indonesia, andreas_wibowo@unpar.ac.id
3 Parahyangan Catholic University, Bandung, Indonesia, wimpy@unpar.ac.id
4 Parahyangan Catholic University, Bandung, Indonesia, ferryjp@unpar.ac.id
Corresponding author: Andreas Wibowo, Parahyangan Catholic University, Bandung, Indonesia, andreas_wibowo@unpar.ac.id
DOI: https://doi.org/10.5130/AJCEB.v25i1.9035
Article History: Received 08/02/2024; Revised 26/11/2024; Accepted 25/12/2024; Published 31/03/2025
Citation: Pramudya, A. A., Wibowo, A., Santosa, W., Permana, F. J. 2025. A Claim-Based Risk Mapping of Contractor’s All-Risk Insurance in Indonesia. Construction Economics and Building, 25:1, 122–142. https://doi.org/10.5130/AJCEB.v25i1.9035
Abstract
Contractor’s all-risk (CAR) insurance is widely used in construction. Although it constitutes a small fraction of the global insurance sector, it records higher claims than other types of insurance. Therefore, identifying the root cause or origin of potential losses is pivotal. This study aims to map CAR insurance risks based on historical data from the policies and claims of two major Indonesian insurance firms. This study employed descriptive statistics to summarize the frequency and characteristics of claim values for each risk and the Mann–Whitney and Kruskal–Wallis tests to determine significant differences in claim values among several attributes. The Shapiro–Wilk test was used to assess data normality. Of the 76 identified risks based on previous studies, 15 led to CAR claims, with six risks accounting for 77% of the overall claim values. Most risks causing substantial claims are attributed to natural and man-made disasters. While the geographical area (Java and outside Java island) emerged as a determining factor in claim values, no significant differences in normalized claim values were found for different stages of work progress (<25%, 25% to 50%, >50% to 75%, >75%) or types of construction projects (infrastructure, building, and industrial). This study acknowledges the limitations arising from the incompleteness of the data. Despite these limitations, this study can pave the way for further research, such as examining the influence of project characteristics on the likelihood of claims and quantifying these characteristics to help calculate the premium value of CAR insurance.
Keywords
Claim; Contractor’s All-Risk Insurance; Frequency; Severity; Indonesia
Introduction
Construction projects are inherently exposed to risks that can prevent them from attaining their objectives, negatively impacting all involved parties, the projects themselves, and the construction industry (El-Adaway and Kandil, 2010). Generally, construction risks are borne by the contractor unless specified as the project owner’s risks. The greater the complexity and difficulty encountered in construction projects, such as challenging site conditions, adverse weather conditions, utility conflicts, and complex structural designs, the higher the associated project risks the contractor must manage. Therefore, proactive risk management at each stage of construction is imperative to mitigate the escalation of negative impacts and maintain control over the project.
Risk management is a systematic approach to anticipating potential losses, incorporating measures such as early warnings, safety protocols, and risk control procedures (Vaughan and Vaughan, 1994; Bunni, 2003). It encompasses planning, leadership, coordination, and control to mitigate the impact of potential losses on resources, income, and cash flow (Werner, 1999). Risk management uses various strategies, including risk avoidance, mitigation, retention, and transfer through insurance or contractual means (Ahmed and Azhar, 2004; Akinradewo, et al., 2022). Risk transfer, a common strategy, involves shifting the risk burden to a third party, typically an insurance company, to mitigate the financial impact of potential losses, with the insured party receiving compensation (Levine and Haar, 2008; Cho, 2013).
Various types of insurance are prevalent within the construction sector, including engineering, professional indemnity, and workers’ compensation insurance. Engineering insurance typically comprises three primary parts: construction, inherent defect, and operational insurance. Engineering insurance constitutes 3% and 4% of the global insurance market [Asosiasi Asuransi Umum Indonesia (AAUI), 2022].
Construction insurance comprises approximately 40% to 45% of the total engineering insurance sector, representing approximately 1.5% of the global insurance market (Dieter, 2021). Despite its relatively small share, construction insurance accounts for a higher percentage of claims value than other insurance types. Claims within construction insurance typically occur in 60% to 70% of policies, while property insurance claims generally fall between 28% and 32% (Dieter, 2021; AAUI, 2022). The higher percentage of claims in construction insurance often leads to insurance companies paying out more in claims than they receive in premiums.
The situation described above was further aggravated by shifts in the global insurance market mainly due to the impact of the COVID-19 pandemic. This led to a notable increase in construction claims. Consequently, many projects underwent review, postponement, or cancellation due to concerns regarding their commercial feasibility and a significant rise in insurance costs. This escalation was driven by the withdrawal of several insurance companies from the construction insurance market (AON, 2021; Marsh, 2021; Willis Tower Watson, 2021). Substantial losses were often incurred because the construction and insurance industries relied solely on intuition and experience to analyze risks and determine premium values (Lyons and Skitmore, 2004; Öztaş and Ökmen, 2004; Shapiro, 2007; Laryea, 2008).
In risk management, identifying the root cause or origin of potential losses, whether from natural or artificial events, commonly referred to as perils in the insurance industry, is pivotal. Construction all-risk insurance is a widely used type of construction insurance available on the market. In principle, construction all-risks cover all risks of loss or damage to the construction field, materials, temporary work, and anything else brought to the site by the contractor, hence its designation as “all-risk” insurance (Perera, Rathnayake and Rameezdeen, 2008; Musundire and Aigbavboa, 2015; Martina and Kumar, 2018). Furthermore, construction all-risk insurance can be divided into several types of insurance, including “contractor’s all-risk” (CAR), “erection all-risk,” “plant all-risk,” “industry all-risk,” and, in a broader scope, “combined all-risk” or “owner-controlled insurance program.” This study is limited solely to contractor’s all-risk.
Numerous studies have dealt with CAR as a risk mitigation tool, each focusing on different aspects (Harkness and Hassanain, 2002; Liu, et al., 2007; Liu, Lin and Feng, 2018; Ibrahim, Mat Nor and Raja Hisham, 2021; Ekpo and Oladokun, 2023; Zhou, et al., 2023). Several articles have explored risk identification for construction projects (Suraji, Duff and Peckitt, 2001; Hardjomuljadi, 2014; Jayasudha and Vidivelli, 2016; Hatmoko, Astuti and Farania, 2021); however, they do not specifically address the risks covered by CAR insurance. Only a handful of prior studies have examined construction insurance, although none has analyzed the frequency and severity of CAR claims stemming from various risks.
CAR insurance covers all risks during the construction period from the start to the handover of construction work (Kim, Kim and Ahn, 2020). However, CAR insurance has a dynamic nature that aligns with changes in project progress and the potential for increased exposure value during the construction period. Therefore, it is essential to understand the risk events that occur frequently and have the most significant impact on project progress. Furthermore, while CAR insurance can cover any damage or loss that occurs across various types of projects (Perera, Rathnayake and Rameezdeen, 2008; Musundire and Aigbavboa, 2015; Martina and Kumar, 2018), it is essential to understand the characteristics of the frequency and value of construction risk claims that most frequently arise in the different types of projects.
This study aims to map the risks that CAR can cover based on historical data from insurance firms in Indonesia to determine and analyze construction risks with a high frequency of occurrence that can lead to significant losses. Risk occurrence determines the frequency, while losses indicate the severity, expressed as each risk’s claim value. This study represents one of the first attempts to map risks using historical claim data for CAR insurance.
Indonesia was chosen as a case study for several reasons. First, its construction sector consistently contributes approximately 10% to the country’s gross domestic product (GDP), positioning it among the top five GDP contributors (Badan Pusat Statistik Indonesia, 2023). The Indonesian construction market is also one of the largest in Asia. However, Indonesia’s geographical position within the “Ring of Fire” makes it highly vulnerable to natural disasters such as earthquakes, floods, landslides, tsunamis, volcanic eruptions, coastal abrasion, and forest fires. For instance, over the past decade (2014–2023), Indonesia has experienced 8,307 flood incidents, 7,376 flood and landslide occurrences, 8,548 tornadoes, 352 earthquakes, and 136 volcanic eruptions (The National Agency for Disaster Management, 2023). In Indonesia, the effectiveness of CAR insurance in transferring potential risks is 72.54% (Perera, Rathnayake and Rameezdeen, 2008; Musundire and Aigbavboa, 2015).
This study significantly contributes to the construction sector and insurance companies by helping to mitigate, prevent, and reduce the impact of construction risks and their associated claim values. By identifying these risks, construction and insurance firms can more accurately assess the likelihood of these risks occurring and estimate potential damages. This analysis is essential for determining appropriate insurance premiums and coverage limits.
Additionally, recognizing specific risks allows construction firms to collaborate effectively with insurance companies to tailor their coverage, ensuring they are protected against the most relevant risks, as insurance policies usually define the risks they cover. As a result, construction firms can select policies that align with their unique needs and risk profiles. At the same time, insurance companies can better manage their losses and maintain their viability in the construction insurance market. This paper is organized as follows. The next section provides a background on construction insurance and risk identification based on previous studies. The subsequent section explains the quantitative methods used in this study, followed by an analysis and discussion of the results. Finally, conclusions are drawn based on the findings.
Literature review
Construction risks are usually divided into two main categories: financial and operational risks. Financial risks include payment delay, exchange rate, interest rate, credit risk, funding, and cash flow constraints, which can influence the construction process. The operational risks include site conditions and environmental risks, health and safety risks, labor risks, resource and equipment availability risks, and supply chain disruption risks.
Previous literature has examined risk grouping, the general types of construction risk, and specific risks in infrastructure and building projects (Ryu, Son and Kim, 2016; Kim, et al., 2019). A hierarchical risk structure has also been compiled by Tah and Carr (2001). For instance, Owusu-Manu, et al. (2020) explored construction risk by gathering opinions from the construction and insurance industries regarding insurable and non-insurable risks.
Disasters caused by human actions can lead to substantial losses, although the losses are typically lower than those from natural disasters (Perera, Rathnayake and Rameezdeen, 2008). Workers play an essential role in construction. Factors such as labor shortages; an unskilled, untrained, or undisciplined workforce; and workers with low productivity are often obstacles that pose high risks for contractors. Disputes and labor strikes also present risks, frequently resulting in project delays (Hardjomuljadi, 2014; Jayasudha and Vidivelli, 2016; Khan and Gul, 2017; Husin, et al., 2019; Hatmoko, Astuti and Farania, 2021).
Risks arising from material and construction equipment create delays and cost overruns (Suraji, Duff and Peckitt, 2001; Hardjomuljadi, 2014; Jayasudha and Vidivelli, 2016; Ryu, Son and Kim, 2016; Mirkovic, 2018; Owusu-Manu, et al., 2020; Hatmoko, Astuti and Farania, 2021). Environmental and occupational health and safety (OHS) risks emerge from internal and external project activities (Howard, 2005; Gangolells, et al., 2009; Ewelina and Mikaela, 2011; Hardjomuljadi, 2014; Jayasudha and Vidivelli, 2016). Inadequate OHS supervision can lead to health problems, accidents, and third-party property damage (Camino López, et al., 2008; Perera, Rathnayake and Rameezdeen, 2008; Jayasudha and Vidivelli, 2016; Khan and Gul, 2017; Li, et al., 2017; Owusu-Manu, et al., 2020, 2021).
Design-related risks can be divided into technical risks (Shen, Wu and Ng, 2001; Jayasudha and Vidivelli, 2016; Khan and Gul, 2017) and nontechnical risks (Flyvbjerg, Holm and Buhl, 2006; Jayasudha and Vidivelli, 2016). Both types of risks can lead to project failure. If these risks are not adequately managed, the process and competition between bidders can threaten all of the parties involved in the construction project (Jayasudha and Vidivelli, 2016). After the tender winner is selected, the contract stage continues, which carries significant risks in construction (Hardjomuljadi, 2014; Zhao, Hwang and Phng, 2014; Jayasudha and Vidivelli, 2016).
According to the literature mentioned above, only a few studies (Bunni, 2003; Jayasudha and Vidivelli, 2016; Hatmoko and Farania, 2021) have analyzed the risk factors covered by insurance; however, these studies did not specifically focus on CAR insurance. Recently, studies regarding the frequency of claims, the value of risk events that cause claims, and the type and location of projects that influence the occurrence of claims are severely limited. Analyzing these causal factors is crucial for estimating adverse risks and providing valuable insights for all stakeholders.
Research methodology
Building upon prior studies (Suraji, Duff and Peckitt, 2001; Hardjomuljadi, 2014; Jayasudha and Vidivelli, 2016; Owusu-Manu, et al., 2020), this study identified 76 construction risks, as detailed in Table 1. It adopted a quantitative approach, employing statistical descriptive analyses of historical CAR policy and claim data. In this paper, quotation marks denote terms referring to the identified risks.
Source: Suraji, Duff and Peckitt (2001), Hardjomuljadi (2014), Jayasudha and Vidivelli (2016), Owusu-Manu, et al. (2020).
Data collection
The first stage involved collecting, reviewing, and filtering data. Data on all CAR claims were collected from two large insurance firms in Indonesia, covering 2012 to 2022. This dataset comprises 3,509 entries on CAR policies and 1,437 CAR claim payments. The data underwent rigorous review and filtering based on specific criteria to ensure data quality. These criteria included ensuring that the minimum project value exceeded IDR 50 billion (with USD 1 approximately equivalent to IDR 15,000), verifying data reasonability, eliminating duplications, and confirming that the policy coverage period concluded before 2022. A project value cutoff of IDR 50 billion was chosen, as claims below this threshold had a relatively low frequency (8.5%) compared to those above. In contrast, claims for projects above this value accounted for 63.6% of the total claims. After applying these filters, the final dataset comprised 1,808 policies and 1,150 claims subjected to further analysis. Table 2 provides a summary of the claim data.
Risk grouping and data analysis
In the second stage, risks were mapped by the following attributes: the progress of work, project types, project locations, and causal factors. Risks were categorized according to the four stages of work progress: <25%, 25% to 50%, >50% to 75%, and >75%. This classification was determined by considering potential risk variations and their impact on loss across different stages of construction. Risks were classified into three project types: infrastructure, general building, and industrial, as other project types entail varying levels of difficulty and complexity. Location characteristics significantly influence risks, leading to the grouping of risks based on project locations: Java and areas outside the Java Island. Risks were also categorized into two groups based on their causes: “natural disasters” and “man-made disasters,” which include “human-related losses,” “material and equipment-related losses,” and “supervision and safety-related losses.”
The identified risks were categorized into four groups: risks with low frequency and slight loss value (the first quadrant), risks with low frequency and high claim rates (the second quadrant), risks with high frequency and high claim rates (the third quadrant), and risks with high frequency and low claim rates (the fourth quadrant). The size of each bubble represents the aggregate claim value for the respective risk, with larger bubbles indicating a more substantial aggregate claim value. Pareto’s Law was applied to identify risks significantly impacting the total claim values.
Data were analyzed using descriptive and inferential statistics. Descriptive statistics summarized the frequency and characteristics of claim values for each risk, presenting central tendency measures such as mean and median, dispersion measures like standard deviation, range (minimum and maximum values), and skewness and kurtosis—measures indicating the data symmetry and tail distribution relative to a standard curve.
A hypothesis was tested for inferential analysis to determine whether significant differences in risk claim values among different attributes exist. The claim values were normalized by project value to neutralize the effect of project size. The Shapiro-Wilk normality test (Kvam and Vidakovic, 2007) was used to assess the data distribution, facilitating the selection of parametric and nonparametric inferential analysis based on normality. This study adopted a conventional 5% significance level for hypothesis testing. All computations were conducted using IBM SPSS Statistics Version 26 (IBM Corp., 2019).
Interpretation and discussion
The results of the data analysis were interpreted in the third stage, leading to a comprehensive discussion of the findings and their practical implications. Based on the findings, conclusions and suggestions for further research were drawn. Figure 1 illustrates the methodological framework of this study.
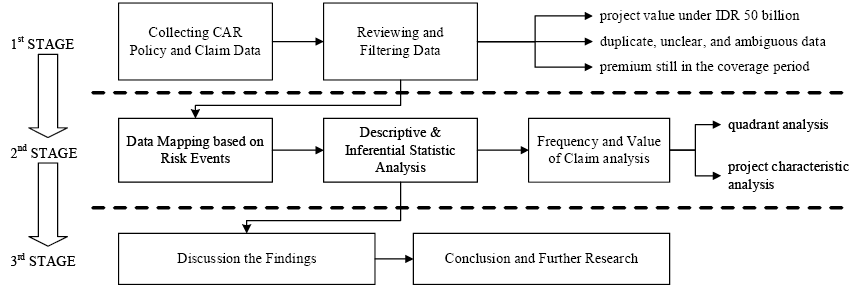
Figure 1. Research methodological framework.
Results and discussion
Frequency and severity analysis
Of the 76 identified construction risks, 15 (19.7%) resulted in CAR claims. However, the frequency of claims with “no identified cause” was relatively high at 7.4% primarily due to poor database recording systems. Many claims had no record of the cause and did not have a complete chronology of events, making it impossible to determine the cause of the claim.
Table 3 presents the descriptive statistics for each risk that resulted in the claim. Six of the 76 identified risks accounted for 77% of the total claim values. Among these, three risks were situated in the third quadrant, two in the second quadrant, and one in the fourth quadrant. These six risks encompass “hurricanes and storms,” “poor quality of work,” “heavy rain, lightning, and flooding,” “landslides,” “fire, explosion, short circuit, and power failure,” and “material or equipment damage due to accidents or disasters.”
“Hurricanes and storms” caused the most significant economic losses, with enormous consequences for individuals and the government. The necessity for repairs due to this disaster usually incurs considerable expense (Stewart, 2003; Kunreuther and Pauly, 2006; Tatum and Terrell, 2012). This risk exhibits the highest single claim value among all the risks, amounting to IDR 138 billion (USD 9.2 million), and the second-largest aggregate claim value, totaling IDR 255 billion (USD 17 million). While hurricanes and storms are infrequent, their occurrence carries a substantial impact. The highest claim values recorded were associated with an infrastructure project undertaken by public companies in a rural area outside the island of Java.
“Heavy rain, lightning, and flooding” represent the highest aggregate claim value risks, totaling IDR 471 billion (USD 31 million), and the second-highest frequency, with 143 recorded events. This finding aligns with research from Yum, et al. (2020) , which used rainfall and flooding to assess the risks associated with natural catastrophes. Heavy rain and flooding result in work delays and the inundation of project sites. Furthermore, these phenomena give rise to additional hazards, such as landslides, equipment damage, and other risks, including delays and cost overruns. Despite the widespread occurrence and potential for substantial losses caused by rainfall and flooding, stakeholders often ignore risk mitigation strategies.
“Landslides” can be triggered by various factors, including human activities such as land use, excavation, and stockpiling. Additionally, geological conditions, earthquakes, and climate change can lead to heavy rainfall and floods (Bommer, et al., 2002; Wiguna and Scott, 2005; Hardjomuljadi, 2014; Froude and Petley, 2018). Recent climate change has contributed to an increase in the frequency of landslides, a trend substantiated by historical data, which show that landslides rank third in terms of both frequency and claim value per event. However, fatal landslides also result from human activities related to construction, mining, and hill cutting. These incidents occur due to a lack of robust feasibility assessments.
“Fire, explosion, short circuit, and power failure” are the main hazards in building construction and can potentially result in significant losses. These risks usually emerge after the completion of the substructure work and persist until the project’s handover. Incidents may be caused by sparks igniting flammable materials, equipment malfunctions, and substances stored at the project site. Additionally, this risk can lead to other events, such as building collapse and fatalities. Ranked fourth in the aggregate claim value, it closely rivals “hurricanes and storms.” The highest claim value for “fire and explosion” incidents is IDR 41 billion (USD 2.7 million), surpassing the most significant claim from “landslides” (IDR 17.5 billion or USD 1.2 million).
“Poor quality of work” results in damage and accidents during construction, encompassing issues such as concrete cracks, building collapses, damage from improper installation, and accidental harm. Notably, a single claim amounting to IDR 100 billion ranked as the second-highest single claim, while the mean value of “poor quality of work” claims stood as the third-highest at IDR 3.5 billion. While CAR insurance does not directly cover this risk, insurance policies may be tailored to address poor-quality artistry. Finally, “material or equipment damage due to accidents or disasters” exhibits the highest frequency of occurrence at 222 events.
Based on the claim data, “material or equipment damage due to accidents or disasters” refers to the harm inflicted on equipment because of collisions with materials and instances where equipment fails because of excessive loads. This category also includes damage to underground materials and mechanical and electrical systems. Losses stemming from “property damage caused by third parties” are influenced by structural integrity, foundation stability, flooding incidents, and insurance coverage. These risks can lead to many issues, including compensation for incurred expenses, the suspension of construction activities, and potential administrative penalties. Ultimately, these consequences contribute to diminished productivity, financial losses, and damage to the company’s reputation (Jayasudha and Vidivelli, 2016; Ahn, Kim and Kim, 2020).
The highest claim within the “material or equipment damage due to accidents or disasters” amounted to IDR 22.9 billion, recorded on a large construction project in an urban area on the island of Java. In second place, a rural infrastructure project on the island of Java experienced a loss of IDR 14.7 billion. However, the available data lacked detailed information concerning the type of construction firm involved and the specific cause of the claims.
Nonparametric test results
The Shapiro–Wilk test results indicate that project sizes, claim values, and normalized claim values deviate from a normal distribution at the 5% significance level (p < 0.0005). In Table 3, the skewness of claim values for each risk exceeds 2.0 (positively skewed), while the kurtosis value surpasses 5.0 (leptokurtic). High skewness and kurtosis values suggest the presence of outliers, highlighting the significance of extreme risks for insurance companies to consider. Based on these statistics, each risk was plotted into the four quadrants based on frequency and claim values, as illustrated in Figure 2. The mapping used the median values for frequency and claim as crosshairs because the data were not normally distributed.
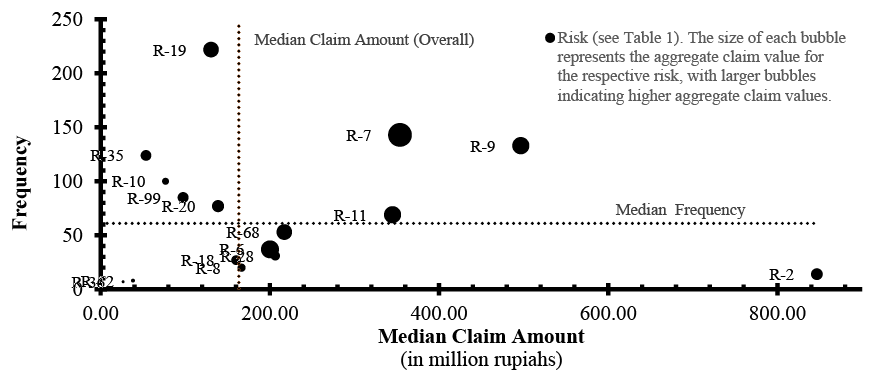
Figure 2. Quadrant analysis of risk frequency and median claim value.
The Kruskal–Wallis tests reveal statistically significant differences in the claim values and normalized claim values for these six risks at the 5% significance level, with p < 0.0005 for each. Therefore, a post hoc analysis employing the Mann–Whitney test was conducted to ascertain specific differences among the risks. Concerning normalized claim values, the test results demonstrated significant differences solely between “material or equipment damage due to accidents or disasters” and “landslides” (p = 0.048), between “material or equipment damage due to accidents or disasters” and “heavy rain, lightning, and flooding” (p < 0.0005), and between “material or equipment damage due to accidents or disasters” and “fire, explosion, short circuit, and power failure” (p < 0.0005). These significance values were adjusted by the Bonferroni correction for multiple tests. Conversely, in terms of claim values, notable differences were observed between “material or equipment damage due to accidents or disasters” (median = IDR 130 million) and “landslides” (median = IDR 496 million, p < 0.0005) and between “material or equipment damage due to accidents or disasters” and “heavy rain, lightning, and flooding” (median = IDR 354 million, p < 0.0005).
The Kruskal–Wallis test also suggests differences in claim values (p = 0.026) and normalized claim values (p = 0.047) across various stages of work progress. A post hoc analysis employing the Mann-Whitney test, with significance values adjusted using the Bonferroni correction for multiple tests, was conducted to pinpoint specific variations. Concerning claim values, a significant difference was observed between project stages below 25% and above 75% (p = 0.019). The median claim values for the former (IDR 958 million) were markedly higher than those for the latter (IDR 182 million). However, this difference appears to be influenced by the project’s scale. Regarding normalized claim value—claim values divided by their corresponding project sizes—the Mann–Whitney test revealed no differences across work progress stages, with all p-values exceeding 0.05. Figures 3 and 4 show the frequency of occurrence and risk claim values based on the work progress.
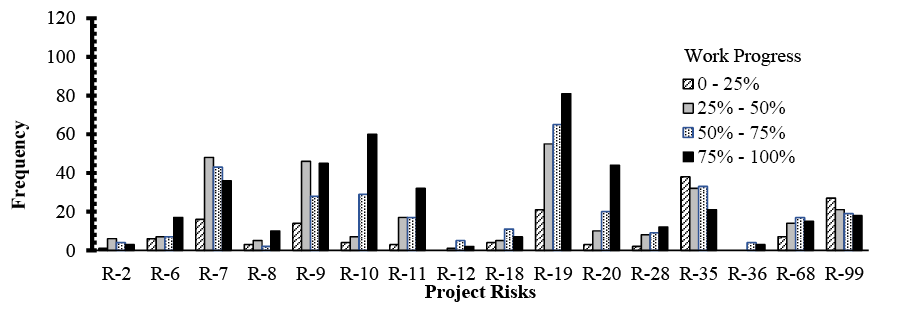
Figure 3. Claim frequency based on work progress.
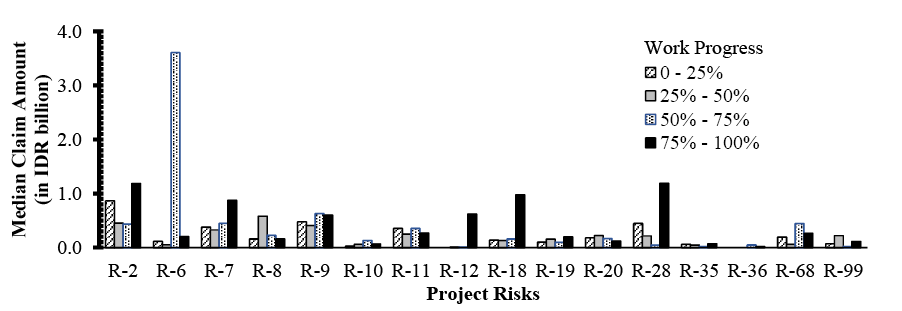
Figure 4. Claim value per event based on work progress.
Furthermore, the Kruskal–Wallis test results indicate a significant difference in claim values (p = 0.003) and normalized claim values among various project types. Specifically, this difference is evident in infrastructure and building projects (p = 0.003), while no notable difference exists between industrial and building projects (p = 1.000) or between industrial and infrastructure projects (p = 0.249). The variance in project sizes can elucidate this difference: infrastructure projects (median = IDR 1.05 trillion) exhibit higher values compared to building projects (median = IDR 491 billion) and industrial projects (median = IDR 355 billion). When these claim values are adjusted against project sizes, the Kruskal-Wallis test reveals no significant difference among the three project types (p = 0.660). Figures 5 and 6 illustrate the frequency of occurrence and risk claim values across these three construction project types.
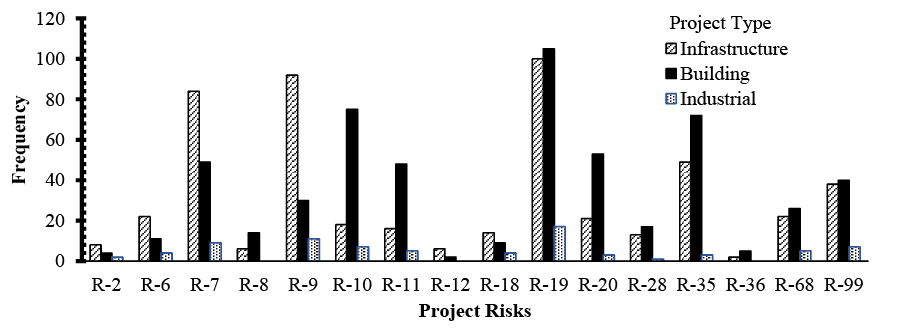
Figure 5. Claim frequency based on project type.
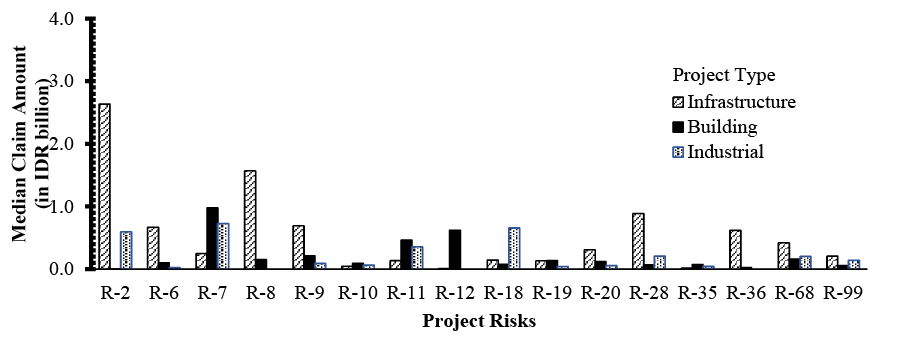
Figure 6. Claim value per event based on project type.
The Mann–Whitney test demonstrates a significant contrast in claim values and normalized claim values between projects in Java and those outside Java, with a p-value < 0.0005. Like developed regions, Java, Indonesia’s most populous island, boasts of a proficient human resource pool and efficient material distribution channels. However, it also contends with challenges such as dense populations, complexities, and uncertainties. In contrast, projects located in rural areas face distinct challenges characterized by remoteness, isolation, and smaller populations. These challenges include difficulties in mobilizing and procuring labor and materials, lower levels of expertise, production risks, cost management and economies of scale, and infrastructure and communication challenges (McAnulty and Baroudi, 2010; Usman and Ibrahim, 2015).
Figures 7 and 8 present the frequency of occurrence and claim values in these two locations, respectively. These findings will be further examined in conjunction with causal risk factors. Based on the characterization of these risks, the Kruskal–Wallis tests reveal significant differences in claim values and normalized claim values across various factors, with a p-value < 0.0005. Subsequent post hoc analysis delineates differences among “natural disasters” and “human-related losses,” “material and equipment-related losses,” and “supervision and safety-related losses,” all with p-values < 0.0005. Similar conclusions emerge for normalized claim values, highlighting differences between “supervision and safety-related losses” and “human-related losses” (p = 0.045). This finding prompted further investigation by categorizing risks into “natural disasters” and “man-made disasters,” uncovering significant differences between the two categories for both claim values (p < 0.0005) and normalized claim values (p < 0.0005). The median claim values attributed to “natural disasters” amounted to IDR 424 million, which is significantly higher than those arising from “man-made disasters” (IDR 124 million).
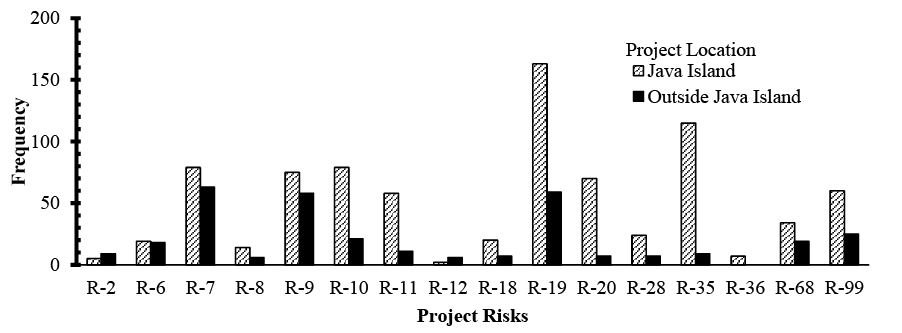
Figure 7. Claim frequency based on project location.
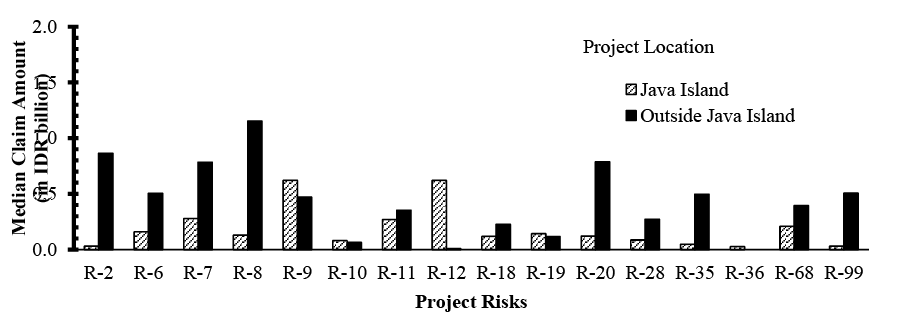
Figure 8. Claim value per event based on project location.
Natural disasters
Natural disasters encompass five distinct perilous events: “geological conditions,” “hurricanes and storms,” “heavy rain, lightning, and flooding,” “earthquakes, volcanic eruptions, and tsunamis,” and “landslides.” Substantial claim amounts characterize these five risks. Figure 2 reveals that “heavy rain, lightning, and flooding” and “landslides” exhibit a high frequency of events, occurring consistently across various stages of work progress, from 25% to 100%. This indicates that they can manifest at any point during construction, with a higher propensity within infrastructure projects. “Geological conditions,” “hurricanes and storms,” and “earthquakes, volcanic eruptions, and tsunamis” are infrequent but can lead to significant losses, particularly for infrastructure projects. While natural catastrophes cannot be entirely avoided, measures can be implemented to mitigate their impact and limit the associated losses. In contrast, losses arising from human actions differ significantly, as they can be prevented, thereby averting harm and disruptions to the construction process.
For insurance firms, a profound understanding of the natural disaster risks inherent in insured construction projects holds fundamental significance for various reasons. It allows them to accurately assess and quantify potential liabilities, essential for determining appropriate premium coverage limits and devising effective risk management strategies. An in-depth knowledge of these risks also facilitates improved underwriting decisions. By precisely pricing policies based on region-specific vulnerabilities to natural disasters, contractors and insurers can appropriately tailor insurance products to address the needs of high-risk areas. A comprehensive understanding of natural disaster risks is crucial for making informed decisions regarding reinsurance coverage to manage risk exposure. This understanding significantly enhances insurance firms’ ability to manage claims effectively, enabling well-informed responses in the aftermath of a disaster.
Understanding the nature of natural disaster risks remains crucial for construction firms, even with insurance coverage, as natural disasters can cause significant business disruptions. Construction firms should proactively manage and prevent potential damages, reducing the likelihood and severity of disasters and minimizing losses. Although insurance covers losses, preventive measures can reduce the frequency and severity of claims, and construction firms can invest in risk-reduction strategies, potentially lowering insurance premiums and overall costs. In this sense, collaborating between insurance and construction firms to implement proactive risk mitigation measures is feasible, reducing claim frequency and severity and benefiting insurers and insured parties.
Man-made disasters
Among “human-related losses,” three stand out: “robbery and theft on-site,” “fire and explosion,” and “riots, strikes, demonstrations, and civil unrest.” Notably, losses attributed to “fire and explosion” are minimal, and the frequency of their occurrence is relatively low. According to Domke (1999), “robbery and theft on-site” and “fire and explosion” mainly occur during the later stages of construction, typically between 50% and 100% completion. It is worth noting that valuable and flammable materials often become targets for theft and fire incidents, particularly toward the conclusion of construction projects, especially in the case of building projects in Java. In contrast, outside Java, incidents in infrastructure and industrial projects are relatively low primarily due to the materials being less susceptible to theft or combustion.
“Material and equipment-related losses” include “damage to materials/equipment during shipping or the installation process,” “damage to materials/equipment due to accidents or disasters,” “damage to materials/equipment caused by water, leaks, or seepage,” and “failure in machine testing or installation.” These four risks are deemed moderate, with claim values per event closely matching the median value. The frequency of “damage to materials/equipment due to accidents or disasters” notably increases and correlates with construction progress. This risk frequently emerges in building and infrastructure projects, particularly in Java. Interestingly, the claim values for projects outside Java are considerably higher than those within Java. Damage to materials and equipment can result from accidents or disasters. Implementing preventive measures against disaster-induced damage can be more challenging, but a robust OHS system can significantly mitigate such occurrences.
The “supervision and safety-related losses” include “worker accidents involving experts in the project and the project owner,” “property damage by third parties,” “damage resulting from vibration, settlement, collapse, loss, or weakening of supports,” and “poor quality of work.” Only “property damage by third parties” exhibits a high frequency and is evenly distributed throughout the project timeline, whereas the other three risks have low claim values per event. Despite the small claim values, the high frequency of these risks can lead to a significant total claim value.
“Poor quality of work” exhibits a high frequency and claim magnitude. Its claim frequency is evenly distributed from the beginning to the end of a project (Figure 2), and such events frequently arise in infrastructure and building projects (Figure 4). Notably, in infrastructure projects, significant losses tend to occur toward the end of the project, typically when progress exceeds 50%. “Poor quality of work” is more prevalent in Java, yet the claimed magnitude is higher outside Java. This finding suggests that despite occurring less frequently due to fewer projects, the inadequate quality of labor outside Java leads to more substantial claims.
The population density on Java contributes to a higher frequency of “property damage by third parties” than outside Java, even though the claim amounts on Java are lower than those outside Java. These events occurred uniformly across all project progress stages but are more frequent in building projects, highlighting that such damage often occurs in densely populated project areas. Hence, implementing a robust OHS system can effectively mitigate the risks of property damage incidents near the project site (Lingard, 2013).
Conclusion
Analyzing the frequency and value of claims is fundamental for comprehensively understanding the diverse range of construction risk events that may lead to claims and for determining the risks inherent in each project based on its specific characteristics. While numerous prior studies have dealt with construction insurance, detailed discussions backed by empirical data regarding the severity and frequency of claim values remain notably scarce. This study aims to bridge this knowledge gap and contribute a deeper understanding of this area. It represents one of the pioneering attempts in this field, drawing from large sample sizes obtained from two insurance firms in Indonesia.
This study reveals that a small subset of construction risks covered by CAR insurance significantly influences claim frequencies and values. These findings underscore the crucial need to focus on specific risks, especially those with low frequency but high potential for causing substantial losses if they occur. While some of these risks are unavoidable or uncontrollable, their impact can be minimized, whereas others can be prevented through effective planning and control measures. This study also shows that the geographical area significantly influences the value of claims. However, no significant difference is observed across various stages of work progress or construction project types when claim values are normalized to their corresponding project values.
The substantial claims stemming from natural disasters underscore the pivotal role of insurance in mitigating the risks. This highlights Indonesia’s vulnerability to such events, emphasizing the critical need for early mitigation measures, mainly when using insurance. While natural disasters are typically uncontrollable, their impact can be lessened through detailed engineering designs and proactive risk management practices, further bolstered by comprehensive insurance solutions. Project stakeholders must acknowledge that these risks have the potential to arise at any stage of the project. Construction projects can become more resilient and ensure financial protection against unforeseen and uncontrollable natural disasters by integrating insurance mechanisms into risk management strategies.
It is worth noting that CAR insurance provides valuable financial protection for construction projects. However, it should not incentivize contractors to take more significant risks or be less cautious because of the safety net of insurance coverage. Several factors mitigate the potential for moral hazard in this context. First, contractual obligations impose stringent requirements and standards on contractors and subcontractors, fostering a culture of accountability and incentivizing adherence to safety protocols and quality standards. These obligations remain regardless of insurance coverage, reinforcing the commitment to responsible behavior. Second, contractors are vested in completing projects on time, within budget, and to the required quality standards to maintain profitability and safeguard their professional reputation. The financial and reputational stakes motivate contractors to prioritize risk management and ensure project success, regardless of insurance coverage. Furthermore, while insurance protects against unforeseen risks, it does not absolve contractors of their financial responsibilities or mitigate the potential losses associated with project delays, defects, or failures.
Insurance firms can leverage the findings of this study as a valuable reference to gain deeper insights into the risks inherent in construction projects, particularly those covered by CAR insurance. The prominence of specific project risks in terms of their frequency and severity of claims underscores the importance for insurance firms to prioritize their understanding of these risks. Furthermore, these insights encourage insurance firms to engage with contractors in proactive risk mitigation measures. Insurance firms should adopt a more data-driven approach instead of relying solely on intuition. Factors such as the contractor’s experience, project complexity, location, and historical performance should be carefully considered to tailor appropriate coverage and premiums.
This study acknowledges inherent limitations. First, the available project attribute data remain significantly restricted, thus constraining a more comprehensive analysis of the correlation between claim frequency and severity and the limited project attribute data. Second, the absence of standardized data recording protocols poses a considerable challenge in identifying hazardous causes. Consequently, the frequency of claims labeled “no identified cause” is relatively high, primarily attributed to deficient database systems. Many claims lacked causative information and comprehensive event chronologies, impeding the determination of their underlying causes.
Regardless of the study’s limitations, the findings provide a foundation for further research to address knowledge gaps in construction insurance. These results can pave the way for further studies, such as examining the influence of project characteristics on the likelihood of claims and quantifying these characteristics to help calculate the premium value of CAR insurance.
References
Ahmed, S.M. and Azhar, S., 2004. Risk management in the Florida construction industry. In: Second LACCEI International Latin American and Caribbean Conference for Engineering and Technology (LACCEI’2004) ‘Challenges and Opportunity for Engineering Education, Research, and Development’. Florida.
Ahn, S., Kim, T. and Kim, J.M., 2020. Sustainable risk assessment through the analysis of financial losses from third-party damage in bridge construction. Sustainability (Switzerland), 12(8). https://doi.org/10.3390/su12083435
Akinradewo, O., Aghimien, D., Aigbavboa, C. and Onyia, M., 2022. Factors influencing the adoption of insurance as a risk treatment tool by contractors in the construction industry. International Journal of Construction Management, 22(13), pp.2484–2492. https://doi.org/10.1080/15623599.2020.1797986
AON, 2021. Construction market overview 2nd quarter 2021. [online] London. Available at: https://insights-north-america.aon.com/construction/aon-construction-market-overview-q2-2021-report.
Asosiasi Asuransi Umum Indonesia, 2022. Kinerja asuransi umum dan reasuransi selama tahun – 2021. Jakarta.
Badan Pusat Statistik Indonesia, 2023. Construction indicators for the first quarter of 2023. Jakarta.
Bommer, J., Spence, R., Erdik, M., Tabuchi, S., Aydinoglu, N., Booth, E., Del Re, D. and Peterken, O., 2002. Development of an earthquake loss model for Turkish catastrophe insurance. Journal of Seismology, 6(3), pp.431–446. https://doi.org/10.1023/A:1020095711419
Bunni, N.G., 2003. Risk and insurance in construction. Second ed. Spon Press. London and New York: Taylor & Francis Group. https://doi.org/10.1080/01446193.2013.783703
Camino López, M.A., Ritzel, D.O., Fontaneda, I. and González Alcantara, O.J., 2008. Construction industry accidents in Spain. Journal of Safety Research, 39(5), pp.497–507. https://doi.org/10.1016/j.jsr.2008.07.006
Cho, Y.-J., 2013. A basic study on the introduction of professional indemnity insurance for construction project managers. Journal of the Korea Institute of Building Construction, 13(2), pp.102–111. https://doi.org/10.5345/JKIBC.2013.13.2.102
Dieter, S., 2021. Engineering insurance premium and loss statistics per country 2018-2020. In: IMIA Virtual Conference. The International Association of Engineering Insurers.
Domke, A., 1999. Standstill covers under CAR and EAR insurance. Swiss Reinsurance Company. Zurich: Swiss Re Publishing.
Ekpo, I.A. and Oladokun, T.T., 2023. Adoption of professional indemnity insurance among estate surveying and valuation firms in Oyo State, Nigeria. Property Management, 41(5), pp.753–765. https://doi.org/10.1108/PM-10-2022-0079
El-Adaway, I.H. and Kandil, A.A., 2010. Construction risks: Single versus portfolio insurance. Journal of Management in Engineering, 26(1), pp.2–8. https://doi.org/10.1061/(ASCE)0742-597X(2010)26:1(2)
Ewelina, G. and Mikaela, R., 2011. Risk management practice in a construction project - a case study. Master of Science Thesis in the Master’s Programme Design and Construction Project Management. Chalmers University of Technology, Sweden. https://doi.org/10.4324/9780203887059-17
Flyvbjerg, B., Holm, M.K.S. and Buhl, S.L., 2006. Inaccuracy in traffic forecasts. Transport Reviews, 26(1), pp.1–24. https://doi.org/10.1080/01441640500124779
Froude, M.J. and Petley, D.N., 2018. Global fatal landslide occurrence from 2004 to 2016. Natural Hazards and Earth System Sciences, 18(8), pp.2161–2181. https://doi.org/10.5194/nhess-18-2161-2018
Gangolells, M., Casals, M., Gassó, S., Forcada, N., Roca, X. and Fuertes, A., 2009. A methodology for predicting the severity of environmental impacts related to the construction process of residential buildings. Building and Environment, 44(3), pp.558–571. https://doi.org/10.1016/j.buildenv.2008.05.001
Hardjomuljadi, S., 2014. Factor analysis on causal of construction claims and disputes in Indonesia (with reference to the construction of hydroelectric power project in Indonesia). International Journal of Applied Engineering Research, 9(22), pp.12421–12446.
Harkness, E.L. and Hassanain, M.A., 2002. Seismic damage in NSW, Australia: Construction insurance, social, and economic consequences. Journal of Performance of Constructed Facilities, 16(2), pp.75–84. https://doi.org/10.1061/(ASCE)0887-3828(2002)16:2(75)
Hatmoko, J.U.D., Astuti, P.K. and Farania, S.N., 2021. Insuring project risks: Contractor expectations versus insurance company policies. International Journal of Technology, 12(1), pp.90–100. https://doi.org/10.14716/ijtech.v12i1.4156
Howard, W.H., 2005. New issues in environmental risk insurance. Environmental Claims Journal, 17(2), pp.153–192. https://doi.org/10.1080/10406020500239774
Husin, S., Fachrurrazi, F., Rizalihadi, M. and Mubarak, M., 2019. Implementing fuzzy TOPSIS on project risk variable ranking. Advances in Civil Engineering, 2019. https://doi.org/10.1155/2019/9283409
IBM Corp., 2019. IBM SPSS Statistics for Windows.
Ibrahim, M.A., Mat Nor, A. and Raja Hisham, R.R.I., 2021. Factors influencing Bumiputera contractors’ acceptance of the contractor’s all risk takāful product. ISRA International Journal of Islamic Finance, 13(3), pp.364–377. https://doi.org/10.1108/IJIF-09-2020-0188
Jayasudha, K. and Vidivelli, B., 2016. Analysis of major risks in construction projects. ARPN Journal of Engineering and Applied Sciences, 11(11), pp.6943–6950.
Khan, R.A. and Gul, W., 2017. Emperical study of critical risk factors causing delays in construction projects. Proceedings of the 2017 IEEE 9th International Conference on Intelligent Data Acquisition and Advanced Computing Systems: Technology and Applications, IDAACS 2017, 2, pp.900–906. https://doi.org/10.1109/IDAACS.2017.8095217
Kim, J.M., Kim, T. and Ahn, S., 2020. Loss assessment for sustainable industrial infrastructure: Focusing on bridge construction and financial losses. Sustainability (Switzerland), 12(13). https://doi.org/10.3390/su12135316
Kim, J.M., Kim, T., Bae, J., Son, K. and Ahn, S., 2019. Analysis of plant construction accidents and loss estimation using insurance loss records. Journal of Asian Architecture and Building Engineering, 18(6), pp.507–516. https://doi.org/10.1080/13467581.2019.1687089
Kunreuther, H. and Pauly, M., 2006. Rules rather than discretion: Lessons from Hurricane Katrina. Journal of Risk and Uncertainty, 33(1–2), pp.101–116. https://doi.org/10.1007/s11166-006-0173-x
Kvam, P.H. and Vidakovic, B., 2007. Nonparametric statistics with applications to science and engineering. Wiley series in probability and statistics. Hoboken: Wiley-Interscience. https://doi.org/10.1002/9780470168707
Laryea, S., 2008. Risk pricing practices in finance, insurance, and construction. In: COBRA 2008 - Construction and Building Research Conference of the Royal Institution of Chartered Surveyors. London: University of Reading. pp.1–16.
Levine, M. and Haar, R. Ter, 2008. Construction insurance and UK construction contracts. Second ed. Oxford: Informa Law from Routledge.
Li, X., Han, S., Gül, M., Asce, A.M., Al-Hussein, M. and El-Rich, M., 2017. 3D visualization-based ergonomic risk assessment and work modification framework and its validation for a lifting task. Journal of Construction Engineering and Management, 144(1), pp.04017093-1–13. https://doi.org/10.1061/(ASCE)CO.1943-7862.0001412
Lingard, H., 2013. Occupational health and safety in the construction industry. Construction Management and Economics, 31(6), pp.505–514. https://doi.org/10.1080/01446193.2013.816435
Liu, J., Li, B., Lin, B. and Nguyen, V., 2007. Key issues and challenges of risk management and insurance in China’s construction industry: An empirical study. Industrial Management and Data Systems, 107(3), pp.382–396. https://doi.org/10.1108/02635570710734280
Liu, J., Lin, S. and Feng, Y., 2018. Understanding why Chinese contractors are not willing to purchase construction insurance. Engineering, Construction and Architectural Management, 25(2), pp.257–272. https://doi.org/10.1108/ECAM-08-2016-0186
Lyons, T. and Skitmore, M., 2004. Project risk management in the Queensland engineering construction industry: A survey. International Journal of Project Management, 22(1), pp.51–61. https://doi.org/10.1016/S0263-7863(03)00005-X
Marsh, 2021. Construction insurance market: Pricing and underwriter scrutiny increase; Capacity remains for good risks. New York.
Martina, Q. and Kumar, S., 2018. A study on insurance in construction industry. International Research Journal of Engineering and Technology (IRJET), [online] 05(04), pp.3991–3993. Available at: www.irjet.net.
McAnulty, S. and Baroudi, B., 2010. Construction challenges in remote Australian locations. Association of Researchers in Construction Management, ARCOM 2010 - Proceedings of the 26th Annual Conference, (September), pp.1247–1257.
Mirkovic, M., 2018. The impact of failure types in construction production systems on economic risk assessments in the bidding phase. Complexity, 2018, pp.1–13. https://doi.org/10.1155/2018/5041803
Musundire, S. and Aigbavboa, C., 2015. Management of construction risk through contractor’s all risk insurance policy: a South Africa case study. 5th International/11th Construction Specialty Conference, [online] pp.192.1-192.8. Available at: https://open.library.ubc.ca/cIRcle/collections/52660/items/1.0076338.
Owusu-Manu, D.G., Ghansah, F.A., Darko, A. and Asiedu, R.O., 2021. Service quality of insurance in complex project deals in the construction industry in Ghana. International Journal of Building Pathology and Adaptation, 39(2), pp.344–367. https://doi.org/10.1108/IJBPA-09-2019-0078
Owusu-Manu, D.G., Ghansah, F.A., Darko, A., Asiedu, R.O. and Edwards, D.J., 2020. Insurable and non-insurable risks in complex project deals: Case of the Ghanaian construction industry. Journal of Engineering, Design and Technology, 18(6), pp.1971–1995. https://doi.org/10.1108/JEDT-10-2019-0265
Öztaş, A. and Ökmen, Ö., 2004. Risk analysis in fixed-price design-build construction projects. Building and Environment, 39(2), pp.229–237. https://doi.org/10.1016/j.buildenv.2003.08.018
Perera, B., Rathnayake, R. and Rameezdeen, R., 2008. Use of insurance in managing construction risks: Evaluation of Contractors’ All Risks (CAR) insurance policy. Built-Environment Sri Lanka, 8(2), pp.24–31. https://doi.org/10.4038/besl.v8i2.1909
Ryu, H., Son, K. and Kim, J.M., 2016. Loss prediction model for building construction projects using insurance claim payout. Journal of Asian Architecture and Building Engineering, 15(3), pp.441–446. https://doi.org/10.3130/jaabe.15.441
Shapiro, A.F., 2007. An overview of insurance uses of fuzzy logic. Computational Intelligence in Economics and Finance: Volume II, pp.25–61. https://doi.org/10.1007/978-3-540-72821-4_2
Shen, L., Wu, G.W.C. and Ng, C.S.K., 2001. Risk assessment for construction joint ventures in China. Journal of Construction Engineering and Management, 128(1), pp.76–81. https://doi.org/10.1061/(ASCE)0733-9364(2001)127:1(76)
Stewart, M.G., 2003. Cyclone damage and temporal changes to building vulnerability and economic risks for residential construction. Journal of Wind Engineering and Industrial Aerodynamics, 91(5), pp.671–691. https://doi.org/10.1016/S0167-6105(02)00462-2
Suraji, A., Duff, A.R. and Peckitt, S.J., 2001. Development of causal model of construction accident causation. Journal of Construction Engineering and Management, 127(4), pp.337–344. https://doi.org/10.1061/(ASCE)0733-9364(2001)127:4(337)
Tah, J.H.M. and Carr, V., 2001. Knowledge-based approach to construction project risk management. Journal of Computing in Civil Engineering, 15(3), pp.170–177. https://doi.org/10.1061/(ASCE)0887-3801(2001)15:3(170)
Tatum, M.C. and Terrell, F., 2012. Hurricane reconstruction in the United States Gulf Coast. International Journal of Disaster Resilience in the Built Environment, 3(3), pp.199–219. https://doi.org/10.1108/17595901211263602
The National Agency for Disaster Management, 2023. Indonesian disaster data. Data Informasi Bencana Indonesia.
Usman, N. and Ibrahim, A.M., 2015. Challenges associated with remote sites project management. Journal of Multidisciplinary Engineering Science and Technology, [online] 2(6), pp.1454–1459. Available at: https://www.jmest.org/wp-content/uploads/JMESTN42350820.pdf.
Vaughan, E.J. and Vaughan, T.M., 1994. Fundamentals of risk and insurance. Eleventh ed. The Journal of Risk and Insurance. Danvers, Massachusetts: John Wiley & Sons. https://doi.org/10.2307/253725
Werner, D., 1999. Managing risk – Construction insurance.
Wiguna, I.P.A. and Scott, S., 2005. Nature of the critical risk factors affecting project performance in Indonesian building contracts. In: 21st Annual ARCOM Conference 2005, University of London. London: Association of Researchers in Construction Management. pp.225–235.
Willis Tower Watson, 2021. Global construction rate trend report - Q2 2021 regional insight and rate trends. London.
Yum, S.G., Ahn, S., Bae, J. and Kim, J.M., 2020. Assessing the risk of natural disaster-induced losses to tunnel-construction projects using empirical financial-loss data from South Korea. Sustainability (Switzerland), 12(19), pp.1–15. https://doi.org/10.3390/su12198026
Zhao, X., Hwang, B.G. and Phng, W., 2014. Construction project risk management in Singapore: Resources, effectiveness, impact, and understanding. KSCE Journal of Civil Engineering, 18(1), pp.27–36. https://doi.org/10.1007/s12205-014-0045-x
Zhou, X., Wang, Y., Zhang, Y. and Liu, F., 2023. Macro investigation on China’s engineering insurance industry: Based on industrial organization theories. Engineering, Construction and Architectural Management. https://doi.org/10.1108/ECAM-03-2022-0219