Construction Economics and Building
Vol. 25, No. 2
July 2025
RESEARCH ARTICLE
Carbon Footprint Assessment of a Precast Concrete Yard: A Case Study from Thailand
Natee Suriyanon1,*, Pitch Sutheerawatthana2, Damrongsak Rinchumphu3, Ratchanon Suksawat4
1 Chiang Mai University, Chiang Mai, Thailand, natee.suriyanon@cmu.ac.th
2 King Mongkut’s University of Technology Thonburi, Bangkok, Thailand, pitch.sut@kmutt.ac.th
3 Chiang Mai University, Chiang Mai, Thailand, damrongsak.r@cmu.ac.th
4 Chiang Mai University, Chiang Mai, Thailand, ratchanon_suks@cmu.ac.th
Corresponding author: Natee Suriyanon, Chiang Mai University, Chiang Mai, Thailand, natee.suriyanon@cmu.ac.th
DOI: https://doi.org/10.5130/AJCEB.v25i2.9030
Article History: Received 05/02/2024; Revised 31/01/2025; Accepted 04/05/2025; Published 08/08/2025
Citation: Suriyanon, N., Sutheerawatthana, P., Rinchumphu, D., Suksawat, R. 2025. Carbon Footprint Assessment of a Precast Concrete Yard: A Case Study from Thailand. Construction Economics and Building, 25:2, 43–68. https://doi.org/10.5130/AJCEB.v25i2.9030
Abstract
Despite the significant contribution of precast concrete yards to greenhouse gas (GHG) emissions in the Thai construction industry, research on their carbon footprint is limited. This study assessed the carbon footprint of a precast concrete yard in Thailand, from 1 January to 31 December 2022, during which 2,054.60 m3 of precast concrete products were produced. The total carbon footprint for 2022 was 915.489 tCO2e (tons of carbon dioxide equivalent), with emissions categorized into Scope 1 (0.74%), Scope 2 (1.18%), and Scope 3 (98.08%). Notably, ready-mix concrete consumption emerged as the primary hotspot, contributing 70.59% of total emissions. The GHG emissions-to-production volume ratio for 2022 was 0.445580 tCO2e per m3, with a potential 0.44% reduction achievable by maximizing production volume. The study presented a GHG emission ratio of purchased goods (raw materials) to the production process for precast concrete (1:0.0136), facilitating estimates of emissions based on raw material data. Three key challenges in assessing carbon footprints in Thailand’s construction sector were identified: (1) limited carbon footprint data for construction materials, (2) inadequate data for general products, and (3) gaps in GHG emission factors for truck transportation in the Thai National Life Cycle Inventory Database. The identified GHG emission hotspots serve as critical starting points for strategies to manage and mitigate emissions in the case study yard and similar facilities, including optimizing ready-mix concrete usage and prioritizing environmentally responsible manufacturers. These insights, along with the identified challenges, offer valuable guidance for future assessments of organizational carbon footprints in the construction sector and the embodied carbon of buildings.
Keywords
Carbon Footprint; Concrete Yard; Greenhouse Gas Emission; Precast Concrete; Sustainability
Introduction
Climate change, manifested primarily as global warming, poses a severe threat to the planet. The Earth’s average temperature has increased steadily, resulting in significant ecological impacts and unpredictable weather patterns. According to data from the United Nations, the global temperature increased by 1°C in 2018 compared to that from the pre-industrial era. Global collaboration is essential to counteract potentially devastating consequences by limiting the temperature rise to 1.50°C and maintaining it below 2°C (UNFCCC, n.d.).
The anthropogenic greenhouse effect occurs when certain gases from human activities act as reflective barriers in the Earth’s atmosphere. These gases are the main drivers of global warming. This process allows sunlight to pass through the atmosphere but traps heat radiation, leading to a rise in global temperatures. Recognizing the gravity of this situation, Thailand, among other nations, pledged its commitment to address climate change during the 26th United Nations Climate Change Conference of the Parties. The Thai Prime Minister announced an ambitious target for the country to achieve net-zero greenhouse gas (GHG) emissions by 2065 (Office of Natural Resources and Environmental Policy and Planning, 2022).
The Kyoto Protocol was a global agreement for the reduction of GHG emissions that built upon the 1992 United Nations Framework Convention on Climate Change. It covered seven crucial GHGs with varying global warming potentials and suggested quantifying GHG emissions in terms of carbon dioxide equivalent (CO2e).
In 2022, Thailand was globally ranked 19th in terms of GHG emissions, releasing 463.875 M tCO2e (tons of CO2e) (Crippa et al., 2023). To attain the emission reduction objectives, collaboration among businesses from different industries is necessary. Real-estate developers and contractors, who are integral to the Thai construction sector, play pivotal roles in this effort. Their operations involve various activities that directly and indirectly emit GHGs, including the use of energy sources, consuming resources, and transportation. Obtaining detailed data on GHG emissions and their sources is crucial for raising environmental awareness among these stakeholders. Additionally, these data aid organizations in planning and implementing strategies that effectively reduce GHG emissions.
The construction industry is increasingly adopting precast construction methods, particularly in residential building projects. This approach involves manufacturing precast components in concrete yards and transporting them to sites for assembly. Research has shown that precast construction can reduce construction time by up to 15.17% compared to traditional methods (Priya and Neamitha, 2018). Consequently, GHG emissions now predominantly originate from precast concrete yards, making it essential to gather emission data from these facilities to formulate effective management guidelines for the construction sector.
The carbon footprint of an organization (CFO) represents the total GHG emissions released from the operations of an organization measures total GHG emissions from its operations in CO2e. Assessing the CFO enables organizations to understand their emissions related to specific activities and formulate strategies to reduce emissions from significant sources. Existing research on CFO has primarily focused on educational institutions and offices (Awanthi and Navaratne, 2010, 2018; Battistini et al., 2023; Chaivanich, 2020; Janangkakan, Chavalparit and Kanchanapiya, 2012; Keawsawang, Amonsanguansin and Sornilm 2017; Kiehle et al., 2023; Lucendo et al., 2019; Maimun et al., 2018; Pruangpreechasak et al., 2020; Rodtusana, 2013; Sikiwat et al., 2021; Tantipanatip, 2018; Usubharatana and Phungrussami, 2014; Vrachni et al., 2022). Additionally, a few studies have explored other sectors, such as a liquor factory (Doolgindachbaporn, Neeratanaphan and Wararakpraphat, 2014), a wine company (Pettineo et al., 2020), and a beverage manufacturing factory (Luengyuang and Wattana, 2022). There remains a knowledge gap regarding the CFOs of the construction sector, particularly precast concrete yards.
An examination of the Thailand Greenhouse Gas Management Organization (TGO) revealed that only 66 organizations from the construction industry—primarily manufacturing facilities for construction materials—were registered for CFO certificates (TGO, n.d.a). Further, only six real-estate developers and construction contractors had active carbon footprint registration certificates. These data highlight the need for greater awareness and understanding among organizations from the Thai construction sector regarding their GHG emissions.
This study aimed to enhance awareness of GHG emissions in the Thai construction sector by assessing the CFO of a specific case study and identifying major emission sources. Given the crucial role of precast concrete yards in GHG emissions for real-estate developers and contractors, a precast concrete yard was chosen for the case study.
Case study
The precast concrete yard selected for this case study is owned by one of the largest real-estate companies in Chiang Mai, Thailand, and spans 5,600 m2. It encompasses two sections of casting yards—one for detached house components and another for semi-detached house components—both measuring 10 m wide and 50 m long (500 m2 each). Two additional buildings occupy the premises: an 80-m2 single-story office and a 180-m2 single-story store. The yard’s layout, including the casting areas and buildings, is illustrated in Figure 1; Figure 2 provides a snapshot of the detached house component casting yard.
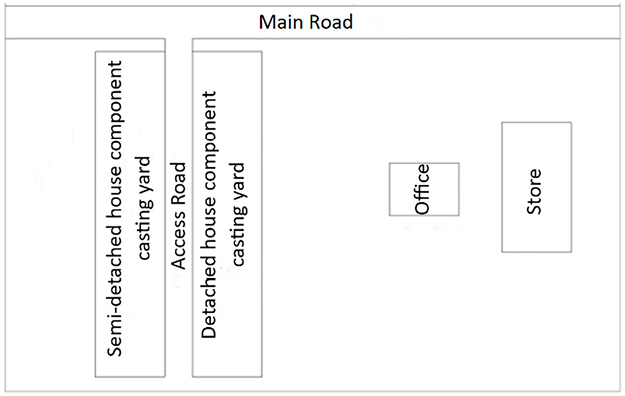
Figure 1. Layout of the precast concrete yard under study (Author’s own).
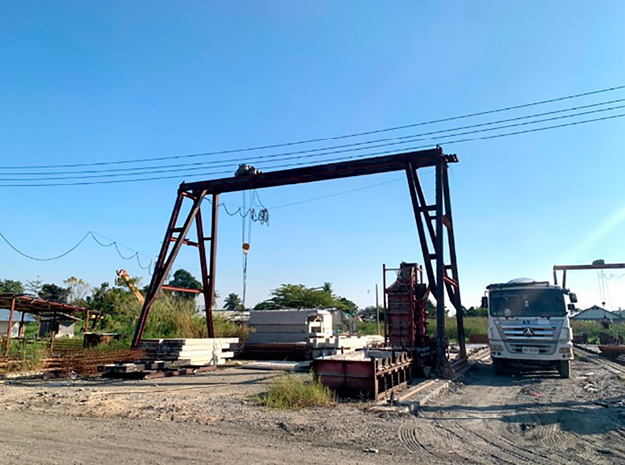
Figure 2. Detached house component casting yard (Author’s own).
The production process at the two casting yards involves seven stages operated by subcontractors. These include installing reinforcement steel onto the casting mold, assembling its sides, pouring concrete, curing, demolding, transferring to the storage area, cleaning molds, and transporting the precast components to sites. Further, the categories of precast components produced at the two casting yards are columns, beams, floor components (for second floors), and precast beams with an integrated floor (for balcony areas on the second floor).
Each detached house requires 23 precast components, comprising three columns, nine beams, nine floor components, and two beams with an integrated floor. Conversely, each semi-detached house requires 20 precast components: four columns, seven beams, seven floor components, and two beams with an integrated floor. The yard has a monthly production capacity of up to eight sets of precast components for detached and semi-detached houses. This totals 192 sets per year (96 sets for each house type), with a maximum concrete work quantity of 3,028.80 m3.
The key raw materials used in the production of precast components include concrete, reinforcing steel, and wire mesh. Additionally, tap water is utilized to clean the concrete mixer truck wheels before departure. The electricity-intensive appliances include two gantry cranes within the casting yards and a 24,000-BTU (British thermal unit) air-conditioning system in the office of the yard, which is staffed by nine members. On-site facilities also include a single restroom, and its wastewater undergoes treatment via a septic tank system.
Scope of the study and calculation approach
The primary objective of this CFO assessment was to identify emission hotspots from activities under the yard’s control, providing data to develop strategies for managing and mitigating GHG emissions. The store, located nearby but functioning independently as a company-wide storage facility for construction materials and machinery not directly managed by the yard, was excluded from the study. Consequently, the focus was solely on the three utility units within the yard’s operational control: the detached house component casting yard, the semi-detached house component casting yard, and the yard’s office.
To calculate the CFO, this study adhered to the guidelines established by the TGO (TGO, 2022a). These guidelines align with international standards such as International Organization for Standardization (ISO) 14064-1 (ISO, 2018) and corporate accounting and reporting standards (GHG Protocol, 2004). The TGO framework classifies GHG emissions into three distinct scopes. Scope 1 encompasses direct emissions from sources owned or controlled by an organization. Scope 2 includes indirect energy emissions from the imported electricity, heat, and steam consumed by an organization. Scope 3 addresses other indirect emissions associated with the organization’s activities but originating from sources controlled by external entities. Scope 3 is confined to categories deemed impactful to the organization.
Adopting the TGO requirements, this study provided an overview of the yard’s GHG emissions (CO2e), refraining from a detailed breakdown referring to specific gases. The emissions across all three scopes were calculated following a standardized equation:
GHG Emissions = Activity Data × Emission Factor,(1)
where GHG Emissions represents the amount of GHGs emitted during an activity (tCO2e). Activity Data encompasses the information about an emissions-producing activity, while Emission Factor is the conversion factor used for converting activity data into GHG emission values.
Research methodology
To achieve the goals of this study, a well-organized process with seven clear steps was carried out. Each step played a crucial role in understanding and reporting GHG emissions in the three utility units of the yard, covering activities based on Scopes 1, 2, and 3.
Step 1: Identifying current activity categories
The first stage involved carefully examining the processes and data from the three utility units in the yard. The main goal was to create a comprehensive list of activity categories within Scopes 1, 2, and 3, all contributing to GHG emissions in these units.
Step 2: Selection of relevant categories
After identifying activity categories, significant ones were evaluated and selected based on five criteria: sector guidance, magnitude, level of influence, risk, and employee engagement. As CFO assessments in Thailand are voluntary, the TGO does not set specific ranges for criteria scores, criterion weights, or thresholds for identifying significant categories. Instead, organizations have the flexibility to establish these parameters as needed. In this study, relevance score ranges, criterion weights, and category scoring thresholds were collaboratively determined with representatives from the organization conducting the CFO assessment. Table 1 outlines the guidelines used for assessing the importance scores of activity categories and their respective weights. Activity categories scoring 2 points or higher were considered significant, and their associated GHG emissions were assessed and reported.
Step 3: Specification of data types
In this phase, the data types necessary to calculate the GHG emissions were clearly defined. All activities were examined to determine whether the data were available or collectible within the organization. This step ensured accuracy, consistency, and the ability to replicate the GHG emission calculations.
Step 4: Collection of activity data
Here, the organization was contacted to collect the necessary activity data. Various existing documents, such as purchase orders, material issue notes, invoices, and product specifications, were used as primary sources. When documented data were unavailable, interviews with relevant personnel were conducted to gather essential activity data. The data obtained from the interviews were verified by comparing the consistency of responses from different interviewees and comparing them with insights or information provided by experts.
Step 5: Selection or computation of emission factors
This step involved obtaining the emission factors (EFs) for each activity from different sources or using calculated equations. Priority was given to the currency and reliability of the data sources. EFs were crucial for accurately calculating GHG emissions during the study.
Step 6: Calculation of GHG emissions
This step involved converting activity data into GHG emissions for each activity using EFs. The equation for these calculations is presented as Equation 1 in the “Scope of the study and calculation approach” section, with results expressed in MtCO2e.
Step 7: Analysis of GHG emission data
The final step involved a comprehensive analysis of the GHG emission data obtained throughout the study. Data were categorized to highlight relevant information regarding GHG emissions during the study period.
Monitoring period
The monitoring period of this study spanned from 1 January to 31 December 2022. As the primary function of the yard is to produce precast components for installation at construction sites, the volume of most activities at the yard is closely linked to the annual production of these components. Consequently, GHG emissions from these activities and the yard’s CFO are directly proportional to the production volume of precast components. Therefore, any assessment and analysis of the yard’s CFO should consider the production volume during this period, typically reported as the quantity of concrete (m3). During the monitoring period, the yard produced 56 sets of precast components for detached houses and 76 sets for semi-detached houses, totaling 2,054.60 m3, which represents 67.84% of the maximum production rate of the yard.
Relevant activity categories
After conducting a brief study on the yard operations, GHG emission activities were identified in three categories within Scope 1, one within Scope 2, and eight within Scope 3 (bolded categories in Table 2). Because sector guidance requires reporting all activity categories within Scopes 1 and 2, three categories within Scope 1 and one within Scope 2 were reported. Regarding Scope 3, after a thorough assessment based on specific criteria, only five categories—3-1, 3-3, 3-4, 3-5, and 3-7—were determined to score higher than 2. Therefore, these active categories were considered relevant to the organization, and their GHG emission data were reported (Table 2).
Note “/” means “Yes”
“x” means “No”
“-” means “Not considered”
Activity data, GHG EF, and GHG emissions
The activity data, GHG EFs, and emissions obtained in the study are presented in Tables 3–11. The activity data were collected from various sources. For GHG EFs, certified data from product suppliers accredited by the TGO were prioritized. Additional sources included the Thai National Life Cycle Inventory (TLCI) Database, peer-reviewed publications, Life Cycle Assessment (LCA) software, and data from reputable international organizations. Data with varying measurement units were converted to ensure consistency; the GHG emissions for each activity were calculated using Equation 1 and converted from kgCO2e to tCO2e.
| Activity | Activity data | Unit | Quantity | Quantity data source | EF (kgCO2e/ unit) | EF data source | Emission (tCO2e) |
|---|---|---|---|---|---|---|---|
| 2-1 Purchased electricity | |||||||
| Casting yards | |||||||
| - Electricity consumption | Electricity (grid mix) | kWh | 15,618.00 | Invoice/Calculation | 0.4999 | TGO (2022b) | 7.807 |
| Office | |||||||
| - Electricity consumption | Electricity (grid mix) | kWh | 5,967.00 | Calculation | 0.4999 | TGO (2022b) | 2.983 |
| Activity | Activity data | Unit | Quantity | Quantity data source | EF (kgCO2e/ unit) | EF data source | Emission (tCO2e) |
|---|---|---|---|---|---|---|---|
| 3-1 Purchased goods and services | |||||||
| Casting yards | |||||||
| - Ready-mix concrete consumption | Ready-mix concrete (350 KSC Cube) | m3 | 2,198.00 | Concrete receipt | 294.0000 | TGO (n.d.b) (The Concrete Products and Aggregate Co., Ltd.) | 646.212 |
| - Reinforcement bar consumption | Reinforcement bar | kg | 65,743.43 | Purchase order | 2.1400 | TGO (n.d.b) (Siam Steel Syndicate Pub Co., Ltd.) | 140.691 |
| - Flat bar consumption | Flat bar | kg | 699.60 | Purchase order | 0.9880 | TGO (n.d.b) (Metallic Pipe Mill Co., Ltd.) | 0.691 |
| - Wire mesh consumption | Wire mesh | kg | 44,064.84 | Purchase order | 1.6382 | Ecoinvent 2.2, IPCC 2007 GWP 100a | 72.187 |
| - Tying wire consumption | Black annealed iron wire | kg | 237.50 | Purchase order | 1.1400 | TGO (n.d.b) (Tata Steel Manufacturing Pub Co., Ltd.) (Thailand) | 0.271 |
| - PVC pipe consumption | PVC pipe (Class 5) | cm3 | 44,532.08 | Purchase order | 0.0045 | TGO (n.d.b) (Nawaplastic Industries Co., Ltd.) | 0.200 |
| - Oxygen consumption | Oxygen | kg | 1,604.46 | Purchase order | 0.4690 | TGO (2022c) | 0.752 |
| - Tap water consumption | Tap water (Provincial Waterworks Authority) | m3 | 14,765.00 | Invoice | 0.5410 | TGO (2022c) | 7.988 |
| Office | |||||||
| - Copier paper consumption | Copier paper (A4; 80 gsm) | Sheet | 32,500.00 | Stock card | 0.0115 | TGO (n.d.b) (Phoenix Pulp & Paper Pub Co., Ltd.) | 0.374 |
| - Toilet paper consumption | Toilet paper (300 m) | Roll | 8.00 | Stock card | 2.8100 | TGO (n.d.b) (Berli Jucker Cellox Co., Ltd.) | 0.022 |
| Activity | Activity data | Unit | Quantity | Quantity data source | EF (kgCO2e/ unit) | EF data source | Emission (tCO2e) |
|---|---|---|---|---|---|---|---|
| 3-3 Fuel- and energy-related activities | |||||||
| Casting yards | |||||||
| - LPG consumption | LPG mixed | kg | 420.00 | Invoice | 0.2720 | TGO (n.d.b) (Bangchak Corporation Pub Co., Ltd.) | 0.114 |
| - Gasoline consumption | Gasoline | l | 218.00 | Material issue note | 0.3440 | TGO (n.d.b) (Bangchak Corporation Pub Co., Ltd) | 0.075 |
| - Diesel consumption | Diesel | l | 950.00 | Material issue note | 0.2370 | TGO (n.d.b) (Bangchak Corporation Pub Co., Ltd) | 0.225 |
| - Electricity transmission and distribution losses | Electricity (grid mix) | kWh | 21,585.00 | Invoice | 0.0987 | TGO (2022b), TGO (2022c) | 1.541 |
| Office | |||||||
| - Electricity transmission and distribution losses | Electricity (grid mix) | kWh | 21,585.00 | Invoice | 0.0987 | TGO (2022b), TGO (2022c) | 0.589 |
| Activity | Activity data | Unit | Quantity | Quantity data source | EF (kgCO2e/unit) | EF data source | Emission (tCO2e) |
|---|---|---|---|---|---|---|---|
| 3-4 Upstream transportation and distribution | |||||||
| Casting yards | |||||||
| - Transporting ready-mix concrete | |||||||
| 10-wheeler concrete mixer 75% loading (max load 16.00 tons) (concrete plant to yard) | Load-distance | t-km | 99,173.76 | Concrete receipt/Google Map | 0.0625 | TGO (2022c) | 6.198 |
| 10-wheeler concrete mixer 0% loading (max load 16.00tons) (yard to concrete plant) | Trip-distance | km | 8,347.20 | Concrete receipt/Google Map | 0.6316 | TGO (2022c) | 5.272 |
| - Transporting reinforcement bar and wire mesh | |||||||
| 22-wheeler truck and trailer 100% loading (max load 32.00tons) (steel factory to yard) | Load-distance | t-km | 84,222.94 | Purchase order /Google Map | 0.0459 | TGO (2022c) | 3.866 |
| 22-wheeler truck and trailer 0% loading (max load 32.00tons) (yard to steel factory) | Trip-distance | km | 2,631.97 | Calculation/Google Map | 1.0206 | TGO (2022c) | 2.686 |
| - Transporting flat bar, tying wire, and PVC pipe | |||||||
| Large size 6-wheeler truck 0% loading (max load 11.00tons) (vendor’s store to yard) | Trip-distance | km | 96.00 | Purchase order /Google Map | 0.4923 | TGO (2022c) | 0.047 |
| Large size 6-wheeler truck 0% loading (max load 11.00tons) (yard to supplies store) | Trip-distance | km | 96.00 | Purchase order /Google Map | 0.4923 | TGO (2022c) | 0.047 |
| 22-wheeler truck and trailer 100% loading (max load 32.00tons) (factory to vendor’s store) | Load-distance | t-km | 536.59 | Purchase order /Google Map | 0.0459 | TGO (2022c) | 0.025 |
| 22-wheeler truck and trailer 0% loading (max load 32.00tons) (vendor’s store to factory) | Trip-distance | km | 16.67 | Calculation /Google Map | 1.0206 | TGO (2022c) | 0.017 |
| 22-wheeler truck and trailer 100% loading (max load 32.00tons) (factory to vendor’s store) | Load-distance | t-km | 323.71 | Purchase order /Google Map | 0.0459 | TGO (2022c) | 0.015 |
| 22-wheeler truck and trailer 0% loading (max load 32.00tons) (vendor’s store to factory) | Trip-distance | km | 10.12 | Calculation /Google Map | 1.0206 | TGO (2022c) | 0.010 |
| - Transporting oxygen | |||||||
| 6-wheeler truck 0% loading (max load 8.50tons) (vendor’s store to yard) | Trip-distance | km | 120.00 | Purchase order /Google Map | 0.4069 | TGO (2022c) | 0.049 |
| 6-wheeler truck 0% loading (max load 8.50tons) (yard to vendor’s store) | Trip-distance | km | 120.00 | Calculation /Google Map | 0.4069 | TGO (2022c) | 0.049 |
| - Transporting LPG | |||||||
| 4-wheeler truck 0% loading (max load 7.00tons) (vendor’s store to yard) | Trip-distance | km | 280.00 | Purchase order /Google Map | 0.3131 | TGO (2022c) | 0.088 |
| 4-wheeler truck 0% loading (max load 7.00tons) (yard to vendor’s store) | Trip-distance | km | 280.00 | Purchase order /Google Map | 0.3131 | TGO (2022c) | 0.088 |
| 22-wheeler truck and trailer 75% loading (max load 32.00tons) (oil refinery to vendor’s store) | Load-distance | t-km | 354.44 | Purchase order /Google Map | 0.0960 | TGO (2022c) | 0.034 |
| 22-wheeler truck and trailer 0% loading (max load 32.00tons) (vendor’s store to oil refinery) | Trip-distance | km | 22.15 | Purchase order /Google Map | 1.0206 | TGO (2022c) | 0.023 |
| - Transporting gasoline and diesel | |||||||
| 22-wheeler truck and trailer 100% loading (max load 32.00tons) (oil refinery to gas station) | Load-distance | t-km | 820.06 | Purchase order /Google Map | 0.0659 | TGO (2022c) | 0.054 |
| 22-wheeler truck and trailer) 0% loading (max load 32.00 tons) (gas station oil to refinery) | Trip-distance | km | 36.80 | Purchase order /Google Map | 1.0206 | TGO (2022c) | 0.038 |
| Office | |||||||
| - Transporting copier paper and toilet paper | |||||||
| 4-wheeler truck 0% loading (max load 7.00tons) (vendor’s store to yard) | Trip-distance | km | 40.00 | Purchase order /Google Map | 0.3131 | TGO (2022c) | 0.013 |
| 4-wheeler truck 0% loading (max load 7.00tons) (yard to vendor’s store) | Trip-distance | km | 40.00 | Purchase order /Google Map | 0.3131 | TGO (2022c) | 0.013 |
| 10-wheeler truck 100% loading (max load 16.00tons) (factory to vendor’s store) | Load-distance | t-km | 126.40 | Purchase order /Google Map | 0.0454 | TGO (2022c) | 0.006 |
| 10-wheeler truck 0% loading (max load 16.00tons) (vendor’s store to factory) | Trip-distance | km | 7.90 | Calculation /Google Map | 0.5747 | TGO (2022c) | 0.005 |
| Activity | Activity data | Unit | Quantity | Quantity data source | EF (kgCO2e/unit) | EF data source | Emission (tCO2e) |
|---|---|---|---|---|---|---|---|
| 3-5 Waste generated in operations | |||||||
| Casting yards | |||||||
| - Disposal of waste from casting precast concrete component | |||||||
| Ready-mix concrete waste | Ready-mix concrete waste | kg | 344,160.00 | Concrete receipt/Working drawing | 0.0000 | - | 0.000 |
| Reinforcement bar waste | Reinforcement bar waste | kg | 1,288.03 | Purchase order/Working drawing | 0.0030 | TGO (2022c)/Calculation | 0.004 |
| Flat bar waste | Flat bar waste | kg | 0.00 | Purchase order/Working drawing | Not considered | - | 0.000 |
| Wire mesh waste | Wire mesh waste | kg | 1458.02 | Purchase order/Working drawing | 0.0030 | TGO (2022c)/Calculation | 0.004 |
| Tying wire waste | Tying wire waste | kg | 0.00 | Interview | Not considered | - | 0.000 |
| PVC pipe waste | PVC pipe waste | kg | 0.00 | Interview | Not considered | - | 0.000 |
| Office | |||||||
| - Disposal of office waste through consumption and use (utilizing landfilling) | Office waste | kg | 949.63 | Calculation | 0.8076 | TGO (2022c) | 0.767 |
| Activity | Activity data | Unit | Quantity | Quantity data source | EF (kgCO2e/unit) | EF data source | Emission (tCO2e) |
|---|---|---|---|---|---|---|---|
| 3-7 Employee commuting | |||||||
| Casting yards | |||||||
| - Commuting between home and the yard (subcontractor worker) | Gasoline | l | 226.35 | Interview | 2.2394 | TGO (2022b) | 0.507 |
| Office | |||||||
| - Commuting between home and the yard (company employee). | Gasoline | l | 2,716.26 | Interview | 2.2394 | TGO (2022b) | 6.083 |
Emissions from activities within Scope 1-1 (direct GHG emissions from stationary combustion)
Two activities from the casting yard within Scope 1-1 are detailed in Table 3. Their GHG emissions totaled 1.785 tCO2e.
The liquefied petroleum gas (LPG) data in Table 3 were converted from the number of LPG cylinders noted on the invoice to kilograms using a conversion factor of 15 kg per LPG cylinder.
Emissions from activities within Scope 1-2 (direct GHG emissions from mobile combustion)
Table 4 outlines the casting yard activity within Scope 1-2, with a GHG emission of 2.604 tCO2e. A company-owned 10-wheeler truck used the specified diesel quantity to transport all precast elements from the yard to the construction site, separated by a distance of 1 km.
Emissions from activities within Scope 1-4 (direct GHG emissions from fugitive emissions)
Three Scope 1-4 activities—one from the casting yards and two from the office—are detailed in Table 5. The GHG emissions from these activities totaled 2.370 tCO2e.
To evaluate refrigerant leakage from air-conditioning units using R-410A, the refrigerant capacity of each unit was multiplied by its leakage rate and scaled by the total number of units. The refrigerant capacities and unit counts were obtained through surveys, while leakage rates were derived from Table 6-3 of TGO (2022a). The survey identified two key air-conditioning unit types: a unit with a 1.50-kg refrigerant capacity in a 10-wheeler truck used in the casting yards, and a unit with a 2.15-kg capacity in office buildings. Based on the TGO publication, leakage rates were assumed to be 20% for mobile air conditioners and 15% for standalone commercial applications. R-410A, composed of HFC-32 and HFC-125 in a 50:50 ratio, has its EF calculated as the average of the EFs of HFC-32 and HFC-125.
To estimate the CH4 emission from domestic wastewater treatment, the daily per-person CH4 leakage from domestic wastewater treatment was multiplied by the total working man-days of company officers. Based on IPCC, the calculated rate was assumed to be 0.012 kg per person per day (Doorn et al., 2006), while company data indicate a total of 3,195 man-days.
Emissions from activities within Scope 2-1 (indirect GHG emissions from purchased electricity)
Scope 2-1 encompassed the electricity consumption of the casting yards and office (Table 6). The invoice from the Provincial Electricity Authority indicated a total consumption of 21,585 kWh in 2022, equivalent to a GHG emission of 10.790 tCO2e. Owing to the absence of separate electricity meters, precise allocation of GHG emissions between the casting yards and office was challenging. Considering its significant portion of electricity usage, the entire electricity consumption of the office was attributed to the 24,000-BTU air-conditioning unit in this study. The electricity required for this air-conditioning unit was computed based on daily operation hours and employee workdays, resulting in 5,967 kWh. The remaining 15,618 kWh were allocated to the operation of the two gantry cranes and other equipment at the casting yards.
Emissions from activities within Scope 3-1 (indirect GHG emissions from purchased goods and services)
Ten Scope 3-1 activities, eight from the casting yards and two from the office, are detailed in Table 7. The GHG emissions from these activities totaled 869.388 tCO2e.
The determination of the quantities of various construction materials involved specific calculations. The weight of the reinforcement bars (kg) was obtained by multiplying the purchased amount by the weight per piece corresponding to each diameter and length. Similarly, the weight of the flat bars (kg) was obtained by multiplying the purchased amount of pieces by the weight per piece. The wire mesh consumption (kg) was calculated by multiplying the purchased amount by the weight per m2 for each wire mesh specification, categorized according to diameter and wire spacing. The consumption of black-annealed iron wire (kg) was determined by multiplying the number of wires, determined by the number of coils, by the weight per coil. The amount of polyvinyl chloride (PVC) Class 5 pipes was calculated by multiplying the number of pieces by the volume of PVC per piece. The amount of consumed oxygen (kg) was calculated by multiplying the purchased amount of tanks by their weight capacity, obtained from the oxygen volume per tank and the mass density of oxygen. In terms of the office materials, the quantity of the A4 copier paper sheets was determined by multiplying the amount of paper packs by the number of sheets per pack (500 sheets/pack).
Notably, no carbon footprint data for flat bars, tying wires, and oxygen gas products from any manufacturer have been certified and listed by TGO. However, certified carbon footprint data for hot-rolled sheets—a precursor to flat bars—are available on the TGO website. Thus, these data were used as the GHG EFs for the flat bar consumption. Simultaneously, available carbon footprint data for a high-quality, high-carbon steel wire product resembling tying wire properties were used as the GHG EF for tying wire consumption. Finally, the GHG emissions from oxygen gas consumption were calculated using the GHG EF of liquid oxygen, a by-product of chemical manufacturing processes, as a substitute.
Emissions from activities within Scope 3-3 (indirect GHG emissions from fuel- and energy-related activities)
Four Scope 3-3 activities, three from the casting yards and one from the office, are detailed in Table 8. The GHG emissions from these activities totaled 2.544 tCO2e.
Emissions from activities within Scope 3-4 (indirect GHG emissions from upstream transportation and distribution)
Seven Scope 3-4 activities, with six from the casting yards and one from the office, are detailed in Table 9. The GHG emissions from these activities totaled 18.643 tCO2e.
The concrete weight used in the load-distance calculation (5,275,200 kg) was obtained by multiplying the purchased volume of plain cement concrete (m3) by its unit weight (2,400 kg/m3). Transport from the concrete plant to the yard involved 10-wheeler concrete mixers covering a distance of 18.80 km, with each trip carrying 12 tons (75% of full capacity) over 444 trips.
Reinforcement bars and wire mesh were shipped directly from the steel factory to the yard using 22-wheeler trucks and trailers, typically at full capacity. If the yard ordered less than a full truckload, the vendor proposed sharing transportation with external parties. The transportation distance to the yard was 767 km, including an additional 50 km for travel. The required trips for transporting reinforcement bars and wire mesh were calculated by dividing the total weight by the load per trip, resulting in 3.43 trips.
Flat bars, tying wires, and PVC pipes were delivered from the vendor’s store to the yard using large six-wheeler trucks. The PVC pipe weight (125 kg) for load-distance calculations was determined by multiplying the purchased quantity by the weight per piece (1.25 kg/piece). With a load per trip under 5.50 tons (50% of full capacity), GHG emissions for empty trucks (0% loading) were calculated over an 8-km distance, corresponding to 12 transport trips for flat bars, tying wires, and PVC.
Flat bars were transported from the steel factory to the vendor’s store with 22-wheeler trucks at full capacity, covering 767 km. The number of trips was calculated by dividing the total weight of flat bars by the load per trip, resulting in 0.02 trips. Tying wires and PVC pipes were transported from the factories to the vendor’s store using 22-wheeler trucks at full capacity, traveling 681.70 km (distance between Saraburi and Chiang Mai provinces plus an additional 50 km). The trips required for tying wires and PVC pipes were calculated to be 0.01 trips.
Oxygen cylinders were transported from the vendor’s store to the yard using six-wheeler trucks. Each cylinder, with a 6-L capacity, weighed a total of 56.58 kg (48 kg empty cylinder weight plus 8.58 kg of O2). An equal number of empty cylinders were returned, with a load per trip for both delivery and return under 4.25 tons (50% of full capacity). The GHG emissions for empty trucks (0% loading) were calculated over a 10-km distance, with 12 transport trips indicated by the purchase order data.
Four-wheeler trucks delivered a given number of LPG cylinders from the vendor’s store to the yard, each with a 15-kg capacity and a total weight of 33 kg (18 kg empty weight). An equal number of empty cylinders were returned. The load per trip for both delivery and return was less than 3.50 tons (50% of full capacity), leading to the application of GHG emissions for empty trucks (0% loading) over 10 km, with 28 LPG transport trips, each corresponding to a single cylinder.
Transporting LPG from the oil refinery to the vendor’s store required 22-wheeler trucks and trailers with a full load capacity of 32 tons. The empty weight of the LPG storage tank transported was 9.72 tons, accommodating 16 tons of LPG. Thus, the total transported weight was 25.72 tons per trip, constituting approximately 80.04% of the truck’s maximum capacity. The transportation distance from Rayong Province to Chiang Mai was 843.90 km, including an additional 50 km for travel. To account for the weight of the empty LPG storage tank, the GHG emission factor (EF) for LPG transportation was adjusted by multiplying by a factor of 1.608 (25.72 tons/16 tons), resulting in an adjusted value of 0.096 kgCO2e/t-km from the original 0.0597 kgCO2e/t-km. For the return trip, as the loaded weight was only 9.72 tons (less than 50% of full capacity), the GHG EF for the empty truck scenario (0% loading) was applied. The number of LPG transport trips was calculated by dividing the total weight of LPG by the per-trip load, resulting in 0.03 trips (0.420 tons/16 tons).
The weight of gasoline and diesel for load-distance calculations was determined by multiplying the volume of purchased fuel by the weight per liter (gasoline: 0.75 kg/L; diesel: 0.85 kg/L), yielding 164.25 kg of gasoline and 807.50 kg of diesel. Transport to refuel the yard vehicles involved 22-wheeler trucks with a full load capacity of 32 tons. With an empty tank weight of 9.72 tons, the load capacity for fuel was 22.28 tons. The transportation distance was also 843.90 km. The GHG EF for gasoline and diesel transportation per ton-kilometer was adjusted by multiplying by a factor of 1.436 (32 tons/22.28 tons), resulting in an adjusted value of 0.0659 kgCO2e/t-km from the original 0.0459 kgCO2e/t-km.
The quantity of copier paper was calculated by multiplying the number of purchased paper packs by the weight per pack (2.40 kg/pack), while the quantity of toilet paper was determined by multiplying the number of rolls by the weight per roll (0.78 kg/roll). For delivery, the vendor used four-wheeler trucks to transport these products from the store to the yard. Each trip’s loaded weight was under 3.50 tons (50% of full capacity), so the GHG emission value for the empty truck scenario was applied. The purchase order data indicated four transport trips over a distance of 10 km.
Transportation of copier and toilet paper from the factory to the vendor’s store used 10-wheeler trucks with a full load capacity of 16 tons. The transportation distance was 779.10 km, based on the distance between Samut Sakhon and Chiang Mai, plus an additional 50 km. The number of trips was calculated by dividing the total weight by the load per trip, resulting in 0.01 trips (0.16224 tons/16 tons).
Emissions from activities within Scope 3-5 (indirect GHG emissions from waste generated in operations)
Two Scope 3-5 activities, one from the casting yards and one from the office, are detailed in Table 10. The GHG emissions from these activities totaled 0.775 tCO2e.
The GHG emissions associated with waste disposal included emissions from waste disposal operations and those from waste transport to these sites. To determine the concrete waste amount (kg), the volume of waste concrete (m3) was multiplied by the plain cement concrete unit weight (2,400 kg/m3). Because concrete waste is inert and exhibits no chemical or biological reactivity, it does not decompose in landfills; consequently, concrete waste did not emit CH4 or N2O (Mah, Fujiwara and Ho, 2017). Residual concrete from delivery mixers was transported to the disposal site on the return journey to the concrete plant. As the GHG emissions from transporting concrete waste were considered part of the overall emissions for delivering concrete mixers to the plant, no GHG emissions were explicitly attributed to concrete waste disposal.
The waste generated during operations with reinforcement bars and wire mesh was sold to a recycling facility, resulting in zero GHG emissions from disposal at the site. Emissions were limited to transporting these materials to a recycling facility located 10 km away. Typically, six-wheeler trucks, each with a loaded weight per trip lower than 4.25 tons (50% of the full truckload), were used for this purpose. Therefore, the GHG emission value for the empty truck scenario (0% loading) was applied. Based on these data, the calculated amount of GHG emissions for transporting these materials to the recycling facility is 0.0030 kgCO2e per kg of material.
The purchased flat bars and tying wire were fully utilized for casting the precast concrete components, resulting in no waste from the production process. Similarly, PVC pipe waste was assumed to be zero because of the minimal quantity generated during the production process. Considering that PVC pipes are classified as inert waste and any transportation of PVC pipe waste was combined with general waste, emissions from the transportation process to the landfill were not considered significant.
To calculate office waste, the total amount of personal waste (kg) was first determined by multiplying the number of working man-days (1,775 man-days) by the paper waste generation rate per person per day (1.07 kg/person/day, according to the Pollution Control Department, 2023). As each day consists of 24 h, and approximately 8 h are spent sleeping, the remaining 16 h represent the active period for employees. During this active period, employees work in the office for approximately 8 h per day, which accounts for 50% of their active time. Therefore, the total office waste was calculated by multiplying the total personal waste by a factor of 0.5 to reflect the proportion of time spent at the office.
Emissions from activities within Scope 3-7 (indirect GHG emissions from employee commuting)
Two Scope 3-7 activities, one from the casting yards and one from the office, are detailed in Table 11. The GHG emissions from these activities totaled 6.590 tCO2e.
Subcontractors and company employees commuted to the yard using four-stroke motorcycles. To calculate the amount of gasoline used for commuting, daily commuting distance data for each subcontractor and company employee were first acquired through interviews. Next, the traveling distance for each person was calculated based on their daily commuting distance and number of days they worked at the yard. Considering the total commuting distance of subcontractors (8,520 km) and company employees (102,240 km) in 2022, the amount of motor gasoline (L) was determined by dividing these distances by the average fuel consumption rate of a four-stroke motorcycle (37.640 km/L).
Main findings and discussion
The GHG emissions data obtained throughout this study were categorized and analyzed to elucidate four relevant findings, as detailed in the following subsections.
CFO and GHG emissions hotspot
The total GHG emissions amounted to 915.489 tCO2e, constituting the CFO. Figure 3 depicts the breakdown of GHG emissions by activity type and the respective utility units responsible for each activity.
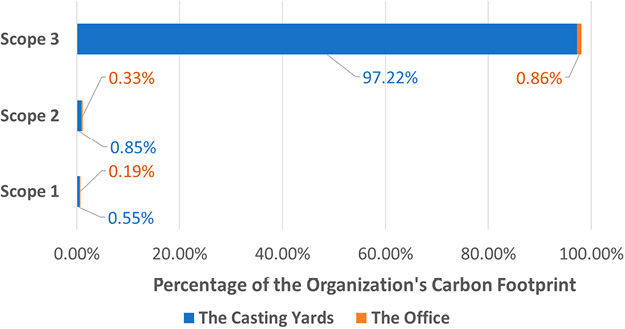
Figure 3. Breakdown of GHG emissions data by activity type and the respective utility units responsible for each activity.
Scopes 1 (direct GHG emissions), 2 (indirect GHG emissions from purchased energy), and 3 (other indirect GHG emissions) contributed 0.74%, 1.18%, and 98.08%, respectively, to the total CFO (Figure 3). Scope 3 activities accounted for the vast majority of GHG emissions (98.08%), far surpassing those of Scopes 1 and 2.
The comparison of GHG emissions from yard activities obtained in this study with those of previous works on CFOs of other organizations reveals a notable finding. Service-oriented organizations, such as educational institutions and offices, primarily generate GHG emissions from activities in Scope 1 (direct GHG emissions), Scope 2 (indirect GHG emissions from purchased energy), and Scope 3-7 (indirect GHG emissions from employee commuting) (Awanthi and Navaratne, 2010, 2018; Battistini et al., 2023; Chaivanich, 2020; and others). In contrast, yards generate most of their GHG emissions from activities in Scope 3-1 (indirect GHG emissions from purchased goods and services) and Scope 3-4 (indirect GHG emissions from upstream transportation and distribution), with a combined emission of 888.031 tCO2e, or 97.00% of the total emissions from the yard.
On the other hand, the results of comparing GHG emissions from this study with those of Chonburi Concrete Product Pub Co., Ltd., a concrete product factory, reveal a close alignment. Specifically, Chonburi Concrete Product Pub Co., Ltd. reports GHG emissions from activities in Scopes 1, 2, and 3, representing 2%, 0%, and 98%, respectively (TGO, 2023). This similarity reflects the shared core function of both the case study precast concrete yard and Chonburi Concrete Product Pub Co., Ltd.—processing raw construction materials into finished products. While both organizations generate some GHG emissions from direct activities (Scope 1) and electricity consumption (Scope 2), the majority of their emissions stem from raw material production and transportation within Scope 3. This finding highlights the importance of effective CFO management, which should focus not only on direct activities but also on supply chain management. To enhance sustainability, organizations should educate suppliers, raise awareness, and where necessary, enforce environmental responsibility.
Further analysis identified ready-mix concrete consumption (Scope 3-1) as the largest source of GHG emissions, emitting 646.212 tCO2e, or 70.59% of the total emissions. When emissions from ready-mix concrete transportation (Scope 3-4), which emitted 11.470 tCO2e, are added, these activities contributed a combined total of 657.682 tCO2e, or 71.84% of the total GHG emissions. This finding emphasizes the importance of efficient concrete usage management and selecting low-emission manufacturers to reduce emissions.
To manage construction materials efficiently, yards should review the entire process of ordering and using materials. This includes addressing key issues such as overestimating and overordering materials, losses during storage, inefficiencies in production processes, and product waste. Once these inefficiencies are identified, corrective actions can be implemented to minimize unnecessary material usage and associated emissions. At the same time, when selecting construction products, yards should consider the Carbon Footprint of Products (CFP) alongside their prices. If a product’s CFP is not available, manufacturers should be required to provide specific CFP data. By combining this information with transportation data and the distances between factories, suppliers, and yards, yards can identify and select more environmentally friendly products.
In this specific study, the yard used 2,198 m3 of ready-mix concrete, while only 2,054.60 m3 was required, resulting in 143.40 m3 of ineffective material usage, representing 6.98%. Proper concrete usage management could reduce the CFO by up to 5.01% (6.98% * 71.84%). Additionally, as the GHG EF of ready-mix concrete varies between 3.02% and 7.17% (based on TGO data), selecting different manufacturers could lower CFO values by 2.13% to 5.06% (3.02% * 70.59% to 7.17% * 70.59%). These findings highlight the importance of efficient material usage management and supplier selection strategies in effectively optimizing GHG emission management.
GHG emissions per production quantity
The CFO data revealed significant insights into emission distribution and management efficiency, but these findings were specific to the production quantity of a particular year. Relying solely on the absolute CFO value may provide incomplete information for the efficient management of GHG emissions, especially when considering potential annual changes in production quantity based on organizational policies. Therefore, GHG emissions per production quantity are a crucial metric for evaluating the effectiveness of GHG emission management.
Data from Figure 3 indicate that activities within casting yards and the office contributed to 98.62% and 1.38% of the CFO, respectively, establishing a GHG emission ratio of 1:0.0138 between the casting yards and office. Further analysis demonstrated that the emissions from the two casting yards aligned proportionally with product quantity. Conversely, office emissions, which are tied to employee numbers, remained relatively stable owing to consistent staffing levels.
In 2022, with a concrete work quantity of 2,054.6 m3, the GHG emissions from the organization were 914.729 tCO2e, resulting in a 0.445580 tCO2e/m3 ratio of GHG emissions per production quantity. Interviews revealed that office staff could support production at maximum capacity (3,028.8 m3). If the casting yards operated at full capacity, their estimated total GHG emissions would be 1,331.002 tCO2e (902.891 tCO2e * 3,028.80 m3/2,054.60 m3). Factoring in a consistent office emissions value (12.598 tCO2e), the estimated GHG emissions of the organization at full yard capacity in that year reached 1,343.600 tCO2e, resulting in a 0.443608 tCO2e/m3 ratio. These data suggest that increasing production to full capacity can reduce the GHG emissions per production quantity by 0.44%, emphasizing the potential benefits of maximizing the production efficiency.
It is important to note that the two strategies for optimizing GHG emissions discussed in the previous section, along with the strategy to increase production to full capacity presented here, are based on an analysis of GHG emission data collected during the monitoring period. These strategies are tailored to the current production environment for precast components, which relies on existing raw materials, designs, specifications, machinery, and labor. However, GHG emission control and reduction strategies should extend beyond the current environment. Yards can explore transformative measures such as switching to alternative, more environmentally friendly raw materials, redesigning precast components to minimize reliance on conventional materials or accommodate sustainable alternatives, and adopting increased automation in production processes to enhance reliability, reduce waste, and improve overall efficiency. These transformative changes could significantly lower GHG emissions while promoting more sustainable production practices.
Ratio of GHG emissions from purchased goods (raw material) to those from precast concrete production
Precast concrete products are essential in construction but are challenging to assess for embodied carbon in projects and the CFO of construction organizations because manufacturers rarely provide their carbon footprint data. Access to CFP data enables assessors to estimate GHG emissions associated with the use of precast concrete products. The CFP of precast concrete products primarily includes emissions from purchased goods (raw materials), transportation of raw materials, and production operations. While estimating GHG emissions from purchased goods and the transportation of raw materials is relatively straightforward, predicting emissions from the casting operations is more complex due to limited data on production processes. Accurate data on the ratio of GHG emissions from purchased goods to those from production operations are essential for reliable carbon footprint estimations of precast concrete products.
In 2022, the total GHG emissions from the casting yards in this case study amounted to 902.891 tCO2e, with 868.992 tCO2e attributed to purchased goods. The GHG emissions from the production process were calculated by subtracting the combined emissions from purchased goods and transportation-related activities from the total emissions of the casting yards. Transportation-related activities, including mobile combustion, fugitive emissions, fuel- and energy-related activities (limited to diesel), and upstream transportation and distribution, contributed an additional 22.062 tCO2e. As a result, the GHG emissions from the production process were determined to be 11.837 tCO2e (902.891 tCO2e − (868.992 tCO2e + 22.062 tCO2e)). The ratio of GHG emissions from purchased goods to those from the production process in this case study was 868.992:11.837 tCO2e, equivalent to 1:0.0136.
Obstacles and limitations in assessing the CFO in the Thai construction sector
Notable obstacles and limitations specific to assessing the CFO for entities in the Thai construction industry emerged in this case study. Below are three key aspects that represent these challenges:
1. Limited CFP data for construction materials: Evaluating a CFO in the construction sector requires comprehensive data on the CFP of various construction materials. This information is vital for assessing the GHG emissions from purchased goods (Scope 3-1), which are a significant contributor to total GHG emissions. The present case study revealed a need for more registered and certified CFP data for construction products within the TGO. It is imperative to have CFP data for relevant materials, such as flat bars, wire mesh, tying wires, and oxygen, registered and listed. Furthermore, among the limited construction materials with registered CFP data, only a few brands of each type of material were represented, adversely affecting the accuracy of the carbon footprint assessment.
2. Scarcity of data for general products: The TGO website has minimal CFP data for general office products, often having only one brand listed for each commonly consumed item (e.g., LPG, gasoline, diesel, copier paper, and toilet paper). This lack of data poses a challenge for organizations aiming to comprehensively assess the carbon footprint associated with their general product consumption.
3. Constraints regarding GHG EF data from truck transportation: The TLCI categorizes GHG EF data according to truck types and load weights. However, the existing categories—0%, 50%, 75%, and 100% loadings—are insufficient when confronted with cases involving load weights between 0% and 50%. The proposed addition of a 25% loading level to the database would enhance flexibility, allowing more accurate GHG EF values for GHG emission calculations. This refinement is crucial to more precisely assess the transportation-related carbon footprint of the construction industry.
Conclusions
This study delved into the carbon footprint assessment of a precast concrete yard in Chiang Mai, Thailand, uncovering a CFO of 915.489 tCO2e in 2022. A breakdown across Scopes 1 (direct GHG emissions), 2 (indirect GHG emissions from purchased energy), and 3 (other indirect GHG emissions) revealed contributions of 0.74%, 1.18%, and 98.08%, respectively, to the CFO. Notably, the ready-mix concrete consumption activity constituted 70.59% of the CFO and was identified as a significant GHG emission source. The results of this study suggest that implementing strategic optimization of the use of construction materials, focusing on ready-mix concrete, could reduce the CFO by up to 5.01%. Additionally, opting for diverse manufacturers of this material may result in CFO variations ranging from 2.13% to 5.06%. Thus, the importance of effectively managing construction material and selecting appropriate product manufacturers is underscored. In particular, employing these strategies for ready-mix concrete products could achieve a substantial reduction of GHG emissions in precast concrete yards.
By examining the 2022 production volume of concrete work (2,054.6 m3), this study established a 0.445580 tCO2e/m3 ratio for GHG emissions-to-production volume. Given the proportional relationship between the two casting yards and product volume emissions, attention was drawn to the correlation between office GHG emissions and the number of employees. Based on interview data indicating that the current office workforce in this case study is capable of supporting the maximum production capacity, the organization could reduce its GHG emissions-to-production volume ratio by increasing production to its maximum capacity. This would result in a 0.44% reduction of GHG emissions, from 0.445580 tCO2e/m3 to 0.443608 tCO2e/m3, emphasizing the potential of maximizing production volume to lower GHG emissions in relative terms, considering the remaining capacity associated with back-office operations.
This study highlighted the ratio of GHG emissions from purchased goods (raw materials) to those from the precast concrete production process (1:0.0136). Combining this ratio with GHG emissions data from purchased goods and raw material transportation enables a more accurate determination of the CFP for precast concrete products.
As a pioneering academic research endeavor in CFO assessment within the Thai construction industry, this study disclosed the obstacles and limitations for future CFO assessments in other Thai organizations. The three major challenges included the limited availability of carbon footprint data for construction materials and general products as well as the constraints on GHG EF data from truck transportation in the TLCI. These insights offer valuable considerations for subsequent assessments in this domain.
Recommendations for future research
The current study assessed the CFO of a specific type of construction organization—a construction yard. However, as various types of construction organizations have unique characteristics, further research is needed to deepen our understanding of their carbon footprints. This knowledge would enable organizations across the construction industry to develop more effective strategies for managing and reducing GHG emissions to achieve sustainability. Future research could focus on assessing the carbon footprints of other construction organizations, such as road, bridge, building, electrical system, and heating, ventilation, and air conditioning (HVAC) contractors.
Concerning specifically addressing the carbon footprint of yards, continued research is essential to fill knowledge gaps regarding strategies for improving organizational processes to control and reduce GHG emissions and to evaluate the effectiveness of these strategies. Broader process improvement options could involve changing raw materials, redesigning precast components, and modifying production processes. Investigating these areas would provide valuable insights, helping construction yards produce more environmentally friendly precast components and operate sustainably.
Moreover, the obstacles and limitations identified in this study regarding the assessment of organizational carbon footprints in the Thai construction sector underscore the urgent need for further research. Key areas include the carbon footprints of various brands of construction materials, general products, and emissions from truck transportation. Access to diverse and accurate data would allow assessors to select the most appropriate values for CFO evaluations, enhancing the reliability of these assessments for construction organizations. Ultimately, this would improve the effectiveness of strategies for managing and reducing GHG emissions in the construction industry.
References
Awanthi, M.G.G. and Navaratne, C.M., 2010. Carbon footprint of an organization: a case study, Faculty of Agriculture, University of Ruhuna. In: Proceedings of International Forestry and Environment Symposium 15th, Nugegoda, Sri Lanka, pp.366-77. https://doi.org/10.31357/fesympo.v15i0.206
Awanthi, M.G.G. and Navaratne, C.M., 2018. Carbon footprint of an organization: a tool for monitoring impacts on global warming. Procedia engineering, 212, pp.729-35. https://doi.org/10.1016/j.proeng.2018.01.094
Battistini, R., Passarini, F., Marrollo, R., Lantieri, C., Simone, A. and Vignali, V., 2023. How to assess the carbon footprint of a large university? The case study of University of Bologna’s Multicampus Organization. Energies, 16(1), 166. https://doi.org/10.3390/en16010166
Chaivanich, K., 2020. Carbon footprint of an organization: a case study of the Department of Ordnance Engineering Academic Division, Chulachomklao Royal Military Academy. Science and Technology Nakorn Sawan Rajabhat University Journal, 12(15), pp.48-57. (In Thai).
Crippa, M., Guizzardi, D., Pagani, F., Banja, M., Muntean, M., Schaaf E., Becker, W., Monforti-Ferrario, F., Quadrelli, R., Risquez Martin, A., Taghavi-Moharamli, P., Köykkä, J., Grassi, G., Rossi, S., Brandao De Melo, J., Oom, D., Branco, A., San-Miguel, J. and Vignati, E., 2023. GHG emissions of all world countries – JRC/IEA 2023 Report, Luxembourg: Publications Office of the European Union. https://doi.org/10.2760/173513
Doolgindachbaporn, T., Neeratanaphan, L., and Wararakpraphat, N., 2014. Carbon footprint of Thai White Spirit Factory. CRMA Journal, 12(1), pp.45-58. (In Thai).
Doorn, M.R.J., Towprayoon, S., Vieira, S.M.M., Irving, W., Palmer, C., Pipatti, R., and Wang, C., 2006. Chapter 6 - Wastewater Treatment and Discharge. In: S. Eggleston, L. Buendia, K. Miwa, T. Ngara and K. Tanabe, eds. 2006. 2006 IPCC Guidelines for National Greenhouse Gas Inventories. Japan: IGES, Ch.6.
GHG Protocol, 2004. A Corporate Accounting and Reporting Standard, Revised ed. USA: World Resources Institute and World Business Council for Sustainable Development.
ISO, 2018. ISO 14064-1: 2018 Greenhouse Gases–Part 1: Specification with Guidance at the Organization Level for Quantification and Reporting of Greenhouse Gas Emissions and Removals. Geneva: International Organization for Standardization.
Janangkakan, B., Chavalparit, O. and Kanchanapiya, P., 2012. Carbon footprint of an academic organization: a case study of the Department of Environmental Engineering, Chulalongkorn University. Applied Environmental Research, 34(1), pp.23-35. (In Thai).
Keawsawang, N., Amonsanguansin, J. and Sornilm, W., 2017. Carbon footprint assessment and sustainable approaches to reducing the greenhouse gas emissions of Thai local administrative organizations: a case study of the Bangkhae District Office, Thailand, Kasetsart Engineering Journal, 30(102), pp.61-72. (In Thai).
Kiehle, J., Kopsakangas-Savolainen, M., Hilli, M. and Pongrácz, E., 2023. Carbon footprint at institutions of higher education: the case of the University of Oulu. Journal of Environmental Management, 329, 117056. https://doi.org/10.1016/j.jenvman.2022.117056
Lucendo, A.G., García-Orenesa, F., Ruiz-Martínez, J.J. and Quilesb, P.G., 2019. The Spanish carbon footprint calculation and registration system: The Miguel Hernández of Elche University case. Advances in Ecological and Environmental Research, 4(11), pp.324-36.
Luengyuang, N. and Wattana, S., 2022. Corporate carbon footprint assessment: a case study of beverage manufacturing factory. In: Proceedings of The 23rd National Graduate Research Conference, Khon Kaen, Thailand, pp.201-12. (In Thai).
Maimun, T., Teekasap, S., Sareephattananon, A. and Rattanatai, B., 2018. Organization carbon footprint assessment of Eastern Asia University. EAU Heritage Journal Science and Technology, 12(2), pp.195-209. (In Thai).
Mah, C.M., Fujiwara, T. and Ho, C.S., 2017. Concrete waste management decision analysis based on life cycle assessment. Chemical Engineering Transactions, 56, pp.25-30. https://doi.org/10.3303/CET1756005
Office of Natural Resources and Environmental Policy and Planning, 2022. Thailand’s Long-term Low Greenhouse Gas Emission Development Strategy, Revised ed. Bangkok: Office of Natural Resources and Environmental Policy and Planning.
Pettineo, G., Raciti, R., Allegro, G., Zerbo, A. and Froio, A.P., 2020. Principi Di Butera: the carbon footprint in the Sicilian wine industry. Procedia Environmental Science, Engineering and Management, 7(2). pp.233-242.
Pollution Control Department, 2023. Report on the Community Waste Management Situation in Thailand 2022. (In Thai). [online] Available at: https://www.pcd.go.th/publication/29509 [Accessed 1 January 2024].
Priya, P.K. and Neamitha, M., 2018. A comparative study on precast construction and conventional construction. International Research Journal of Engineering and Technology (IRJET), 5(8), pp.839-42.
Pruangpreechasak, P., Junggoth, R., Tantriratna, P. and Kamsong, T., 2020. Carbon footprint of organization: case study Faculty of Public Health, Khon Kaen University. KKU Journal for Public Health Research, 13(3), pp.34-43. (In Thai).
Rodtusana, I., 2013. Carbon footprint for organization; Huachiew Chalermprakiet University. Applied Environmental Research, 35(2), pp.33-42. (In Thai).
Sikiwat, W., Thonghom, W., Kwangsopa, S., Neamhom, T. and Patthanaissaranukool, W., 2021. Carbon footprint of Faculty of Public Health, Mahidol University, Phayathai Campus. Thai Science and Technology Journal, 29(4), pp.604-17. (In Thai).
Tantipanatip, W., 2018. Carbon footprint of organization: a case study of the Faculty of Science and Technology, Phranakhon Si Ayutthaya Rajabhat University. Journal of Science & Technology MSU, 37(4), pp.494-503. (In Thai).
TGO, 2022a. Requirements for the calculation and reporting of the carbon footprint of the organization. 6thed. Thailand Greenhouse Gas Management Organization. (In Thai).
TGO, 2022b. Emission Factor compiled from secondary data for the assessment of organizational carbon footprints, Carbon Label Project. (in Thai). [online] Available at: https://thaicarbonlabel.tgo.or.th/tools/files.php?mod=YjNKbllXNXBlbUYwYVc5dVgyVnRhWE56YVc5dQ&type=WDBaSlRFVlQ&files=TXc9PQ [Accessed 1 January 2024].
TGO, 2022c. Emission Factors Categorized by Industry Groups, Carbon Label Project. (in Thai). [online] Available at: https://thaicarbonlabel.tgo.or.th/index.php?lang=TH&mod=Y0hKdlpIVmpkSE5mWlcxcGMzTnBiMjQ9 [Accessed 1 January 2024].
TGO, 2023. Manufacture and Distribute Precast Concrete Products, Carbon Label Project. (in Thai). Available at: https://thaicarbonlabel.tgo.or.th/index.php?lang=TH&mod=YjNKbllXNXBlbUYwYVc5dVgyRndjSEp2ZG1Gcw&action=WkdWMFlXbHM¶m=TVRVek1EQT0 [Accessed 1 January 2024].
TGO, no date a. Carbon footprint of Organization: Certified Companies and Products, Carbon Label Project. (in Thai). [online] Available at:
https://thaicarbonlabel.tgo.or.th/index.php?lang=TH&mod=YjNKbllXNXBlbUYwYVc5dVgyRndjSEp2ZG1Gcw [Accessed 1 January 2024].
TGO, no date b. Carbon footprint of Product: Certified Companies and Products, Carbon Label Project. (in Thai). [online] Available at: https://thaicarbonlabel.tgo.or.th/index.php?lang=TH&mod=Y0hKdlpIVmpkSE5mWVhCd2NtOTJZV3c9 [Accessed 1 January 2024].
UNFCCC, no date. The Paris Agreement: What is the Paris Agreement?, Unfccc.int. [online] Available at: https://unfccc.int/process-and-meetings/the-paris-agreement#:~:text=Its%20overarching%20goal%20is%20to,above%20pre%2Dindustrial%20levels.%E2%80%9D [Accessed 1 January 2024].
Usubharatana, P. and Phungrussami, H., 2014. Carbon footprint of organization: case study for Thammasat University. Thai Journal of Science and Technology, 22(1), pp.1-12. (In Thai).
Vrachni, A., Christogerou, A., Thomopoulos, G.A., Marazioti, C. and Angelopoulos, G.N., 2022. Carbon footprint of the University of Patras in Greece: evaluating environmental culture and campus’ energy management towards 2030. Pollutants, 2(3), pp.347-62. https://doi.org/10.3390/pollutants2030024