Construction Economics and Building
Vol. 25, No. 3/4
December 2025
RESEARCH ARTICLE
Identifying Critical Risk Management Performance Indicators for Construction Projects in Ghana Using Confirmatory Factor Analysis
E. N. Jackson1,2, T. Shanmuga Priya3,*
1 Research Scholar, Department of Civil Engineering, VIT University, Vellore, India, emmanuelnana.jackson2019@vitstudent.ac.in
2 Lecturer, Department of Construction Technology and Management, Cape Coast Technical University, Cape Coast, Ghana, emmanuel.jackson@cctu.edu.gh
3 Professor, Department of Civil Engineering, VIT University, Vellore, India, shanmugapriya.t@vit.ac.in
Corresponding author: Shanmuga Priya T, shanmugapriya.t@vit.ac.in
DOI: https://doi.org/10.5130/AJCEB.v25i3/4.8973
Article History: Received 19/12/2024; Revised 29/06/2025; Accepted 18/07/2025; Published 05/12/2025
Citation: Jackson, E. N., Shanmuga Priya, T. 2025. Identifying Critical Risk Management Performance Indicators for Construction Projects in Ghana Using Confirmatory Factor Analysis. Construction Economics and Building, 25:3/4, 22–42. https://doi.org/10.5130/AJCEB.v25i3/4.8973
Abstract
Construction projects in Ghana lack critical risk management performance benchmarks for success evaluation, and as such, this study was conducted to identify risk management performance metrics for Ghanaian construction projects. Using a confirmatory factor analysis model, this study analyzed responses from construction industry stakeholders in Ghana. A systematic literature review was carried out to identify risk management performance indicators that can be used to calculate the overall performance of construction projects in Ghana. A total of seven grouped critical risk management performance indicators were identified from the literature and through the observation of the outcome of construction projects, which served as a foundation for generating a survey questionnaire. The questionnaire was designed based on the identified risk management performance indicators and distributed to respondents through emails, Google Forms, and in person. Data from the questionnaire responses were analyzed and modeled using descriptive statistics and a confirmatory factor analysis model. The study revealed that all the seven identified risk management performance indicators discovered affect how well Ghanaian construction projects perform. Nevertheless, the most critical ones are “main stakeholders (clients, consultants, contractors, customers, end-users, investors, etc.) satisfaction (FCRMPI2)”, “completion within budget (cost) and schedule (time) (FCRMPI3)”, “satisfaction with environmental sustainability, quality, scope, and health and safety requirements (FCRMPI6)”, and “contractors’ employees’ job satisfaction (FCRMPI7)”. Contribution to knowledge has been made by identifying the key metrics of performance for risk management that Ghanaian construction projects could use to measure their success.
Keywords
Performance Indicators; Ghana; Project Management; Risk Management; Structural Equation Modeling
Introduction
Many economies around the world rely heavily on the construction industry; thus, its expansion is crucial (Huang, Lan and Bai, 2013). The industry has made significant contributions to Ghana’s and other nations’ development in respect to gross domestic product (GDP) and employment (Mafundu and Mafini, 2019; Hove and Banjo, 2018; GSS, 2018; Naude and Chiweshe, 2017; GSS, 2016). Irrespective of how it has affected Ghana’s socioeconomic development, it suffers from low productivity and underperformance issues, ranging from achievement of project management objectives to stakeholders’ satisfaction (Boadu, Wang and Sunindijo, 2020; Ofori-Kuragu, Baiden and Badu, 2016). Perhaps, it may not be far from right to say that its performance is worse as compared to other industries (Penzes, 2018). The industry consists of numerous stakeholders with different backgrounds, and that makes the industry extremely risky. AlSaadi and Norhayatizakuan (2021, p. 4) asserted that construction projects are considered complex, fragmented, novel, and temporary, which in themselves encompass risks. This indicates that risk is very certain in construction projects and no construction project is immune to it. Risk management is thus critical to the successful outcome of construction projects (PMI, 2017; Chandra, 2015). For instance, Chovichien and Nguyen (2013, p. 131) indicated that the most suitable benchmarks for assessing project success are the project goals. However, the parameters used to assess a project’s performance differ from one to another due to the variations in complexity, scope, and size of projects (Ingle and Mahesh, 2020). Concerns about the factors that influence a project’s performance or success have generated varied outcries in the research community.
Earlier research has conceptualized that project performance is measured traditionally by achieving objectives such as cost (budget), quality, and time (schedule) which, hitherto, is referred to as the “iron triangle” or “triple constraints” (Chovichien and Nguyen, 2013; Fortune et al., 2011; Pheng and Chuan, 2006). Other research, however, intimated that the “iron triangle” or “triple constraints” as a performance criterion is old-fashioned and cannot be solely used as a determinant of project performance because of some factors (Ingle and Mahesh, 2020; Toor and Ogunlana, 2010; Shenhar et al., 2001). These factors may include changes in user needs, increasing environmental legislation, sustainability concerns, and unstable building functions. The construction industry has performance issues as regards cost overruns, quality, scope creep, and time (schedule) overruns. These issues have become a major concern to various stakeholders (Muhammad et al., 2021). The paradox of construction projects is that despite their numerous poor performances, they continue to be carried out. In light of this, the essential risk management performance variables for assessing construction project performance must be identified so that more effective management approaches can be established for future projects. Concerning this study’s objectives, project performance and project success are used interchangeably.
The issue of project performance or success is ambiguous, and this study considers project performance indicators synonymous with effective risk management outcomes. Multiple studies have been conducted in Ghana to enhance the effectiveness of construction projects (Ofori-Kuragu, Baiden and Badu, 2016; Yirenkyi-Fianko and Chileshe, 2015). The study highlights the lack of a statistically validated risk management performance indicator (RMPI) model for construction firms in Ghana. This model could be used to assess the success of construction projects. Although a previous study (Ofori-Kuragu, Baiden and Badu, 2016) had created nine performance metrics for assessing the effectiveness of Ghanaian building contractors, it only considered a small subset of contractors that were based in the two major cities (Accra and Kumasi) in the country. They did not include other categories with high-risk and performance issues such as D2K2, D3K3, and D4K4. Moreover, out of the 134 questionnaires they distributed, 79 were retrieved. The opinions of these 79 respondents lack generalization. The key performance indicators (KPIs) identified by the authors considered only client satisfaction but did not include the satisfaction of other stakeholders such as consultants, project managers, contractors, users, and contractor employees. The need for a more comprehensive model that includes various categories of contractors is highlighted. Ingle and Mahesh (2020, p. 10) advanced that the lack of performance measuring models and a subpar performance in the construction sector have drawn harsh criticism. Considering the various perceptions of project performance criteria, this study aims to establish the most critical risk management performance indicators that could impact the construction project performance in Ghana. To achieve this, the following objectives were developed:
(1) To identify risk management performance indicators impacting the success of construction projects in the country, and
(2) To develop a critical risk management performance model that could be used to measure the performance of construction projects in Ghana.
Literature review
Risk management of construction projects
The performance of construction projects may be strongly impacted by a variety of risks at different points of the project’s life cycle. A construction project is a transient undertaking, just like any other project, executed to generate a distinctive product, outcome, or service (PMI, 2013). Construction projects are associated with uncertainties, and according to Wu et al. (2017), owing to the inherent uncertainties in construction projects, risks are an indispensable component. A successful risk management strategy must include the four key elements of risk identification, assessment, monitoring, and control (PMI, 2013), and they ensure the performance of projects.
Construction projects depend heavily on risk management. Risk management, as described by PMI (2013), is the process of detecting potential risk factors, categorizing them, and establishing appropriate solutions to mitigate risk outcomes. Research indicates that risk management aims to mitigate threats’ negative consequences rather than eliminate uncertainty (Renault, Agumba, and Ansary, 2020; Maylor, 2010). Baloi and Price (2003) hypothesized that risk management correlates with meeting project performance indicators, as risks are assessed based on their potential impact on project goals. Risk management, according to Wu et al. (2017), is not a tool that automatically guarantees success, but it is a tool that aids in accelerating the likelihood of attaining success. Accordingly, Ahmadi et al. (2017) agreed that the idea of risk management is proactive rather than reactive. They reported that many construction companies use risk management in their projects as a standard practice to boost output, earnings, and overall business performance. AlSaadi and Norhayatizakuan (2021) examined how risk management techniques could affect construction project performance in Oman. Their research suggested that risk management approaches considerably improve the efficiency of construction projects. Therefore, the need for planning project risks and effectively managing them are critical to successful outcomes (Teller, Kock and Gemünden, 2014). Wu et al. (2017) noted that accurate risk factor identification can be challenging, but it is an essential process for project success. Consequently, risk management performance factors that are critical to the performance of construction projects in Ghana were identified in this study and a model was developed for them. Nicholas and Steyn (2017) stated that “project management is risk management” to emphasize risk management’s critical role in project success. Given this, project management performance indicators can be termed risk management performance indicators.
Project performance
Project performance has been perceived differently by various researchers mainly because projects vary in complexity, scope, and size (Ingle and Mahesh, 2020). Its definition is so broad that it means differently across different communities and cultures. For example, Ofori-Kuragu, Baiden, and Badu (2016) argued that the issue of criteria for project performance is country-specific. Also, performance criteria may vary from the perspective of the client, consultants, contractors, and other construction industry stakeholders since every project has its distinctive features and margins. There is no universally accepted definition of project performance criteria, though several attempts have been made to establish them (Abal-Seqan, Pokharel and Naji, 2023). Tripathi, Hasan and Neeraj Jha (2019) suggested that KPIs are commonly used to track an organization’s non-financial and financial achievements since KPIs are considered measures that indicate the performance of a project. Ansari et al. (2022) also suggested that KPIs ensure the achievement of project goals and objectives by providing critical information for monitoring and controlling projects. Numerous construction organizations have introduced performance measurement through KPIs, and it is essential that stakeholders of the construction industry in Ghana also develop a model that could help measure or assess the performance of projects in the country.
Cooke-Davies (2002) distinguished between project performance and project management performance by establishing that the former is typically assessed based on the overall project objectives while the latter is mostly evaluated using the “iron triangle”. De Bakker, Boonstra and Wortmann (2010) maintained that the “iron triangle” was customarily utilized to measure any kind of project success. Project performance variables and project performance criteria are distinguished explicitly by De Wit (1988). He stated that project performance criteria are standards used to evaluate project results (market value, usage of project deliverables, etc.), whereas project performance variables are actions and components that contribute to project accomplishments (cost, scope, and time). Kerzner (2013) defined project performance criteria as principles or standards that are used to judge the success of a project, which is in line with the definition by De Wit (1988). However, some principles or standards differ from one nation to another and between individuals even though there are internationally accepted ones. Objective and subjective (quantitative and qualitative) metrics were used to categorize the KPIs (Chan and Chan, 2004). Some performance metrics, such as cost, time, quality, and safety, can be quantified. Ofori-Kuragu, Baiden and Badu (2016) created nine key performance metrics based on popular ones, from literature, for assessing the effectiveness of Ghanaian building contractors using only high-class (D1K1) contractors in Accra and Kumasi. The variables were ranked and client satisfaction was ranked first. The KPIs identified by the authors considered only client satisfaction but did not include the satisfaction of other stakeholders such as consultants, project managers, contractors, users, and contractor employees. It is crucial to update performance indicators regularly to reflect current industry trends. Meshram, Gitty, and Topkar (2020) examined and ranked project performance metrics in Mumbai to measure construction performance. According to the findings of their research, cost, time, safety, productivity, satisfaction, quality, knowledge, and service rank as the top KPIs for assessing the performance of construction projects. To assess the Indian construction organizations’ performance, fuzzy preference relation (FPR) techniques are used by Tripathi, Hasan, and Neeraj Jha (2019). The research outcome revealed that stakeholder satisfaction is the primary performance indicator for construction projects.
Heravi and Ilbeigi (2012) developed an exhaustive approach for assessing the achievement of construction goals and suggested an environment performance index. They argued that the environment performance index should be considered as a measuring criterion for the construction project performance concerning environmental issues because environmental considerations were not observed throughout the project’s construction. Serrador and Turner (2015) argued that technical performance, requirements, and the completion of functional goals are all related to quality and that different project stakeholders would have varying opinions on how well these goals have been attained. Moradi, Ansari and Taherkhan (2022) postulated that health and safety, quality, and scope are essential metrics for assessing the effectiveness of construction projects. Uddin et al. (2023) concluded that understanding health and safety issues is crucial to addressing some of the significant challenges facing the construction sector.
Contractors’ employees’ satisfaction is critical in assessing the performance of construction projects (Kasabreh and Tarawneh, 2019; Tayeh et al., 2019; Enshassi, Arain and Tayeh, 2012). It implies that if a person is happy in their position, they will continually want to increase their expertise and apply it to the development of the company. It is in the good interest of every serious organization to retain its experienced workers and this could be done when they are well motivated and satisfied (Sun, 2011). Again, the issue of worker turnover can be reduced when workers are satisfied because organizations rely on these satisfied workers for maximum productivity, which eventually translates into efficiency and performance of the organization. Key performance indicators for project performance are theoretically represented by the framework shown in Figure 1.
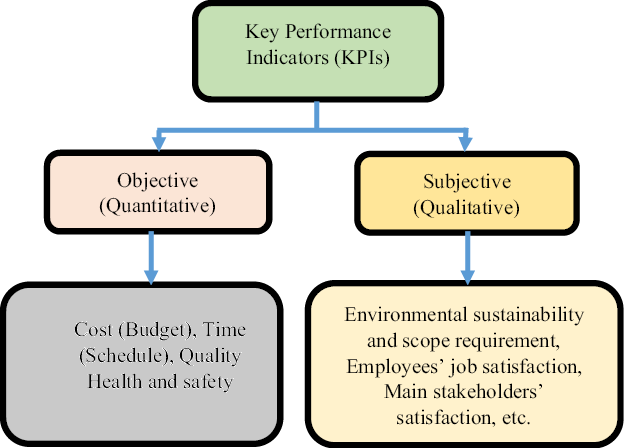
Figure 1. Theoretical framework of key performance indicators (adapted from Heravi and Ilbeigi, 2012)
The construction industry in Ghana
Ghana’s socioeconomic development is significantly influenced by the country’s construction industry. Approximately 14.34% of the country’s GDP is contributed by construction and real estate (GSS, 2018). The industry faces regulatory issues despite its potential (Boadu, Wang and Sunindijo, 2020). As a result, it is easy for one to enter and exit the industry, which has contributed to the industry being flooded with small- and medium-scale firms (Boadu, Wang and Sunindijo, 2020, Owoo and Lambon-Quayefio, 2018; Ofori-Kuragu, Owusu-Manu and Ayarkwa, 2016). Efforts have been made since 2014 to establish the Construction Industry Development Authority (CIDA) that would regulate the activities of the construction industry but has not yet seen daylight (Oxford Business Group, 2014).
The Ghana Government has established two ministries responsible for all building and accompanying minor and other major civil engineering works (Anzagira, Owusu-Manu and Badu, 2021). They are the Ministry of Works and Housing (MWH) and the Ministry of Roads and Highways (MRH). For instance, the MWH supervises all buildings and accompanied minor civil engineering works and the MRH superintends the construction, maintenance, and rehabilitation of airports, bridges, highways, railways, roads, and other associated civil engineering works. The Government of Ghana has also established other agencies to supplement the huge workload of MRH in the areas of implementation of projects within the subsector. These agencies include the Department of Urban Roads (DUR), Ghana Highways Authority (GHA), and the Department of Feeder Roads (DFR). The GHA is responsible for trunk roads, the DUR is in charge of all roads within the urban areas, and the DFR manages all the feeder roads in Ghana. Consultants are mainly engaged to supervise the construction works of contractors in Ghana. Public sector agencies and departments such as the Building and Road Research Institute (BRRI), Architectural and Engineering Services Limited (AESL), GHA, DUR, and DFR, among others, and other private consultancy firms that are members of professional institutions are usually involved in managing construction consultancy services in Ghana. Procurement of construction project contracts is based on a competitive bidding system, which, as stated in the Procurement Act, 2003 (Act 663), must adhere completely to the rules and regulations of the national procurement law. The traditional competitive bidding process, which is based on the lowest assessed bid price, is the primary method of procurement and, recently, public–private partnership (PPP). The government, as a major client, is duly represented by the MRH (for road works) and the MWH (for building and other projects) in giving out projects. The relationship between these consultants, contractors, and other stakeholders in the industry is shown in Figure 2.
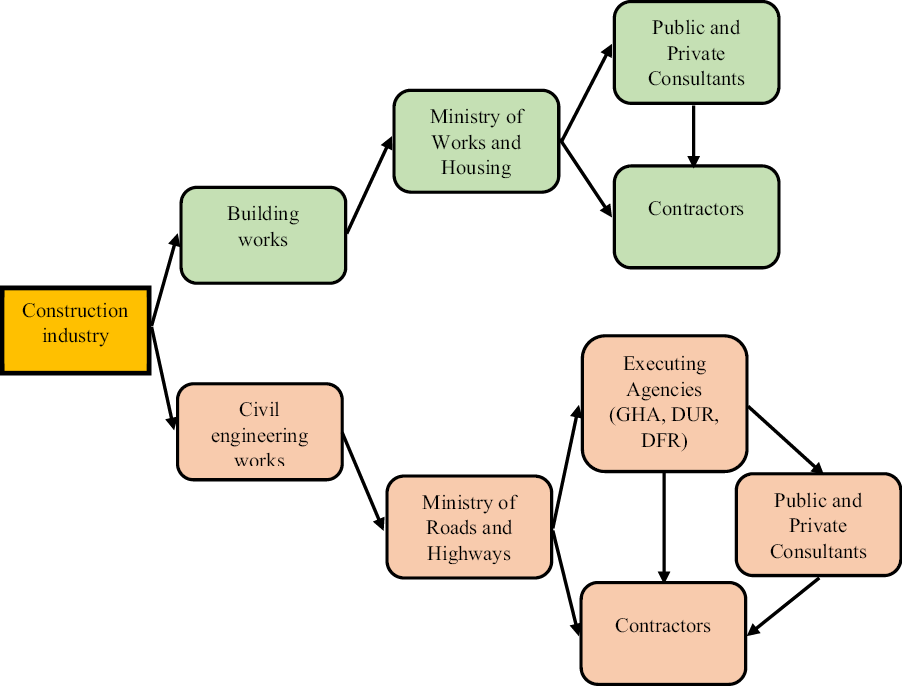
Figure 2. Conceptual framework on the structure of the Ghanaian construction industry (adapted from Anzagira, Owusu-Manu and Badu, 2021)
Methodology
This research work espoused a philosophy of positivism, coupled with a deductive approach. This is due to its reliance on large samples and measurements to assess a particular dataset, as well as its highly structured nature (Johnson and Christensen, 2014). The positivist philosophy is usually quantitative in nature as indicated by Saunders, Lewis and Thornhill (2019, p. 124). A survey grounded on quantitative research, which uses a questionnaire as an instrument for data collection, was considered appropriate for this study. A pilot study of the questionnaire was conducted by distributing the questionnaire to knowledgeable project practitioners in Ghana’s construction sector through emails, Google Forms, and face-to-face contacts. This approach is in agreement with the assertion that the combined utilization of multiple response-inducing techniques is the most effective strategy for responsiveness (Millar and Dillman, 2011). The respondents helped to confirm the risk management performance indicators found in the literature that affect construction project performance in the country. According to the respondents, the risk management performance metrics obtained from the literature and the risk management performance indicators to analyze the Ghanaian constructions’ project performance are equivalent. The performance metrics (factors) found in the literature were grouped into seven and explicit quantitative variables were developed for this study. The seven grouped components were included in a questionnaire to collect data for the development of a confirmatory factor analysis (CFA) model, as well as to verify their one-dimensionality and reliability (Creswell and Plano Clark, 2018). Administering of the questionnaire was done using emails, Google Forms, and in person to the respondents who were contented with the method.
The first section of the questionnaire includes an introductory letter describing the study’s goals. The respondents’ fundamental profiles were collected, including their educational background, work experience in the construction field, and class of firms. Construction industries in Ghana are classified based on their annual turnover, plant and equipment holdings, experience, qualification of personnel, etc. D1K1/A1B1 firms are high-class, and D4K4/A4B4 firms are low-class. The second part was designed to include the risk management performance indicators found in the literature and through observation of construction projects outcome, and respondents were made to indicate those that could be used to measure project performance in Ghana. The most important information on the risk management performance indicators is provided in the third part. In this section, respondents were asked to rank their perceived influence of risk management performance metrics that affect project performance on a five-point Likert scale (1 = very low, 2 = low, 3 = neutral, 4 = high, and 5 = very high). In order to assess the questionnaire’s validity, the pilot participants were questioned to find out how the questions’ substance aligned with the previously stated goal. The validity of the experts was also examined. Using the same five-point rating system, 50 professionals (including architects, contractors, engineers, and quantity surveyors) from the Ghanaian construction industry were chosen at random from their respective professional associations and asked to rate the questionnaire’s applicability to its goals. There was an average score of 4.58 (SD = 0.26). The outcomes can be deemed sufficient for the study’s objectives. A mean score of 4.40 (SD = 0.655) was also attained for this study. The survey questionnaire with a five-point Likert scale (1–5) was chosen because it allows for quantitative data collection and the application of various statistical approaches for data analysis (Wu et al., 2017).
The study’s 6,770 population represented the three main parties involved in the construction sector: consultants, clients, and contractors. Architects, contractors, engineers, and quantity surveyors who are in good standing with their respective professional bodies make up the professional breakdown of these stakeholders. This statement consolidated various public opinions, providing credibility, reliability, and validity to the research. The objective of the study was to obtain a unified perception of the research from the respondents, rather than comparing their opinions. The probability sampling technique (simple random sampling without replacement) from the formula below was used to collect sample from the entire population (Ruel, Wagner and Gillespie, 2016; Fowler, 2014). Despite sample limitations, sampling without replacement is used in the majority of survey research because it yields more accurate estimators (Kish, 1995).
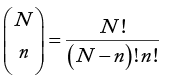
where N = population size
n = sample size
To ensure the generalizability of the study in Ghana, a probability technique of sampling was used to draw a sample of 565 from the population of 6,770 construction professionals. The study aimed to obtain a single view from professionals; thus, the sample selection was not proportional and did not compare responses among sub-populations. The size of the sample has become a contentious topic in research. Some researchers prefer a larger sample size for generalization to be made and others insist that there is no specific number for sample size (Leedy and Ormrod, 2018; Cohen, Manion and Morrison, 2017). However, Bagozzi and Yi (2012) postulate that a sample size above 200 should always be considered for robust and complex models. The study sample resonates with the guidelines proposed by Gay, Mills and Airasian (2012) for the selection of sample size, which indicates that a sample size of 400 is sufficient over a certain threshold (about 5,000), after which the population size is almost irrelevant.
In this study, a sample size of 565 was deemed suitable to represent the entire population. To address issues of non-responses and other infractions that accompany the research survey, the authors chose 165 more samples than the recommended samples by Gay, Mills and Airasian (2012). To choose the subjects of the selected size of the sample, a simple random sampling method was used. The aim was to ensure equal opportunity for all individuals to be selected. All participants for the study were selected sequentially without any replacements. The sample size comprised 166 quantity surveyors, 158 engineers, 49 contractors, and 89 architects. These professionals in the construction industry were selected for this study because they are familiar with the challenges of risk management in this field. Based on their practical experience, the researchers aimed to provide industry players with insights into how to improve risk management performance in the Ghanaian construction sector. The sample size was increased to improve response rate and generalization. The total number of questionnaires distributed was 565. Out of these, 478 responses were retrieved, with 16 outliers. A total of 462 valid responses were used for analysis.
The fundamental profiles of the respondents were analyzed using descriptive statistics and in accordance with Luciano (2021). The respondents’ level of agreement with the listed parameters and dispersion of the dataset from the mean was assessed using standard deviation (SD) from the formula below:
where
xi = value of the ith point in the dataset
x = the mean value of the dataset
n = the number of data points in the dataset
The data were analyzed with structural equation modeling (SEM) software, which is a multivariate analysis. This statistical test combines confirmatory factor analysis, exploratory factor analysis (EFA), and structural model. These equations illustrated each relationship between the variables used in the analysis. During the SEM procedure, the measurement model was assessed to identify the structural relationship between latent variables. The internal consistency of a latent variable, also known as scale reliability, is frequently assessed using Cronbach’s alpha coefficient. The scale employed to assess the latent variable was more trustworthy, as indicated by Cronbach’s coefficient, which had a minimum value of 0.70.
Data analysis and results
Profile of respondents
A total of 565 questionnaires were distributed, and 478 of those, together with 16 outliers, were later retrieved from the respondents, representing an overall response rate of 84.6%. Moser and Kalton (2017) postulated that a survey result with a response rate lower than between 20% and 30% is considered biased, inadequate, and of little significance. A response rate of 84.6% is therefore considered sufficient for this study. Table 1 contains each respondent’s background, including their education, work experience in the construction industry, class of firm, and annual turnover/work volume. It should be noted that all the percentage values are approximate.
The majority of the respondents (54.3%) had BSc. or BTech. as their highest educational qualification at the time of data collection; 34.4% of them had either MTech./MSc./MPhil. as their highest educational qualification and 7.8% had a Diploma; 2.6% had a PhD., and 0.9% of the respondents had the least educational qualification of Senior Secondary or Senior High School (SSCE/SHS). On average, the respondents had high educational qualifications, and therefore, it is hoped that the information they provided would be reliable. The majority of respondents (47.2%) in the construction industry had 6 to 10 years of work experience, followed by 35.5% who had 11 to 15 years of experience, and 9.7% who had 16 to 20 years. Again, respondents with between 1 and 5 years of experience made up only 5% (23 out of 462) of the total respondents; thus, their input did not significantly impact the study. Of the total respondents, 4.5% reported having 21–25 years of experience, 1.7% had 26–30 years of experience, and 1.3% had above 30 years of experience. It was further revealed from Table 1 that the bulk (50.9%) of the respondents, which were made up of clients and consulting firms combined, were not classified or categorized as that of the contracting firms. Moreover, 18.8% of the contracting firms were D2K2/A2B2, 11.3% were D1K1/A1B1, 10.0% were D3K3/A3B3, and the remaining 9.1% were D4K4/A4B4. Regarding the yearly turnover/volume of work, 20.1% of the respondents had managed projects valued between $1.1 million and $5 million, 29.9% had managed projects valued between $501,000 and $1 million, and 26.8% were unaware of the annual turnover/volume of work they had managed. An annual turnover/work volume of $5.1 million to $10 million was reported by 7.8% of the respondents, an annual turnover/work volume of less than $500,000 was reported by 6.7%, an annual turnover/work volume of $10.1 million to $15 million was reported by 4.8%, and an annual turnover/work volume of more than $15 million was reported by 3.9%. The information provided by these stakeholders in the construction industry was considered sufficient and reliable for the analysis.
Mean, standard deviation, and rank of critical risk management performance indicators
Table 2 shows the grouped critical risk management performance indicators ranked by mean score (MS) and SD. If two or more factors shared the same MS, it was deemed the component with the smaller SD to be more significant (Lu, Zhang and Pan, 2015; Wang and Yuan, 2011). There was evidence that all the indicators received positive ratings (mean values exceeded 3.00), suggesting that the respondents agreed with the indicators. Though there were variations in the responses, they were very low compared to the majority of the respondents who agreed. This is an indication that the respondents firmly believed that good risk management performance indicators ensure the high performance of construction projects. Table 2 further revealed that satisfaction with environmental sustainability, quality, scope, and health and safety requirements (M = 4.70; SD = 0.536; rank = 1st), completion within budget (cost) and schedule (time) (M = 4.70; SD = 0.536; rank = 2nd), contractors’ employees’ job satisfaction (M = 4.54; SD = 0.630; rank = 3rd), and main stakeholders (clients, consultants, contractors, customers, end-users, investors) satisfaction (M = 4.42; SD = 0.711; rank = 4th) embody performance indicators. It also affirmed that profitability (M = 4.42; SD = 0.722; rank = 5th), effective communication (M = 4.00; SD = 0.725; rank = 6th), and litigation avoidance (M = 4.00; SD = 0.722; rank = 7th) are indicators of performance that can be used to measure how well construction projects are performing.
Exploratory factor analysis: dimensionality of risk management performance indicator constructs
The risk management performance indicators were examined using EFA to determine their one-dimensionality and reliability. The extraction and rotation method was set to maximum likelihood with varimax rotation (ML Varimax). There were seven elements used for assessing the construct. It also agreed with Hair et al. (2010), who suggested Kaiser–Meyer–Olkin (KMO) cutoff values of 0.70 and Bartlett’s test of sphericity of p < 0.05. The analysis achieved a Kaiser–Meyer–Olkin (KMO) of 0.940 and a Bartlett’s test of sphericity of p < 0.000. These findings indicated that factor analysis may be performed using the data in Table 3. All seven indicators, namely, RMPI 1, RMPI 2, RMPI 3, RMPI 4, RMPI 5, RMPI 6, and RMPI 7, which are expected to measure risk management performance indicators, loaded one component. All items showed a factor loading of more than 0.5 for each component, which is higher than the recommended threshold of 0.4 proposed by Field (2005) and Hair et al. (2010).
For the component, all seven indicators noted a threshold greater than 0.5. They are “litigation avoidance”, “stakeholders (clients, consultants, contractors, customers, end-users, investors, etc.) satisfaction”, “completion within budget (cost) and schedule (time)”, “effective communication”, “profitability”, “satisfaction with environmental sustainability, quality, scope, and health and safety requirements”, and “contractors’ employees’ job satisfaction”. These items measure RMPI for construction projects. Thus, they will be called financial and construction critical risk management performance indicators (FCRMPI). After conducting exploratory factor analysis, the adjusted item–total correlation for the component’s items was extracted using the designated cutoff value of 0.30. The results showed that the component (FCRMPI) had a satisfactory internal reliability, with a Cronbach’s alpha coefficient of 0.835, indicating that the items were suitable measures for the component. These findings are consistent with Nunnally and Bernstein’s (1994) recommendations.
SEM for performance indicator (FCRMPI) construct
A CFA was subsequently conducted when the components’ one-dimensionality and reliability were sufficiently demonstrated by the EFA. Three statistical approaches of fit indices were used in the FCRMPI’s goodness-of-fit analysis technique for performance indicators (Hu and Bentler, 1999). With 125 degrees of freedom (df) and a probability of p = 0.0000, the FCRMPI model, which used sample data on performance indicators, generated an S-Bχ2 of 3.349. This chi-square score revealed that the sample data’s significant departure from the suggested model was a sign of a good fit. The chi-square test is more frequently used as a descriptive index of fit than it is as a statistical test because it is highly sensitive to sample size (Kline, 2005). The model is considered to be acceptable because the comparative fit index (CFI) value was found to be 0.927, which was higher than the cutoff value of 0.90. As shown in Table 4, the Bentler–Bonett normed fit index (NFI) value was 0.938, which was within the specified range but less than the specified cutoff value of NFI 0.90. Therefore, it is deemed appropriate to use the model. The calculated parsimony normed fixed index (PNFI) value was 0.524, which is also below the threshold value of 0.80. Additionally, the goodness-of-fit index (GFI) value of 0.962 is higher than 0.090, and the root mean residual (RMR) value of 0.019 is lower than 0.05. According to these fit indices for the performance indicators (FCRMPI) model, the proposed model fits the sample data well and can therefore be used for the complete latent variable model research.
The unidimensional model for performance indicator (RMPI) features is presented in Figure 3 and Table 5. Four of the seven indicator variables were obtained and included in the final CFA analysis (Byrne, 2006; Joreskog and Sorbom, 1989). The component realized as a result of the cases examined for this construct consisted of four indicator variables, FCRMPI (FCRMPI2, FCRMPI3, FCRMPI6, and FCRMPI7).
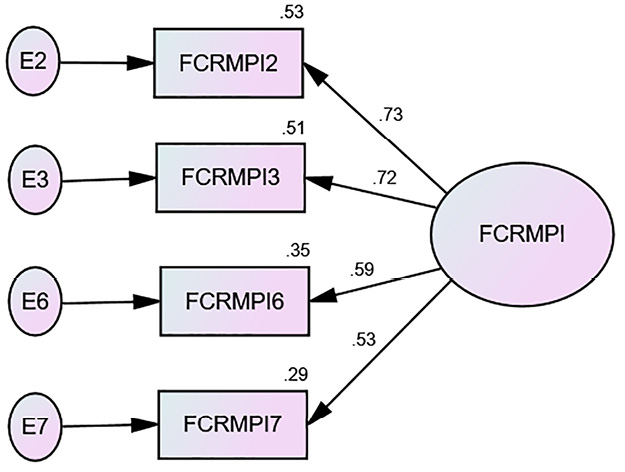
Figure 3. CFA model for the performance indicator (FCRMPI) construct
Discussion of results
The study employed three distinct approaches to analyze the data. The first approach involved determining the variability and initial ranking of each RMPI, using mean and standard deviation. The next step involved evaluating the unidimensionality and reliability of the factors in the RMPI followed by verifying the factor structure to determine model fitness. The responses were not widely dispersed from the sample mean as the standard deviations for all variables were less than 1 (Sullivan, 2011). According to the initial ranking, the three most important indicators are “Satisfaction with environmental sustainability, quality, scope, and health and safety requirements (RMPI 6)”, “Completion of project within budget (cost) and schedule (time) (RMPI 3)”, and “Contractors’ employees’ job satisfaction (RMPI 7)”. The indicator ranked lowest in mean and standard deviation was “Litigation avoidance (RMPI 1)”, according to Table 2.
However, the EFA multivariate analysis shows “Litigation avoidance (RMPI 1)”, “Main stakeholders (clients, consultants, contractors, customers, end-users) satisfaction (RMPI 2)”, and “Completion within budget (cost) and schedule (time) (RMPI 3)” as the three most influential indicators. Others include “Effective communication (RMPI 4)”, “Productivity (RMPI 5)”, “Satisfaction with environmental sustainability, quality, scope, and health and safety requirements (RMPI 6)”, and “Contractors’ employees’ job satisfaction (RMPI 7)” as shown in Table 3. All the variables revealed good internal reliability and unidimensionality as indicated by their Cronbach alpha of 0.835.
The development of the CFA model provided valuable information on the dataset’s fitness. The postulated model fits well because it adequately explains the sample data. The study revealed a one-factor model development with the RMPI variables. The correlation coefficients and outcomes of the statistical tests are presented in Table 6 for the complete one-factor with a four-causal indicator model. Each correlation value fell below 1.00, and each p-value was below the threshold of 0.05, which is considered significant and shows appropriate signs. Therefore, it was decided that the estimations were both realistic and statistically significant. The indicator with variable FCRMPI2 (Stakeholders satisfaction) has a parameter coefficient of 0.726, making it the parameter with the highest standardized coefficient. This implies that it is the variable with the strongest influence. This is in agreement with numerous research that indicates that the use of the traditional “iron triangle” alone cannot serve as the overall indicator of performance used to assess the success of construction projects, but other indicators such as stakeholders’ satisfaction should constitute part of the indicators (Khatatbeh, 2023; Meshram, Gitty and Topkar, 2020; Ofori-Kuragu, Baiden and Badu, 2016; Neyestani, 2016).
One of the key risk management metrics revealed by the study is completing projects on time and within budget (FCRMPI3), which Ghanaian construction projects should employ to assess their success. This indicator forms part of the traditional “iron triangle”, and several global research studies (Ingle and Mahesh, 2020; Ofori-Kuragu, Baiden and Badu, 2016; Serrador and Turner (2015) have indicated that measurements of the performance of construction projects are incomplete without cost and time requirements. Leon et al. (2018, p. 124) also claimed that cost and schedule are a few of the most essential metrics for evaluating the performance of construction projects.
Based on survey responses, meeting environmental sustainability, quality, scope, and health and safety requirements is critical to the success of construction projects (FCRMPI6). This is in conformance with recent research by Banihashemi (2021, p. 14), which suggested that environmental sustainability is a key performance criterion for assessing the performance of building projects.
Contractors’ employees’ job satisfaction (FCRMPI7) is one of the critical risk management performance indicators for measuring construction project performance in Ghana. This aligns with other research studies (Kasabreh and Tarawneh, 2019; Tayeh et al., 2019; Enshassi, Arain and Tayeh, 2012) that indicated that work satisfaction (competent staff on the project, their training, and the evolution of their performance) is one of the key performance factors used to assess the effectiveness of construction projects is. The secret to an organization’s success is its ability to make its employees feel good about their work, which has a cascading effect on many characteristics of the organization (Arshad, Arshad and Zakaria, 2023). It improves the efficiency of the construction firm and helps to boost investor confidence. The study asserts that contractors’ employees’ job satisfaction was essential to an organization’s overall productivity, which has implications for both the employer and the employee.
Conclusion
The utmost priority of every construction project is to perform creditably to the satisfaction of all stakeholders. Risk factors affecting construction projects should be identified and effectively managed to ensure the construction projects’ performance. The study employed three distinct approaches to analyze the data. The first approach involved determining the variability and initial ranking of each RMPI, using mean and standard deviation. In order to measure the success of construction projects, this study sought to create a unified risk management performance (RMPI) indicator model based on the various perspectives and practices of Ghanaian construction stakeholders. To do this, 11 risk management performance indicators were found in the literature, and conclusions were drawn from the observation of construction projects. These were then categorized into seven groups (RMPI1, RMPI2, RMPI3, RMPI4, RMPI5, RMPI6, and RMPI7). The indicators were viewed by the stakeholders as pertinent to their possible influence on construction projects. Initially, the mean and standard deviation were used to evaluate the dataset’s variability. Since all standard deviations were smaller than 1, it was concluded that there was no significant difference between the responses and the sample mean after examining the mean and standard deviation of each variable (Sullivan, 2011). This suggests that the performance of construction projects in Ghana might be assessed using each of the seven categorized indicators found in this study. The underlying structure of the indicators was then ascertained, and their correspondence with the hidden variables was confirmed using multivariate statistical analysis. According to the initial ranking, the four most important indicators that could be used to measure the success of construction projects are “Satisfaction with environmental sustainability, quality, scope, and health and safety requirements (RMPI 6)”, “Completion of project within budget (cost) and schedule (time) (RMPI 3)”, “Contractors’ employees’ job satisfaction (RMPI 7)”, and “Main stakeholders (clients, consultants, contractors, customers, end-users, investors) satisfaction (RMPI 2)”. The indicator ranked lowest in mean and standard deviation was “Litigation avoidance (RMPI 1)” according to Table 2. The same indicators were confirmed by the CFA as the critical risk management performance indicators that could be used to measure the success of Ghanaian construction projects but in different order of importance.
To create a crucial risk management performance indicator model, the study’s CFA made sure that only pertinent criteria were chosen. The computed Cronbach’s alpha indicated that the sample data were unidimensional and dependable. The significance of the expected results was validated by the p-values and associated values. A four-factor CFA model that significantly influences risk management performance metrics was identified by this study. The success of construction projects is greatly influenced by standardized coefficients that measure the “Satisfaction of key stakeholders (clients, consultants, contractors, customers, and end users) (FCRMP2)”, “Completion within budget (cost) and schedule (time) (FCRMPI3)”, “Satisfaction with environmental sustainability, quality, scope, and health and safety requirements (FCRMPI6)”, and “Job satisfaction of contractors’ employees (FCRMPI7)”. Critical risk management performance indicators that potentially impact construction project success and advance the field’s understanding of risk management were discovered in this study. Furthermore, the study provides a solid theoretical foundation for future investigations into methods that might be applied to pinpoint the crucial risk management performance metrics that could be employed to gauge the accomplishment of building projects.
The study recommends the establishment of a construction industry regulatory board (the Building and Construction Authority in Singapore, the Construction Industry Council in the UK, etc.) to oversee the operations of the construction industry in Ghana. By explicitly defining construction project performance indicators, the board would be able to assess how well Ghanaian construction projects would be performing. Moreover, construction stakeholders, contractors who are in charge of carrying out construction projects in particular, should be informed about the performance indicators that could be used to measure the effectiveness or success of their projects. This could be spearheaded by the construction industry regulatory board by organizing training programs and workshops for the industry players. The goal is to educate or sensitize them about the importance of the indicators to be used to assess their performance. This could help mitigate some of the construction risks that stakeholders, most especially contractors, encounter in the course of executing construction projects. The study’s findings would serve as a benchmark for project stakeholders in demonstrating their commitment to achieving performance excellence in construction projects in Ghana.
Acknowledgments
The authors would like to thank Richard Sarpong Boadi (Ph.D.) for taking time out of his busy schedule to proofread and edit this manuscript. Your effort to the success of this work is appreciated.
References
Abal-Seqan, M.H., Pokharel, S. and Naji, K.K., 2023. Key success factors and their impact on the performance of construction projects: Case in Qatar. Sustainability, 15(4), 3700, p. 1-20. https://doi.org/10.3390/su15043700
Ahmadi, M., Behzadian, K., Ardeshir, A. and Kapelan, Z., 2017. Comprehensive risk management using fuzzy FMEA and MCDA techniques in highway construction projects. Journal of Civil Engineering and Management, 23(2), p. 300-310. https://doi.org/10.3846/13923730.2015.1068847
AlSaadi, N. and Norhayatizakuan, N., 2021. The impact of risk management practices on the performance of construction projects. Studies of Applied Economics, 39(4), p. 1-10. https://doi.org/10.25115/eea.v39i4.4164
Ansari, R., Khalilzadeh, M., Taherkhani, R., Antucheviciene, J., Migilinskas, D. and Moradi, S., 2022. Performance prediction of construction projects based on the causes of claims: a system dynamics approach. Sustainability, 14(7), 4138, p. 1-19. https://doi.org/10.3390/su14074138
Anzagira, C.A., Owusu-Manu, D. and Badu, E., 2021. Towards a classification of family-owned construction firms in Ghana. European Journal of Management and Marketing Studies, 6(4), p. 147-172. https://doi.org/10.46827/ejmms.v6i4.1163
Arshad, M.A., Arshad, D. and Zakaria, N., 2023. Mediating role of wellbeing among organizational virtuousness, emotional intelligence and job performance in post-pandemic COVID-19. Frontiers in Psychology, 14: 1105895. https://doi.org/10.3389/fpsyg.2023.1105895
Bagozzi, R.P. and Yi, Y., 2012. Specification, evaluation, and interpretation of structural equation models, Journal of the Academy of Marketing Science, 40 (1), p. 8-34. https://doi.org/10.1007/s11747-011-0278-x
Baloi, D. and Price, A.D., 2003. Modelling global risk factors affecting construction cost performance, International Journal of Project Management, 21(4), p. 261-269. https://doi.org/10.1016/S0263-7863(02)00017-0
Banihashemi, S.A., Khalilzadeh, M., Zavadskas, E.K. and Antucheviciene, J., 2021. Investigating the environmental impacts of construction projects in time-cost trade-off project scheduling problems with CoCoSo multi-criteria decision-making method. Sustainability, 13(19), 10922. https://doi.org/10.3390/su131910922
Boadu, E.F., Wang, C.C. and Sunindijo, R.Y., 2020. Characteristics of the construction industry in developing countries and its implications for health and safety: an exploratory study in Ghana. International Journal of Environmental Research and Public Health, 17(11), 4110. Available at: https://www.researchgate.net/publication/34053841_Characteristics_of_the_Construction_Industry_in_Developing_Countries_and_Its_Implications_for_Health_and_Safety_An_Exploratory_Study_in_Ghana. https://doi.org/10.3390/ijerph17114110
Byrne, B.M., 2006. Structural equation modeling with EQS and EQS/Windows: basic concepts, application and programming. Mahwah, NJ: Lawrence Erlbaum Associates.
Chan, A.P. and Chan, A.P.L., 2004. Key performance indicators for measuring construction success. Benchmarking: An International Journal, 11(2), p. 203-221. https://doi.org/10.1108/14635770410532624
Chandra, H.P., 2015. Structural equation model for investigating risk factors affecting project success in Surabaya. Procedia Engineering, 125, p. 53-59. Available at: https://www.sciencedirect.com/science/article/pii/S1877705815033263. https://doi.org/10.1016/j.proeng.2015.11.009
Chovichien, V. and Nguyen, T.A., 2013. List of indicators and criteria for evaluating construction project success and their weight assignment. In: Proceedings of the 4th International Conference on Engineering, Project, and Production Management (EPPM 2013), pp. 130-150. Available at: https://www.semanticscholar.org/paper/LIST-OF-INDICATORS-AND-CRITERIA-FOR-EVALUATING-AND--Chovichien-Nguyen/1a564554f8d59c9895b8cbce5496d31cda71b09b. https://doi.org/10.32738/CEPPM.201310.0011
Cohen, L., Manion, L. and Morrison, K., 2017. Research methods in education. 8th ed. London: Routledge. https://doi.org/10.4324/9781315456539
Cooke-Davies, T., 2002. The real success factors on projects. International Journal of Project Management, 20(3), p. 185-190. https://doi.org/10.1016/S0263-7863(01)00067-9
Creswell, J.W. and Plano Clark, V.L., 2018. Designing and conducting mixed methods research. 3rd ed. Thousand Oaks, CA: Sage Publications.
De Bakker, K., Boonstra, A. and Wortmann, H., 2010. Does risk management contribute to IT project success? A meta-analysis of empirical evidence. International Journal of Project Management, 28(5), p. 493-503. https://doi.org/10.1016/j.ijproman.2009.07.002
De Wit, A., 1988. Measurement of project success. International Journal of Project Management, 6(3), p. 164-170. https://doi.org/10.1016/0263-7863(88)90043-9
Enshassi, A., Arain, F.M. and Tayeh, B., 2012. Major causes of problems between contractors and subcontractors in the Gaza Strip. Journal of Financial Management of Property and Construction, 17(1), p. 92-112. https://doi.org/10.1108/13664381211211064
Field, A., 2005. Discovering statistics using SPSS. 2nd ed. London: Sage Publication, Inc.
Fortune, J., White, D., Jugdev, K. and Walker, D., 2011. Looking again at current practice in project management. International Journal of Managing Projects in Business, 4(4), p. 553-572. https://doi.org/10.1108/17538371111164010
Fowler, F.J. 2014. Survey research methods, 5th ed. Center for Survey Research, University of Massachusetts: SAGE Publications, Inc. Available at: https://books.google.com.ua/books?id
Luciano, G., 2021. Statistical and multivariate analysis in material science. CRC Press. https://doi.org/10.1201/b21873
Gay, L.R., Mills, G.E. and Airasian, P., 2012. Educational research: competencies for analysis and applications. 10th ed. Upper Saddle River, NJ: Pearson Available at: https://yuli-elearning.com/pluginfile.php/4831/mod_resource/content/1/GayE%20Book%20Educational%20Research-2012.pdf
Ghana Statistical Service (GSS), 2018. Provisional 2017 annual gross domestic product. Accra, Ghana: GSS. Available at: https://www2.statsghana.gov.gh/docfiles/GDP/GDP2018/2017%20Quarter%204%20and%20annual%202017%20GDP%20publications/Annual_2017_GDP_April%202018%20Edition.pdf (Accessed: 10 December 2023).
Ghana Statistical Service (GSS), 2016. 2015 labour force report. Accra, Ghana: GSS. Available at: https://www2.statsghana.gov.gh/docfiles/publications/Labour_Force/LFS%20REPORT_fianl_21-3-17.pdf (Accessed: 10 December 2023).
Hair, J.F., Black, W.C., Babin, B.J. and Anderson, R.E., 2010. Multivariate data analysis. 7th ed. New York: Pearson Education Limited.
Heravi, G. and Ilbeigi, M., 2012. Development of a comprehensive model for construction project success evaluation by contractors. Engineering, Construction and Architectural Management, 19(5), p. 526-542. https://doi.org/10.1108/09699981211259603
Hove, G. and Banjo, A., 2018. Perceptions of small business executives on determinants of performance in the construction industry in Gauteng, South Africa. Acta Commercii, 18(1). https://doi.org/10.4102/ac.v18i1.528
Hu, L.T. and Bentler, P.M., 1999. Cutoff for fit indexes in covariance structure analysis: conventional criteria versus new alternatives. Structural Equation Modeling: A Multidisciplinary Journal, 6(1), p. 1-55. https://doi.org/10.1080/10705519909540118
Huang, Y., Lan, Y., Bai, Y., 2013. Development of the Chinese construction industry after the Cultural Revolution: administration framework, economic growth, and market structure. Journal of Architectural Engineering, 19(1), p. 41-50. Available at: https://epublications.marquette.edu/civengin_fac/328. https://doi.org/10.1061/(ASCE)AE.1943-5568.0000104
Ingle, P.V. and Mahesh, G., 2020. Construction project performance areas for Indian construction projects. International Journal of Construction Management, 22(1). p. 1-12. https://doi.org/10.1080/15623599.2020.1721177
Johnson, R.B. and Christensen, L., 2014. Educational research: quantitative, qualitative, and mixed Approaches. 5th ed. Thousand Oaks, CA: Sage Publications. Available at: https://www.researchgate.net/publication/264274753_Educational_Research_Quantitative_Qualitative_and_Mixed_Approaches_Fifth_Edition
Joreskog, K.G. and Sorbom, D., 1989. LISREL 7: a guide to the program and applications. Chicago: SPSS, Inc.
Kasabreh, N.S.S. and Tarawneh, S.A., 2019. Investigating the impact of contractor’s performance on the success of Jordanian residential construction projects. International Journal of Construction Management, 21(5), p. 468-475. https://doi.org/10.1080/15623599.2018.1560547
Kerzner, H.R., 2013. Project management: a systems approach to planning, scheduling, and controlling. 11th ed. New York: John Wiley.
Khatatbeh, A.A., 2023. Quantifying the impact of ISO 9001 standard on the project and engineering management and success factors: a case of construction industry. Engineering, Construction and Architectural Management, 30(6), p. 2564-2581. https://doi.org/10.1108/ECAM-07-2021-0656
Kish, L., 1995. Survey sampling. Hoboken: Wiley.
Kline, R.B., 2005. Principles and practice of structural equation modeling. 2nd ed. New York: Guilford Publications.
Leedy, D.P. and Ormrod, E.J., 2018. Practical research: planning and designing. 12th ed. New Jersey: Pearson Education.
Leon, H., Osman, H., Georgy, M. and Elsaid, M., 2018. System dynamics approach for forecasting performance of construction projects. Journal of Management in Engineering, 34(1) 04017049. https://doi.org/10.1061/(ASCE)ME.1943-5479.0000575
Lu, W., Zhang, L. and Pan, J., 2015. Identification and analyses of hidden transaction costs in project dispute resolutions. International Journal of Project Management, 33(3), p. 711-718. https://doi.org/10.1016/j.ijproman.2014.08.009
Mafundu, R.H. and Mafini, C., 2019. Internal constraints to business performance in black-owned small to medium enterprises in the construction industry. South African Journal of Entrepreneurship and Small Business Management, 11(1). https://doi.org/10.4102/sajesbm.v11i1.165
Maylor, H., 2010. Project management. 4th ed. London: Prentice Hall.
Meshram, M., Gitty, R. and Topkar, V.M., 2020. Project performance indicators for measuring construction performance in Mumbai. International Journal of Engineering Research & Technology, 9(06), p. 911-914. https://doi.org/10.17577/IJERTV9IS060635
Millar, M.M. and Dillman, D.A., 2011. Improving response to web and mixed-mode surveys. Public Opinion Quarterly, 75(2), p. 249-269. https://doi.org/10.1093/poq/nfr003
Moradi, S., Ansari, R. and Taherkhan, R., 2022. A systematic analysis of construction performance management: Key performance indicators from 2000 to 2020. Iranian Journal of Science and Technology, Transactions of Civil Engineering Management (IJAIEM), 46, p. 15-31. https://doi.org/10.1007/s40996-021-00626-7
Moser, C.A. and Kalton, G., 2017. Survey methods in social investigation. London: Routledge. https://doi.org/10.4324/9781315241999
Muhammad, S., Makarfi, I.A., Lawal, Y.S., Abubakar, M. and Ishaq, Z.H., 2021. Impact of risk factors on construction projects’ completion cost in Nigeria. LAUTECH Journal of Civil and Environmental Studies, 6(2), p. 75-80. https://doi.org/10.36108/laujoces/1202.60.0270
Naude, M.J. and Chiweshe, N., 2017. A proposed operational risk management framework for small and medium enterprises, South African Journal of Economic and Management Sciences, 20(1). https://doi.org/10.4102/sajems.v20i1.1621
Neyestani, B., 2016. Impact of ISO 9001 certification on the projects’ success of large-scale (AAA) construction firms in Philippines. International Research Journal of Management, IT & Social Sciences, 3(11), p. 39-52. https://doi.org/10.21744/irjmis.v3i11.305
Nicholas, J.M. and Steyn, H., 2017. Project management for business, engineering, and technology: principles and practice. 5th ed. London: Routledge. https://doi.org/10.4324/9781315676319
Nunnally, J.C. and Bernstein, I.H., 1994. Psychometric theory. 3rd ed. New York: McGraw-Hill.
Ofori-Kuragu, J.K., Baiden, B. and Badu, E., 2016. Key performance indicators for project success in Ghanaian contractors. International Journal of Construction Engineering and Management, 5(1), p. 1-10. Available at: https://www.researchgate.net/publication/291808642_Key_Performance_Indicators_for_Project_Success_in_Ghanaian_Contractors
Ofori-Kuragu, J.K., Owusu-Manu, D. and Ayarkwa, J., 2016. The case for the construction industry council, Ghana. Journal of Construction in Developing Countries, 21(2), p. 131-149. https://doi.org/10.21315/jcdc2016.21.2.7
Owoo, N.S. and Lambon-Quayefio, M.P., 2018. The role of the construction sector in Ghana, United Nations University World Institute for Development Economics Research (UNU-WIDER Working Paper 2018/119), Finland. https://doi.org/10.35188/UNU-WIDER/2018/561-9
Oxford Business Group, 2014. Laying the cornerstones: Government expenditure is supporting increased activity. Available at: https://oxfordbusinessgroup.com (Assessed 2 December 2023).
Penzes, B., 2018. Blockchain technology in the construction industry: digital transformation for high productivity. London: Institution of Civil Engineering (ICE).
Pheng, L.S. and Chuan, Q.T., 2006. Environmental factors and work performance of project managers in the construction industry. International Journal of Project Management, 21(1), p. 24-37. https://doi.org/10.1016/j.ijproman.2005.06.001
Project Management Institute (PMI), 2013. A guide to the project management body of knowledge (PMBOK). 5th ed. Newtown Square, PA: Project Management Institute Inc. Available at: https://www.academia.edu/36855830/2013_Project_Management_Institute_A_Guide_to_the_Project_Management_Body_of_Knowledge_PMBOK_Guide_Fifth_Edition_5_PROJECT_SCOPE_MANAGEMENT_5_PROJECT_SCOPE_MANAGEMENT
Project Management Institute (PMI), 2017. A guide to project management body of knowledge: PMBoK Guide. 6th ed. Newtown Square, PA: Project Management Institute Inc. Available at: https://www.scirp.org/reference/referencespapers?referenceid=3400843
Renault, B.Y., Agumba, J.N., and Ansary, N., 2020. Underlying structures of risk response measures among small and medium contractors in South Africa. Construction Economics and Building, 20(1), p. 1-16. https://doi.org/10.5130/AJCEB.v20i1.6721
Ruel, E., Wagner, W.E. and Gillespie, B.J., 2016. The practice of survey research. Theory and applications. SAGE Publications. https://doi.org/10.4135/9781483391700
Saunders, M.N.K., Lewis, P. and Thornhill, A., 2019. Research methods for business students. 8th ed. Harlow, UK: Pearson Education Limited.
Serrador, P. and Turner, J.R., 2015. The relationship between project success and project efficiency. Project Management Journal, 46(1), p. 30-39. https://doi.org/10.1002/pmj.21468
Shenhar, A.J., Dvir, D., Levy, O. and Maltz, A.C., 2001. Project success: a multidimensional strategic concept. Long Range Planning, 34(6), p. 699-725. https://doi.org/10.1016/S0024-6301(01)00097-8
Sullivan, M., 2011. Fundamentals of Statistics (Sullivan Statistics Series). 3rd ed. New York: Pearson Education Inc.
Sun, K.S., 2011. The turnover intentions for construction engineers. Journal of Marine Science and Technology, 19(5), p. 550-556. https://doi.org/10.51400/2709-6998.2169
Tayeh, B.A., Durdyev, S., Abuzuhri, I.O., Hosseini, M.R. and Thurnell, D., 2019. Contractors’ attitudes towards the factors affecting sustainability performance: evidence from Palestine. Business Strategy & Development, 2(3), p. 173-179. https://doi.org/10.1002/bsd2.51
Teller, J., Kock, A. and Gemünden, H.G., 2014. Risk management in project portfolios is more than managing project risks: a contingency perspective on risk management. Project Management Journal, 45(4), p. 67-80. https://doi.org/10.1002/pmj.21431
Toor, S.U.R. and Ogunlana, S.O., 2010. Beyond the ‘iron triangle’: Stakeholder perception of key performance indicators (KPIs) for large-scale public sector development projects. International Journal of Project Management, 28(3), p. 228-236. https://doi.org/10.1016/j.ijproman.2009.05.005
Tripathi, K.K., Hasan, A. and Neeraj Jha, K., 2019. Evaluating performance of construction organizations using fuzzy preference relation technique. International Journal of Construction Management, 21(12), p. 1287-1300. https://doi.org/10.1080/15623599.2019.1613210
Uddin, S. M. J., Albert, A., Pradhananga, N., Ganapati, N. E., Prajapati, J., 2023. Health and Safety Challenges Among Post Disaster Reconstruction Workers. Construction Economics and Building, 23:1/2, p. 4-30. https://doi.org/10.5130/AJCEB.v23i1/2.8441
Wang, J. and Yuan, H., 2011. Factors affecting contractors’ risk attitudes in construction projects: Case study from China. International Journal of Project Management, 29(2), p. 209-219. https://doi.org/10.1016/j.ijproman.2010.02.006
Wu, Z., Nisar, T., Kapletia, D. and Prabhakar, G., 2017. Risk factors for project success in the Chinese construction industry. Journal of Manufacturing Technology Management, 28(7), p. 850-866. https://doi.org/10.1108/JMTM-02-2017-0027
Yirenkyi-Fianko, A.B. and Chileshe, N., 2015. An analysis of risk administration in practice: The situation of Ghana’s building and construction industry. Journal of Engineering, Design and Technology, 13(2), p. 240-259. https://doi.org/10.1108/JEDT-04-2012-0021