Construction Economics and Building
Vol. 23, No. 3/4
December 2023
RESEARCH ARTICLE
Analysing the Influence of Organizational Culture in Projects using Last Planner System
Jugal Pancholi*, Ganesh Devkar
Faculty of Technology, CEPT University, Kasturbhai Lalbhai Campus, University Road, Navrangpura, Ahmedabad-380009, India
Corresponding author: Jugal Pancholi, Faculty of Technology, CEPT University, Kasturbhai Lalbhai Campus, University Road, Navrangpura, Ahmedabad-380009, India, jugal.pancholi@gmail.com
DOI: https://doi.org/10.5130/AJCEB.v23i3/4.8804
Article History: Received 09/09/2023; Revised 02/10/2023; Accepted 27/10/2023; Published 23/12/2023
Abstract
The use of lean tools and techniques to reduce waste from the workflow has been prominently gaining popularity in the construction industry worldwide. Last Planner System (LPS) is one such distinguished tool used by construction majors. Much research suggests that LPS plays a significant role in improving collaboration among project team members and the firm’s organizational culture. This paper reports the intermediating effect of organizational culture on construction projects that implement the Last Planner System and also identifies the effect of LPS on the project’s operational performance. Various survey items pertaining to each variable were identified and validated through Content Validation. All the established items were then compiled into a questionnaire, and multiple data were collected from a variety of projects. The data were analysed using bivariate correlation and multiple regression analysis. Additionally, the “organizational culture assessment instrument” was utilized to compare the organizational cultures of various construction sites. It was discovered that the Last Planner System had a positive but negligible relationship with the operational performance of the project, and the organizational culture. It was observed that all the projects implementing LPS had a balance culture. The contribution of this work is the knowledge that implementation of the Last Planner System is not necessarily enhanced by culture to a great extent. However, it has a positive impact on both the operational performance of the project and the organizational culture.
Keywords
Last Planner System; Organizational Culture; Operational Performance; Content Validity; Competing Values Framework
Introduction
Modern projects in the construction sector have become complex, uncertain, and time-constrained due to advancements in technology, rising client demands, and the overall market scenario (Koskela et al., 2002). The number of stakeholders in any construction project has significantly increased because of the complexity and the pressures of completing projects faster than before. This has resulted in difficulties in the management of all stakeholders and coordination of their activities (Lühr, Bosch-Rekveldt and Radujkovik, 2021). Lean production systems are a promising solution to the management of complexities associated with planning, designing, construction and operation of the construction projects and are expected to help meet customer expectations, increase productivity, and minimize waste (Howell and Ballard, 1997).
Among the many lean tools available, the Last Planner System (LPS) is best suited for improving collaboration among project teams. It is largely used for production planning and control. Processes like phase scheduling, look ahead scheduling and weekly work plans are part of the Last Planner System. These LPS processes promote teamwork, dedication, and efficient workflow reliability in production planning and management (Ballard, 2000).
Many research studies have proven LPS to be one of the most prominent production planning and control techniques. Alsehaimi, Tsortzopoulos and Koskela (2009) have reported that LPS is a useful tool for management and ongoing evaluation of the effectiveness of the planning of a building project. Ballard and Howell (2004) added that the Last Planner System and all lean thinking processes are most immediately applicable to highly dynamic projects that are defined as uncertain, complicated, and quick. Porwal, Lavy and Rybkowski (2010) noted that LPS has grown to be a well-liked tool in the lean construction community for securing workflow and guaranteeing the accuracy of plans.
A great number of existing studies illustrate the effect of LPS on project culture; In their study, Luhr, Bosch-Rekveldt and Radujkovic (2021) discovered that LPS promotes greater degrees of mutual understanding and control over the responsibilities and problems of the other parties. Over the past several years, a number of papers discussing the application of LPS on different projects have also been published (Kalyan, Pratap and Singh, 2018; Ravi et al., 2018). When implementing LPS, organizations’ main objectives are to (i) improve process reliability and (ii) reduce uncertainty. The importance of organisational culture in achieving improvement through the adoption of lean principles has drawn a lot of attention in these studies (Hardcopf, Liu and Shah, 2021). The potential benefits of lean tools at the project level have also been the subject of multiple research (Ebbs et al., 2017; Formoso and Moura, 2009). However, these studies have investigated the effect of lean tools in combination with more than one tool in a given setting like a construction project. The Indian construction sector has paid close attention to the Last Planner System’s rising popularity and efficiency. However, due to the lack of standardization in LPS and the variety of approaches used in practice, the anticipated results of improved project outcomes are frequently not realized, leading to many firms choosing traditional project planning and control methodologies over LPS. The dearth of research in this area and the demand for increased public awareness regarding the use of LPS in industry, support the need for this investigation. The gaps in understanding provide the incentive for determining the relationship between LPS implementation and project organizational culture and operational performance. Additionally, studies conducted by Lühr, Bosch-Rekveldt and Radujkovic (2021) and Ravi et al. (2018) emphasize the influence of an organization’s culture on LPS implementation efforts. However, it talks to a limited extent about the partnering culture (i.e., a culture that has high level of trust and mutual understanding within the organization), and few other aspects of LPS implementation (i.e., case study analysis with competing values framework). Therefore, there is uncertainty regarding whether LPS needs a supportive organizational culture in order to improve project performance.
The structure of this paper is as follows: First, a thorough literature review is presented to assess existing research; its primary goal is to pinpoint the areas that require additional research in this field of study. The research approach used for the study is described next. A case study analysis is then presented, followed by a description of the process of identifying measures for LPS production planning, control and operational performance of the project. Finally, the investigation is discussed, where the hypothesis is tested through various quantitative methods, and finally, the conclusion, limitation, and future scope of the study are presented.
Literature Review
Lean Construction
Lean Construction Institute (2019) defines lean as “A culture of respect and continuous improvement to create more value for the customer while identifying and eliminating waste.” Lean Construction is known to have originated with the Toyota Production Unit’s lean production system that was created for their production management. The Toyota Production System gained traction in the AEC industry as construction projects became more complicated and uncertain (Koskela et al., 2002; Howell, 1999). Lean construction must have a clear set of delivery process objectives targeted at maximizing performance for the customer at the project level. Also, the application of production control throughout the life of the product from design to delivery (Howell and Ballard, 1997).
Last Planner System
Workflow uncertainty or unpredictability has been identified as a factor in the failure of building projects. The Last Planner approach, according to Ballard (2000), “Is a way of converting what SHOULD be done into what CAN be done, resulting in a ready-to-work inventory from which Weekly Work Plans can be produced.”. The Last Planner system was thought to be able to fill a gap in the standard project management toolkit, which is to formalize the planning and the phase scheduling by developing a logic network and reexamine the schedule for application of resources and methods (Ballard and Howell, 2004). According to Daniel, Pasquire and Dickens (2015), there are five critical principles of LPS vis., (i) ensure that the tasks are planned in detail before the task execution approaches, (ii) ensure that the tasks are planned in the presence of the people who have to execute it, (iii) identify and remove the constraints for all planned tasks before their execution, (iv) ensure commitments made are reliable and (v) continuous improvement.
The Last Planner System offers an efficient way to work together on project-based production, allowing problems to be found and handled before they arise on-site and improving the possibility of a workflow; so that the projects are completed on time (Mossman, 2015). Pull scheduling, which places focus on work that can be finished, is a component of LPS. The traditional method emphasizes “push scheduling,” in which, the job that must be finished following the master timetable is highlighted.
The concept of continuous improvement measuring the project’s progress differentiates LPS from the traditional approach. LPS is made of 5 components as follows:
1. Master Schedule: The master schedule is prepared by the project manager before starting the project. It includes overviews of all the main activities and highlights the project’s milestones.
2. Phase Schedule: Here, the emphasis is given to the ‘pull scheduling,’ Based on the project’s current phase and decided milestones, a phased schedule of about 3-6 months is prepared.
3. Look Ahead Plan: It is a short-term (5-9 weeks) plan developed before the commencement of the planned activities. All the constraints present in the planned activities are identified and resolved before it becomes a problem. It is also known as make ready plan.
4. Weekly Work Plan: It is planning that is carried out by the last planners (i.e., foreman, supervisor, etc.) who are going to execute the work. The commitment to work for the upcoming week is taken through them.
5. Percent Plan Complete (PPC) and Examination of reasons for non-completion (RNC): Based on the progress tracking of the previous week, the workflow reliability and commitments are planned for the coming weeks. All non-completed tasks are assessed, and improvements in the project plan are incorporated by learning from failure. Percent Plan Complete (PPC) is a tool for determining the non-compliance rate. It is calculated by dividing completed assignments by planned assignments. (Koskela, Stratton and Koskenvesa, 2010).
Measures of LPS
LPS is commonly viewed incorrectly as a standalone instrument that may be employed whenever necessary (Hamzeh and Bergstrom, 2010). Despite LPS’ benefits, many businesses find it extremely difficult to implement it. The main issue organizations encounter, aside from execution, is the evaluation of the system itself. Although there are many different ways to measure LPS, some important indicators include (i) Percent Plan Complete, (ii) Look Ahead Planning, and (iii) Weekly Work Plan.
The control of the production unit is generally performed through weekly work planning (WWP). The main way to manage the workflow is the lookahead method. All participants must come together to build a look-ahead plan and review any commitment failures (reasons for non-completion) in order to prevent them from happening again and to ensure continuous improvements in the process, as described by Bhatla and Leite (2012). Seppänen, Modrich and Ballard (2015) suggested the implementation of the lookahead plan and the weekly planning as a production control mechanism. Tayeh et al. (2018) have also found that the inclusion of PPC, look ahead plan, and weekly work plan are some of the crucial instruments for gauging the success of an LPS implementation.
According to Hamzeh and Aridi (2020), some of the critical measures for the success of LPS implementation are; (i) Percent Plan Complete (PPC), (ii) Task Anticipated (TA), and (iii) Tasks Make Ready (TMR). In construction projects, various metrics are used to track and measure progress to aid planners in making critical decisions about time and cost savings (Hamzeh et al., 2020).
Research by Daniel, Pasquire and Dickens (2019) suggests that the inclusion of LPS practice in a contract clause, provision of training, and many other parameters can support the implementation of LPS in a construction project.
LPS and Operational Performance
(Hardcopf, Liu and Shah, 2021) emphasized in their study the beneficial impact of lean approaches on the operational performance of the projects based on the majority of the lean evaluation studies. However, several researchers have also found that using limited lean techniques can improve operational performance. Therefore, the link between LPS and operational performance has been the subject of considerable investigation. Considering the complexity of construction projects, it is essential to select the best management strategy that will contribute to the project’s success, carefully coordinate and oversee the entire process, and guarantee that the project is finished on time and within budget, continuous-time and cost monitoring is required because of this. A regular schedule and financial variations must be monitored to prevent developing disorder in anticipated and budgeted time and expenditure.
LPS was created to improve planning and control effectiveness by increasing the likelihood of on-time delivery and making programs more predictable (Ballard, 2000). Numerous case study-based researchers have indicated a range of advantages brought about by LPS deployment.
Ahiakwo et al. (2013) stated that they could complete the project on time, with a 30% cost savings and 80% PPC on the project, planned, managed, and controlled using LPS. At the same time, the three other case studies in which LPS was not implemented had a time overrun.
A survey of around 26 case studies carried out by Fernandez-solis et al. (2013) showed that LPS is very effective in obtaining the following benefits; (i) Improved Communication, (ii) Improvement in quality of work practices, (iii) Reduced production time, and (iv) Greater collaboration.
It is argued that LPS might enhance production planning through social processes. It offers numerous advantages to projects using LPS. Instead of examining the impact of LPS processes on operational performance, the available research mostly concentrates on measures to assess how well LPS processes are working using different LPS measures. Given the wealth of information available in literature about lean and its applicability to the project’s operational performance, it is observed that there still exists a gap between applicability of LPS and its effect on the operational performance. Hence, the following statement is proposed as an assumption:
Hypothesis 1. (H1) – Implementation of the last planner system aids on enhancing the project’s operational performance.
LPS and Organizational Culture
An organization’s culture is one of several factors that affect how well lean tools are implemented. Organizational culture has a significant impact on the effectiveness of lean transformation (Fadnavis, Najarzadeh and Badurdeen, 2020). Therefore, it is crucial to understand the organizational culture, including how it relates to or facilitates the use of lean approaches, particularly LPS. An organization’s culture, according to Kallassy and Hamzeh (2021), is a set of common ideals and presumptions held by its members. It has many different aspects that are expressed in its leadership, working methods, and communication. A collaborative culture that differs from the standard culture of building projects, is necessary for the successful implementation of LPS (Lühr and Bosch-Rekveldt, 2019). A case study based on the UK building project by Johansen and Porter (2000) states that there is a need to overcome cultural barriers to achieve the promised effectiveness of LPS.
Frameworks of many kinds have been developed to evaluate organizational culture. Studies are being carried out to create appropriate assessment based on many characteristics and goals. Because organizational culture is a latent variable that cannot be measured, it is examined using qualitative frameworks. One of the most popular frameworks for evaluating organizational culture was created by Cameron and Quinn (2006) and is called the Competing Values Framework (CVF). Clan, adhocracy, market, and hierarchy make up the four quadrants of the competing values framework. An organizational culture assessment instrument (OCAI) is used to evaluate and quantify each of these four cultural quadrants. The above-mentioned quadrants are used to create a spider web that helps determine the type of culture that an organization or project adheres to (Cameron and Quinn, 2006; Lühr and Bosch-Rekveldt, 2019). Apart from this Hofstede (2011), also proposed a framework for cultural assessment which is known as “Hofstede” framework. It uses, six cultural dimensions—power distance, uncertainty avoidance, individualism, masculinity, long-term orientation, and indulgence, for the evaluation of culture.
This research offers the following hypothesis in accordance with the literature that indicates the essential role played by organizational culture on the effectiveness of LPS and the scant data in this direction.
Hypothesis 2. (H2) - An organizational culture will moderate the effect of LPS on operational performance.
Research Methodology
A mixed-methods approach combining qualitative and quantitative techniques was adopted for this work. First, a review of the available literature was conducted, the need for the study was established, and the research topic was chosen. Data from both qualitative and quantitative methods were collected. Numerous case studies were identified, and semi-structured interviews (qualitative) and questionnaires surveys (quantitative) were conducted.
Measures for LPS Production Planning and Control and Operational Performance
After the formulation of the study hypothesis, based on the extensive literature review, the first step of this research study involved identification of measures for the LPS production planning and control, and operational performance of the projects. With the conduct systematic searching process with keywords: last planner system, organizational culture, lean construction, and operational performance, three measures for the project’s operational performance and seven measures for LPS production planning and control were identified. Concise definitions of the measures and terms used in this work were identified in literature and are listed below.
(Table 1) shows the detail of those measures.
| Measures | (Ahiakwo et al., 2013) | (Alsehaimi, Tsortzopoulos and Koskela, 2009) | (Ballard, 1997) | (Ballard, 2000) | (Ballard and Tommelein, 2016) | (Bortolazza and Formoso, 2006) | (Castillo et al., 2018) | (Daniel, Pasquire and Dicken, 2015) | (Daniel, Pasquire and Dickens, 2019) | (Fernandez-Solis, et al., 2013) | (Formoso and Moura, 2009) | (Hackett, Harte and Chendo, 2019) | (Hamzeh and Aridi, 2020) | (Hamzeh, et. al., 2015) | (Hamzeh et al., 2020) | (Johansen and Porter, 2000) | (Mossman, 2015) | (Priven and Sacks, 2013) | (El Samad, Hamzeh and Emdanat, 2017) |
|---|---|---|---|---|---|---|---|---|---|---|---|---|---|---|---|---|---|---|---|
| LPS Production | |||||||||||||||||||
| Percent Plan Complete (PPC) | X | X | X | X | X | X | X | X | X | X | X | X | X | X | X | ||||
| Look Ahead Plan (LAP) | X | X | X | X | X | X | X | X | X | X | |||||||||
| Reasons for Non-Completion (RNC) | X | X | X | X | X | X | X | X | |||||||||||
| Weekly Work Plan (WWP) | X | X | X | X | X | X | X | ||||||||||||
| Tasks Anticipated (TA) | X | X | X | X | X | ||||||||||||||
| Tasks Make Ready (TMR) | X | X | X | X | X | ||||||||||||||
| Training | X | X | X | ||||||||||||||||
| Operational Performances | |||||||||||||||||||
| Cost | X | X | X | X | |||||||||||||||
| Time | X | X | X | X | |||||||||||||||
| Quality | X | ||||||||||||||||||
The identified measures are widely discussed in the literature from different perspective. Hence. It was necessary to define these terms clearly for the purpose of this study. Based on the literature review, these seven measures are defined as follows:
1. Percent Plan Complete (PPC): The percentage of tasks done after a specified period compared to those promised to be finished at the end (Ballard, 2000; Hamzeh, et. al., 2015; Daniel, Pasquire and Dickens, 2019).
2. Look Ahead Plan (LAP): Make work ready so that the ‘workflows are in sequence and at the rate needed to complete the project within the available time (Ballard, 2000; Hamzeh, et.al., 2015; Daniel, Pasquire and Dickens, 2019).
3. Reasons for Non-Completion (RNC): The causes for the non-completion of the tasks (Ballard, 2000; Daniel, Pasquire and Dickens, 2019).
4. Weekly Work Plan (WWP): All activities committed to being done during the given week are represented (Hamzeh, et.al., 2015).
5. Tasks Anticipated (TA): To assess how well the lookahead planning process performs in anticipating tasks that will occur (Hamzeh, et.al., 2015).
6. Tasks Make Ready (TMR): The number of tasks on the lookahead plan that had all of their constraints eliminated two weeks before execution (Hamzeh, et.al., 2015).
7. Training: Organize learning sessions to educate the project team on LPS.
Each measure mentioned in Table 1 was considered as a first-order factor. Based on the literature review, detailed survey items for each measure were developed. In total, 27 survey items were developed for seven LPS production planning and control measures while 6 survey items were identified for three operational performance measures.
All survey items were identified using the same sources as those listed in (Table 1). Some of the questionnaire’s questions were created using conceptual knowledge of the subject and expert advice.
Measures of Content Validation
A content validity questionnaire was created after the measures and specific survey items were determined. The degree of relevance for each survey topic was determined using a conventional 4-point scale of content validation.
Based on the research work of Saiful and Yusoff, 2019, at least six specialists are needed for content validation. The experts for this content validation process were identified based on conducting review of conference and journal publications which focus on LPS. The questionnaire was designed with MS word software and sent to the experts. This questionnaire began with the background of the study and subsequently justified the need for validation. The research was briefly explained to support the need for this validation. Twelve subject matter experts from various organizations and institutions were given the questionnaire. Of the 12 experts, one was a Ph.D. scholar, two experts were academicians from India with experience of more than 20 years, and nine were lean practitioners from India, who had participated in numerous projects utilizing LPS.
Results of First Round of Content Validation
Six replies were gathered for the first round of content validation following routine follow-ups. Each item’s individual content validity index (I-CVI) was computed. The total average of the items was also used to create the scale level content validity index (S-CVI/AVE i.e., Average of S-CVI). The universal agreement of each item was evaluated, and an S-CVI/UA was computed (Amos and Boakye-Agyeman, 2022).
The rating that was given by the experts was transformed into a binary scale to assess their responses. If the degree of relevance was given a score of 3-4, it was to be regarded as 1, whereas a score of 1-2 was to be regarded as 0. The total of all the experts who gave a particular item a score of 3-4, which is known as expert agreement, was first calculated. The expert agreement value was divided by the number of experts who replied to the questionnaire to produce the I-CVI value. The universal consensus was also represented by binary numbers; if all the experts agreed that an item was relevant between 3 and 4, a score of 1 was given. The UA score was zero if any expert did not consider the item relevant to the degree of 3–4. S-CVI/AVE and S-CVI/UA were ultimately determined by dividing the total number of survey items by the sum of the I-CVI and UA values, respectively.
Saiful and Yusoff, 2019 discussed a correlation between the number of experts and the allowable CVI values. The correlation is as follows: (i) 2 experts, at least 0.80 CVI, (ii) 3-5 experts, should be 1 CVI, (iii) at least 6 experts, at least 0.83 CVI, (iv) 6-8 experts, at least 0.83 CVI and (v) at least 9 experts, at least 0.78 CVI. As in this instance, where replies from six experts were gathered, a CVI score of at least 0.83 was considered acceptable. Six items were found to have values lower than 0.83. Experts’ comments were sought on these six items and subsequently, all three of the items from the LPS production planning and control survey with values of 0.50 were eliminated, while three other items with values of 0.67 were modified. Refer Table 2.
Refer Appendix A for detailed table depicting the list of survey items. Out of a total of 27 survey items of LPS production planning and control were identified for round one of content validations, while three items highlighted in the above table were eliminated.
The component that had an I-CVI value of 0.67, was included in the cost measure (enhanced cycle time). Few experts, however, proposed removing the item because it was comparable to other items already present. Only one item on the operational performance list had a CVI score less than 0.83, so it was removed from consideration.
Additionally, a couple of the professionals offered recommendations to expand the list with a few additional pertinent items. Consequently, a new planning process measure was introduced, and two survey items were added. The following are the measure and the items that were added based on the advice provided by the experts:
LPS Production Planning and Control
Measure 8: Planning Process (PP)
PP 1: Our crew is trained in the concept implementation of LPS.
PP 2: All the participants share their inputs during the training sessions.
Operational Performance
Measure 4: Safety
Safe 1: Improved Safety
Appendix B highlights the final list of measures for both LPS Production Planning and Control and Operational Performance.
Outcome of Content Validity
Nearly a majority of survey items’ CVI values for both variables fell within the permitted range (i.e., at least 0.83). The results of round-1 of the content validity are as attached in Appendix C. A second and final round of content validity was undertaken after some of the items were modified, added, or removed.
A questionnaire was created based on this final list, and the same experts were requested once more to respond to the final questionnaire. In the last stage of content validity, an additional clarity scale was also included. Both relevance and clarity were rated on a four-point scale.
The CVI results for the last round were also similarly evaluated. The binary scale was applied to each response. Relevancy and clarity I-CVI scores were computed individually. The S-CVI/Ave was also calculated using the following variables. Most of the items were found to have a CVI value of 1.00. Thus, the final set of survey items was established. Further, the data collection was carried out with it.
Case Study Analysis
Most of the information was gathered using questionnaire surveys from various construction projects. A detailed data collection process is discussed in this section.
Identification of Potential Sites
Further, to the content validation of measures and survey items related to LPS Production Planning and Control and Operational Performance, the next step in this research study involved identification of potential case study sites to investigate the earlier mentioned hypothesis. The case studies were selected as a stratified sample (Flyvbjerg, 2006) by the following criteria:
1. Longer history of LPS implementation in an organization
2. Status of construction project and LPS adoption
3. Scale of the Project
4. Participants association with the Project
Criteria 1 was set to ensure selection of a construction contractor adopting LPS in project delivery for many years. LPS has gained popularity among construction contractors in India. However, there is a diversity in operationalization of LPS processes. Hence, the construction companies having a large history of LPS implementation have a more structured approach to LPS implementation.
Criteria 2 was defined to ensure that one case study project is fully implementing LPS. This criterion was set because the projects where LPS is implemented partially may not have substantial influence on the project operational performance.
Criteria 3 was set to ensure that the cases are comparable. All selected cases are at the same construction phase and project cost was more than USD 12.10 million.
Criteria 4 was defined to ensure that the participants were representative for providing feedback on relevant measures related to survey items. With reference to the Hypothesis 1 and 2, there are three different aspects that needs to be analysed: (i) LPS Production Planning and Control, (ii) Operational Performance of Project, and (iii) Organizational Culture.
After identification of potential construction contractors and projects, the senior officials from these organizations and selected projects were briefed about the need for this research study and data collection process that would be carried out. Approval was taken from each of construction contractor associated with the project for commencing the process and their responses were used for analysis.
Three questionnaires were designed focusing on each of these aspects:
Questionnaire 1: Focusing on LPS Production Planning and Control measures was filled out by the participants of LPS meetings. It includes representative of main contractors, subcontractors, and last planners (i.e., foreman and supervisors).
Questionnaire 2 and 3: Focusing on Operational measures and Organizational Culture was completed by the main contractors’ project team members of selected case studies. Criteria 4 ensured that these respondents are appropriate for respective questionnaires. The content validation of survey items in Questionnaire 1 and 2 is discussed in detail in earlier sections while the competing values framework (CVF) formed the basis for Questionnaire 3.
In total, four case studies were selected. From each project, about five project members participated in the LPS Production Planning and Control survey. In a similar manner, about 5 responses were collected for operational performance and organizational culture questionnaire survey each.
Preparation of Questionnaire
A brief description of the research project was provided at the outset of each questionnaire and a confidentiality declaration was added. All surveys had many sections, the first two of which were of descriptive type. In the first portion, questions pertaining to personal information and respondent history were posed. This portion included information request about the respondent’s name, organization name, designation, and overall work experience, among other things. This part also included questions that were unique to their knowledge of LPS and Lean implementation. Project-specific questions like (i) Project Name, (ii) Current Status of the Project, (iii) Location of the Project, and (iv) Type of Project were included in the second section of the questionnaire. In this part, questions about the project’s duration and cost were also included. Each questionnaire’s topic-specific question was derived from the third part.
Questionnaire: 1 LPS Production Planning and Control
Eight measures totalling 26 survey items that were relevant to the last planner system for production planning and control were included in this questionnaire. A definition of each measure was provided in the questionnaire. A 7-point Likert scale was used to rate the responses. To determine the level of agreement for the specific survey item, the responses were gathered.
The rating scale used for the questionnaire is as follows: 7= Strongly agree, 6= Agree, 5= Somewhat agree, 4= Neither agree nor disagree, 3= Somewhat disagree, 2= Disagree, 1= Strongly disagree.
Questionnaire: 2 Operational Performance of the Project
Four measures having a total of six survey items pertaining to the project’s operational performance were included in this questionnaire. Each survey item was scored on a 5-point Likert scale. The responses were collected concerning the degree of improvement towards the particular survey item. All the items were told to be answered concerning their ongoing observation on a construction project where LPS is implemented. The rating scale used for the questionnaire is as follows: 5= Much better, 4= Better, 3= About the same, 2= Worse, 1= Much Worse.
Questionnaire: 3 Organizational Culture
This study aims to investigate the influence of organizational culture in realizing operational improvement at project level from the adoption of Last Planner System (LPS). The Competing Values Framework (CVF) comprising four quadrants namely Clan, Adhocracy, Hierarchy, and Market that has been widely used to assess organizational culture, was utilized in this study (Cameron and Quinn, 2006). Therefore, all questions in the six-item OCAI version were divided into four distinct cultures. The same 7-point Likert scale that was employed in the LPS production planning and control questionnaire was utilized to collect the responses.
According to the OCAI six-item version, a new questionnaire was created, and the answers were recorded according to the importance of each culture. The organization that applied LPS was represented by a spider web graph created from the survey data. Additionally, the organizational cultures were compared to the Theoretical Ideal Lean Culture (TILC) and Lean Culture produced by Paro and Gerolamo in 2015 and 2017.
Collection of Responses
All questionnaires were mailed to the identified respondents in each case study project where weekly meetings, consistent PPC monitoring, and lookahead planning were practiced. The types of projects and their durations varied, and they were all unique.
The first project (Case – 1) was the redevelopment project of a stadium into a multi-purpose sports complex (infrastructural) with a construction area of around 47,600 sqm. The government awarded the contract to one of the leading construction companies in India. The construction period for this project is 2 years, followed by maintenance of 5 years. At the time of the survey, the project was on the verge of the execution phase. The participating stakeholders at the regular LPS meetings were the Program Managing Company (PgMC), contractor, specialist planners, and sub-contractors. Five people from this group participated in the survey of all three variables (i.e., LPS Production Planning and Control, Organizational Culture, and Operational Performance).
Case – 2 is a hospital building (commercial) construction project in the execution stage at the time of the survey. The developer (client), multiple specialized planners, general contractors, and various additional subcontractors were present at LPS meetings. One of the renowned construction companies in India carried out the project, and the LPS was implemented at the project right from the start of the execution phase. The questionnaires received responses from five project participants who attended the LPS meetings.
Case – 3 is a construction project which was in the execution phase. A medical college (institutional) with supporting facilities was going to be built. Project managers, planning engineers, other senior members of the main contractor’s team, and foremen from different subcontractors attended the LPS meetings. Six members of this group completed the questionnaires distributed for this study.
Case – 4 is a construction project which was also in the execution phase. It was a construction project for a railway coach factory (industrial) with a construction period of 2 years. The LPS participants in this project were a planning engineer, an assistant manager, various foremen, and junior engineers. Three members of this group participated in the survey.
All the respondents were experienced and had been working on LPS for several years. In total 57 (i.e., 19+19+19) responses were collected from four case study projects from varied sectors as mentioned above. The specifics of this questionnaire responses based on type of questionnaire is shown in Table 3.
Further, the data was analysed, and the above-mentioned hypotheses were tested to identify the relationship.
Methods
SPSS software was used to analyse the data and evaluate the hypotheses using a number of statistical tests. The outcomes of each variable’s data analysis are highlighted in this section.
Results
LPS and Operational Performance
According to Hypothesis 1 (H1), the operational performance of the project correlated with LPS implementation. A bivariate correlation was carried out for the responses received for each survey item of the different measures of both the variables to test this hypothesis. The correlation coefficient was derived with a confidence level of 95.
| Variable | Variable2 | Statistic | ||||
|---|---|---|---|---|---|---|
| Correlation | Count | Lower C.I. | Upper C.I. | Notes | ||
| LPS | OP | .043 | 19 | -.395 | .488 | |
(Table 4) shows the correlation between LPS production planning and control and the project’s operational performance. The correlation value that equals 0.043, shows that there is a small link between the two variables. As a result, with regard to the proposed hypothesis, there is a minimal yet positive correlation between LPS implementation and project operational performance.
Influence of Organizational Culture
Hypothesis 2 (H2) posits that organizational culture moderates the effect of LPS on operational performance. Therefore, the hypothesis and model were tested along with the moderating effect of organizational culture on the LPS implementation and operational performance. For this reason, multiple regression was used for analysing the data in this study. LPS Production planning and control were considered as independent variables, while operational performance was the dependent variable and organizational culture within the company was a moderating factor.
(Table 5) shows a model summary of the multiple regression analysis. The calculated R-value was 0.043, indicating a slight but favourable effect of organizational culture on LPS Production Planning and Control and the projects operational performance. Although, the main effect of organizational culture towards LPS and operational performance is not that significant, the positive correlation supports Hypothesis 2.
Organizational Culture Assessment
The researchers used the “Organisational Culture Assessment Instrument” (OCAI) to assess the robustness of their findings by measuring the organisational culture of the chosen case studies; understanding how the staff who are directly involved in the LPS implementation process perceive things.
As mentioned earlier, an OCAI is used in CVF to measure the organizational culture, and Lühr, Bosch-Rekveldt and Radujkovic, 2021 also adopted the same for assessing the project culture. In the same vein, this study examines two construction projects using the four unique cultures listed in CVF: (i) Clan, (ii) Adhocracy, (iii) Market, and (iv) Hierarchy. Due to the limitation of data, the OCAI framework was implemented only on two construction projects of the same organization. Figure 1 highlights three different combinations of cultures. The “Theoretical Ideal Lean Culture,” which was created using the data from 14 Toyota Way Principles, is the one that is indicated in the orange dotted line. The “Brazilian Lean Culture” was created by Paro and Gerolamo (2017), who studied 51 Brazilian Lean systems. It is represented as the grey dashed line. At the same time, the shape highlighted in green is the “German Lean Culture,” which is taken from three case studies conducted on the German construction industry by (Lühr and Bosch-Rekveldt, 2019).
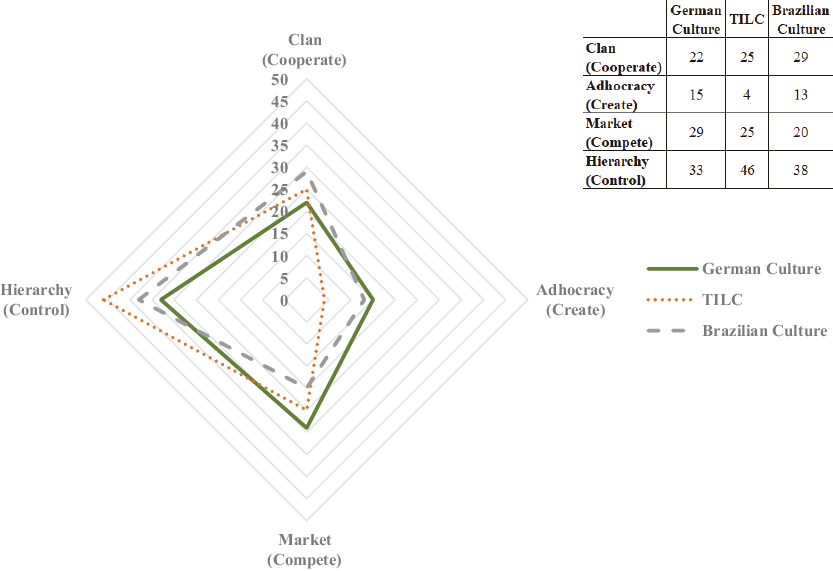
Figure 1. Theoretical Ideal Lean Culture, Brazilian Culture, and German Culture
The replies gathered for each project were then compared to these three varied cultural sets. The same organization’s OCAI was utilized for two separate projects. Many responses that can help justify the analyses based on the previous studies were obtained for those projects.
Project-1
The first project involved a medical college and auxiliary services that are being built in a southern Indian state as part of an institutional building project. The project was in the execution stage at the time of the survey. The Project Manager, Planning Manager, DGM Billing, and Assistant Planning Engineer were among the staff who replied to the survey. The outcome of the survey is shown in (Figure 2).
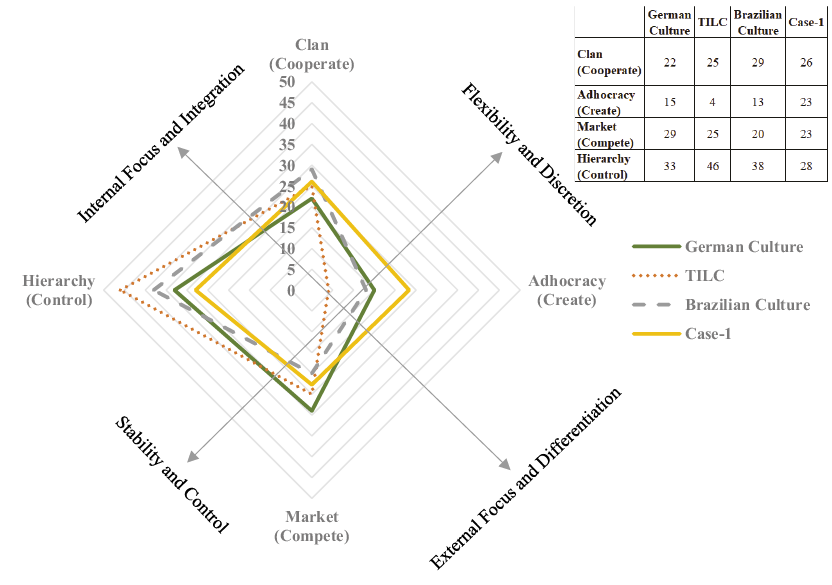
Figure 2. Organizational Culture at Project-1
As seen in (Figure 2), the hierarchy culture was highly ranked but with a minimal margin. Additionally, the adhocracy culture was more prominent than the German, Theoretical Ideal, and Brazilian cultures. The market culture, however, was marginally superior to the Brazilian culture, while the clan culture was marginally superior to the German and Theoretical Ideal cultures. Overall, the project fairly represents each type of culture. Therefore, regardless of the previous three sets of cultures, it may be concluded that the project had a balanced project culture.
Project-2
The second project was a commercial site that involved building a hospital in a southern Indian state. Like the earlier project, this was also in the execution stage as the survey was being carried out. The project’s (i) Deputy General Manager, (ii) Planning Engineer, (iii) Senior Engineer, and (iv) Safety Executive were among the staff who answered the survey. The outcome of the survey is shown in (Figure 3).
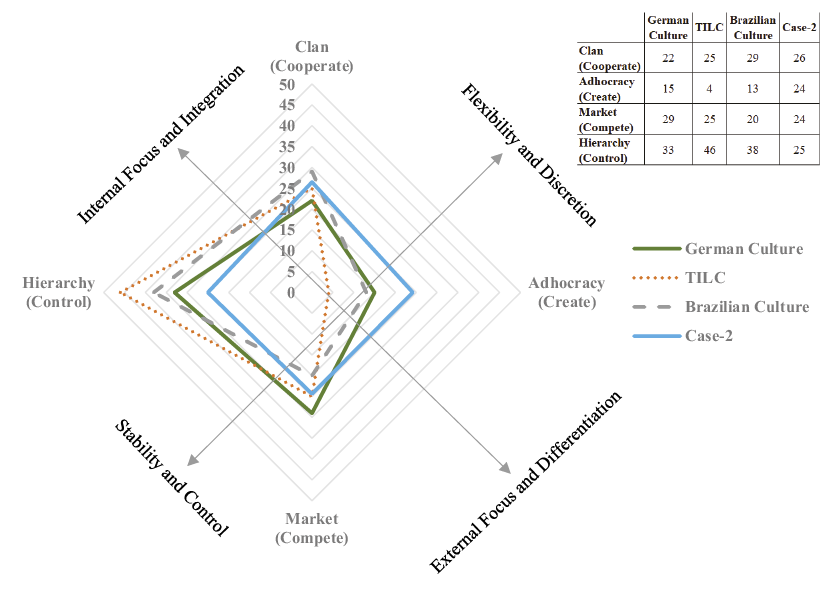
Figure 3. Organizational Culture at Project-2
As shown in (Figure 3), the clan culture was highly ranked but with a minimal margin, and it was similar to that of the Theoretical Ideal Lean Culture. When compared to the other set of cultures, the adhocracy quadrant was very noticeable in this instance. The theoretical ideal and Brazilian culture have some similarities to market culture. Contrary to the other set of cultures, the hierarchical quadrant had a remarkably low score. The organizational culture, in this case, was, overall, comparable to the preceding case study in that all cultures were dispersed equally. Therefore, regardless of the previous three sets of cultures, it may be concluded that the project had a balanced organizational culture.
Conclusion
This study set out to look at how organizational culture affected the LPS-implemented construction projects. To determine the connection between three variables—LPS production planning and control, project operational performance, and organizational culture—two hypotheses were proposed. For the research, multiple measures and survey items were chosen and tested. An organizational culture assessment tool included in the competing values framework (CVF) was also used.
The data was compiled from four different construction projects carried out by well-known construction companies using LPS. To examine the data, the mean and standard deviation of each variable for all survey items were determined. To further analyse the data, all variables’ data were imported into the SPSS program, where bivariate correlation test and multiple regression analysis were carried out.
The result of the bivariate analysis determined that there is a correlation between the LPS implementation and the projects’ operational performances, although a small one. Similar to Hypothesis 1, organizational culture has been found to have a minor but nonetheless beneficial impact on Hypothesis 2. It is important to note that, despite the fact that the hypothesis examines two broader variables—(i) organizational culture, which involves all key personnel and staff associated at the higher organizational level, and (ii) operational performance, which covers all aspects of the project, including cost, quality, planning, etc., the analysis’s favourable findings lead to the conclusion that an organizational culture can moderate the overall operational performance of a project, where LPS is implemented.
Also, OCAI was used to establish the organizational culture of two construction sites of the same organization located in India. The responses were collected such that the overall weightage distribution of all four cultures would add to 100. A six-item questionnaire was used for the study. The organizational culture was compared with three different cultures, i.e., Theoretical Ideal Lean Culture, Brazilian Lean Culture, and German Lean Culture. The survey results were used to conclude that both projects had an equal distribution of the cultures. The four quadrants had similar weights, and no noticeable cultural differences were found.
Limitations and Future Scope
This research possesses limitations, even if it was successful in establishing the association between contextual variables. There was difficulty in gathering primary data due to the fact that only limited construction companies implement LPS on their project. Additionally, no novel framework or type of culture was created or utilized to look at the organizational culture of a company. Future research can consider other frameworks or analysis schemes to evaluate the organizational culture of the company.
A structural equation model can be created, and the same type of analysis can be carried out to produce a more generalized result on other projects where the LPS is used.
References
Ahiakwo, O., Oloke, D., Suresh, S., and Khatib, J., 2013. A Case Study of Last Planner System Implementation in Nigeria. International Group for Lean Construction, 44(0), pp.699–707.
Alsehaimi, A., Tzortzopoulos, P. and Koskela, L., 2009. Last Planner System: Experiences from Pilot Implementation in The Middle East. In: Proceedings for the 17th Annual Conference of the International Group for Lean Construction, Taipei, Taiwan, pp.53–66.
Amos, D. and Boakye-Agyeman, N.A., 2022. Content validation of value-adding indicators for corporate real estate management : insights from a developing country. Journal of Corporate Real Estate, [e-journal] 25(1), pp.77-97. https://doi.org/10.1108/JCRE-08-2021-0024
Ballard, G., 2000. The Last Planner System of Production Control. PhD. University of Birmingham.
Ballard, G., 1997. Lookahead Planning: The Missing Link in Production Control. In: Proceedings for the 5th Annual Conference of the International Group for Lean Construction, Gold Coast, Australia, pp.13–26.
Ballard, G. and Howell, G., 2004. An update on last planner. In: Proceedings for the 11th Annual Conference of the International Group for Lean Construction, Virginia, USA, 2003.
Ballard, G. and Tommelein, I., 2016. Current Process Benchmark for the Last Planner ® System Planner System. Berkeley: University of California.
Bhatla, A. and Leite, F., 2012. Integration Framework of BIM with the Last Planner System. In: Proceedings of 20th Annual Conference of the International Group for Lean Construction, San Diego, California, USA.
Bortolazza, R.C. and Formoso, C.T., 2006. A Quantitative Analysis of Data Collected from The Last Planner System in Brazil. In: Proceedings of 14th Annual Conference of the International Group for Lean Construction, Santiago, Chile, pp.625–35.
Cameron, K. and Quinn, R., 2006. Diagnosing and Changing Organizational Culture. Upper Saddle River, NJ: Prentice Hall Series in Organizational Development (1999).
Castillo, T., Alarc, L.F., Asce, A.M. and Salvatierra, J.L., 2018. Effects of Last Planner System Practices on Social Networks and the Performance of Construction Projects. American Society of Civil Engineers, [e-journal] 144(3). https://doi.org/10.1061/(ASCE)CO.1943-7862.0001443
Daniel, E.I., Pasquire, C. and Dickens, G., 2015. Exploring The Implementation Of The Last Planner System Through IGLC Community : Twenty One Years Of Experience. In: 23rd Annual Conference of the International Group for Lean Construction, Perth, Australia, pp.153–62.
Daniel, E.I., Pasquire, C. and Dickens, G., 2019. Development of Approach to Support Construction Stakeholders in Implementation of the Last Planner System. American Society of Civil Engineers, [e-journal] 35(5), pp.1–16. https://doi.org/10.1061/(ASCE)ME.1943-5479.0000699
Ebbs, P. J., Pasquire, C. L., and Daniel, E. I., 2018. The Last Planner® System Path Clearing Approach in Action: A Case Study. IGLC 2018 - Proceedings of the 26th Annual Conference of the International Group for Lean Construction: Evolving Lean Construction Towards Mature Production Management Across Cultures and Frontiers, pp. 724–733. https://doi.org/10.24928/2018/0433
El Samad, G., Hamzeh, F.R. and Emdanat, S., 2017. Last Planner System – The Need for New Metrics. In: Proceedings of the 25th Annual Conference of the International Group for Lean Construction, Heraklion, Greece. pp.637–44. https://doi.org/10.24928/2017/0218
Fadnavis, S., Najarzadeh, A. and Badurdeen, F., 2020. ScienceDirect An Assessment of Organizational Culture Traits Impacting Problem Solving An Assessment of Organizational Traits Impacting Problem Solving for Lean Culture Transformation for Lean Transformation. Procedia Manufacturing, [e-journal] 48, pp.31–42. https://doi.org/10.1016/j.promfg.2020.05.017
Fernandez-solis, J.L., Porwal, V., Lavy, S., Shafaat, A., Rybkowski, Z.K., do Nascimento, A.F. and Lagoo, N., 2013. Survey of Motivations, Benefits, and Implementation Challenges of Last Planner System Users. American Society of Civil Engineers, [e-journal] 139(April), pp.354–60. https://doi.org/10.1061/(ASCE)CO.1943-7862.0000606
Flyvbjerg, B., 2006. Five Misunderstandings About Case-Study Research. Qualitative Inquiry, 12(2), pp.219–45. https://doi.org/10.1177/1077800405284363
Fernandez-Solis, J., Porwal, V., Lavi, S., Shafaat, A., Rybkowski, Z.A., Kiyoung, S. and Lagoo, N., 2013. Survey of Motivations, Benefits, and Implementation Challenges of Last Planner System Users. Journal of Construction Engineering and Management, [e-journal] 139(4), pp.354–60. https://doi.org/10.1061/(ASCE)CO.1943-7862.0000606
Formoso, C.T. and Moura, C.B., 2009. Evaluation Of the Impact of The Last Planner System on The Performance of Construction Projects. In: Proceedings for the 17th Annual Conference of the International Group for Lean Construction, Taipei, Taiwan, pp.153–64.
Hackett, V., Harte, P. and Chendo, J., 2019. The Development and Use of Last Planner System (LPS) Guidance. In: Proceedings of 27th Annual Conference of the International Group for Lean Construction (IGLC), Dublin, Ireland, pp.651–62. https://doi.org/10.24928/2019/0101
Hamzeh, F.R. and Aridi, O.Z., 2020. Modeling the last planner system metrics: A case study of an AEC. In: 21th Annual Conference of the International Group for Lean Construction, Fortaleza, Brazil, pp.599–608.
Hamzeh, F., & Bergstrom, E., 2010. The Lean Transformation: A Framework for Successful Implementation of the Last PlannerTM System in Construction. International Proceedings of the 46th Annual Conference. Associated Schools of Construction. https://doi.org/10.13140/RG.2.1.4590.8001
Hamzeh, F.R., Khalife, S., El Samad, G., Rizk, L., Abou-Ibrahim, H., Al Hattab, M. and Emdanat, S., 2020. Advanced LPS Metrics for Construction Planning and Control. In: Lincoln H. Forbes and Syed M. Ahmed, eds. Lean Project Delivery and Integrated Practices in Modern Construction. Oxford, UK: Routledge. Ch.16. https://doi.org/10.1201/9780429458989-20
Hamzeh, F.R., Saab, I., Tommelein, I. and Ballard, G., 2015. Understanding the Role of “ Tasks Anticipated “ in Lookahead Planning through Simulation. Automation in Construction, [e-journal] 49, pp.18-26. https://doi.org/10.1016/j.autcon.2014.09.005
Hardcopf, R., Liu, G. and Shah, R., 2021. Lean Production and Operational Performance: The influence of organizational culture. International Journal of Production Economics, [e-journal] 235(May), p.108060. https://doi.org/10.1016/j.ijpe.2021.108060
Hofstede, G., 2011. Dimensionalizing Cultures : The Hofstede Model in Context [e-journal] 2(1), https://doi.org/10.9707/2307-0919.1014
Howell, G. and Ballard, G., 1997. What is Lean Construction ? International Group for Lean Construction, July, 3–4.
Howell, G., 1999. What Is Lean Construction? In: Proceedings of the 7th Annual Conference of the International Group for Lean Construction, Berkeley California, pp.1–10.
Johansen, E. and Porter, G., 2000. An Experience of Introducing Last Planner into A UK Construction Project. In: Proceedings of the 11th Annual Conference of the International Group for Lean Construction, Virginia, USA.
Kallassy, J. and Hamzeh, F., 2021. Developing A Lean Culture Index in Construction. In: Proceedings of the 29th Annual Conference of the International Group for Lean Construction, Lima, Peru. pp.504–13. https://doi.org/10.24928/2021/0192
Kalyan, V., Pratap, V. and Singh, S.C., 2018. Building a Lean Culture into An Organization. In: Proceedings of the 26th Annual Conference of the International Group for Lean Construction, Chennai, India. pp.1101-10. https://doi.org/10.24928/2018/0439
Koskela, L., Ballard, G., Howell, G. and Tommelein, I., 2002. The foundations of lean construction. In: Rick Best and Gerard de Valance, University of Technology Sydney, eds. Design and Construction: Building in Value. Oxford UK: Butterworth Heinemann.
Koskela, L., Stratton, R. and Koskenvesa, A., 2010. Last Planner and Critical Chain in Construction Management. In: Proceedings of the 18th Annual Conference of the International Group for Lean Construction, Haifa, Israel. pp.538–47.
LCI. (2019). Glossary: Lean [online] Available at: https://leanconstruction.org/glossary/.
Lühr, G. and Bosch-Rekveldt, M., 2019. Measuring Project’s Team Culture in Projects Using the Last Planner System. In: Proceedings of the 27th Annual Conference of the International Group for Lean Construction, Dublin, Ireland, pp.963-74. https://doi.org/10.24928/2019/0124
Lühr, G. J., Bosch-Rekveldt, M. and Radujković, M., 2021. The Last-Planner-System’s impact on project culture. Journal of Engineering, Design and Technology, ahead-of-print (ahead-of-print). https://doi.org/10.1108/JEDT-05-2021-0285
Mossman, A., 2015. Last Planner: 5 + 1 crucial and collaborative conversations for predictable design and construction delivery. The Change Business, December, pp.1-40.
Porwal, V., Lavy, S. and Rybkowski, Z.K., 2010. Last Planner System Implementation Challenges. In: Proceedings of the 18th Annual Conference of the International Group for Lean Construction, Haifa, Israel. pp.548–56.
Paro, P., and Gerolamo, M. 2017. Organizational Culture for Lean Programs. Journal of Organizational Change Management. https://doi.org/10.1108/JOCM-02-2016-0039
Priven, V. and Sacks, R., 2013. Social Network Development in Last Planner System TM Implementations. In: Proceedings of the 21st Annual Conference of the International Group for Lean Construction, Fortaleza, Brazil. pp.537–48.
Ravi, R., Laedre, O., Fosse, R., Vaidyanathan, K. and Svalestuen, F., 2018. The Last Planner System: Comparing Indian and Norwegian Approaches. In: Proceedings of the 26th Annual Conference of the International Group for Lean Construction, Chennai, India. pp.381–91. https://doi.org/10.24928/2018/0421
Saiful, M. and Yusoff, B., 2019. ABC of Content Validation and Content Validity Index Calculation. Education in Medicine Journal, [e-journal] 11(2), pp.49–54. https://doi.org/10.21315/eimj2019.11.2.6
Seppänen, O., Modrich, R. and Ballard, G., 2015. Integration Of Last Planner System and Location-Based Management System. In: Proceedings of the 23rd Annual Conference of the International Group for Lean Construction, Perth, Australia. pp.123–32.
Tayeh, B., Al-Hallaq, K., Zahoor, H. and Al Faqawi, A., 2018. Techniques and benefits of implementing last planner system in the Gaza Strip construction industry. Engineering, Construction and Architectural Management. [e-journal] 26(7), pp.1424-36. https://doi.org/10.1108/ECAM-01-2018-0039.
Appendices
Appendix A. Survey Items for LPS Production Planning and Control
| Sr. No. | Measures | Nomenclature | Survey Items of LPS Production Planning and Control for Round-1 | Action Taken | Updated Survey Items of LPS Production Planning and Control for Round-2 | Action Taken |
|---|---|---|---|---|---|---|
| 1 | Percent Plan Complete | PPC 1 | We use sticky notes/excel/software for PPC calculations. | Validated | We use sticky notes/excel/software for PPC calculations. | Validated |
| 2 | PPC 2 | The PPC has been increasing over the period of time. | Modified | The weekly meetings help to achieve a significant increase in the PPC over the period of time | Validated | |
| 3 | PPC 3 | We monitor PPC on a daily/weekly basis. | Validated | We monitor PPC on a daily/weekly basis. | Validated | |
| 4 | PPC 4 | In order to understand the planning reliability of the project PPC is used. | Validated | In order to understand the planning reliability of the project PPC is used. | Validated | |
| 5 | PPC 5 | PPC tracking is helpful for production control. | Validated | PPC tracking is helpful for production control. | Validated | |
| 6 | Lookahead Plan | LAP 1 | The look-ahead plan helps to minimize the variability in the workflow. | Validated | The look-ahead plan helps to minimize the variability in the workflow. | Validated |
| 7 | LAP 2 | Our weekly meetings assist to identify the constraints. | Validated | Our weekly meetings assist to identify the constraints. | Validated | |
| 8 | LAP 3 | We analyse each possible constraint in the meeting. | Validated | We analyse each possible constraint in the meeting. | Validated | |
| 9 | LAP 4 | All the not-ready activities are made ready at least a week before their execution. | Validated | All the not-ready activities are made ready at least a week before their execution. | Validated | |
| 10 | Reasons for Non-Completion | RNC 1 | We always monitor the reasons for the non-completion of activities. | Validated | We always monitor the reasons for the non-completion of activities. | Validated |
| 11 | RNC 2 | We always take action to correct the RNC. | Validated | We always take action to correct the RNC. | Validated | |
| 12 | RNC 3 | Our crews are trained regularly to avoid the non-completion of activities. | Validated | Our crews are trained regularly to avoid the non-completion of activities. | Validated | |
| 13 | RNC 4 | In order to capture the reasons for non-completion collaborative planning board is used. | Eliminated | - | Eliminated | |
| 14 | Weekly Work Plan | WWP 1 | Our crews only commit work that CAN be completed. | Validated | Our crews only commit work that CAN be completed. | Validated |
| 15 | WWP 2 | Our crews don’t under/over commit the weekly tasks. | Validated | Our crews don’t under/over commit the weekly tasks. | Validated | |
| 16 | WWP 3 | The setup of our meetings allows a better understanding of the project control. | Eliminated | - | Eliminated | |
| 17 | WWP 4 | Our weekly meetings assist to foresee work plans. | Validated | Our weekly meetings assist to foresee work plans. | Validated | |
| 18 | WWP 5 | We identify the level of cause at which countermeasures can be effective in preventing reoccurrence. | Validated | We identify the level of cause at which countermeasures can be effective in preventing reoccurrence. | Validated | |
| 19 | Tasks Anticipated | TA 1 | We measure the performance of LAP with help of TA. | Validated | We measure the performance of LAP with help of TA. | Validated |
| 20 | TA 2 | We measure the percent of tasks on the commitment plan, which was anticipated before the execution week. | Validated | We measure the percent of tasks on the commitment plan, which was anticipated before the execution week. | Validated | |
| 21 | TA 3 | TA helps to avoid the identification of new tasks at the last moment. | Modified | No tasks remain unidentified with the aid of TA | Validated | |
| 22 | Tasks Make Ready | TMR 1 | We remove all the constraints from the planned activity. | Modified | Involvement of senior management helps remove all the constraints from the planned activities. | Validated |
| 23 | TMR 2 | We use TMR to turn work that SHOULD be done into work that CAN be done. | Validated | We use TMR to turn work that SHOULD be done into work that CAN be done. | Validated | |
| 24 | TMR 3 | We do root cause analysis for the not-ready activities. | Validated | We do root cause analysis for the not-ready activities. | Validated | |
| 25 | Training | TR 1 | We regularly organize training sessions for LPS implementation. | Eliminated | - | Eliminated |
| 26 | TR 2 | Our crew is trained about the concept implementation of LPS. | Validated | Our crew is trained about the concept implementation of LPS. | Validated | |
| 27 | TR 3 | Our crew efficiently participates in the training sessions. | Modified | All the participants share their inputs in the training sessions. | Validated | |
| 28 | Planning Process | PP 1 | - | Added | LPS is a part of our standard planning process. | Validated |
| 29 | PP 2 | - | Added | We use a designated format/report to convey the data with the planning team. | Validated |
Appendix B. Final Pool of Survey Items
Survey Items for LPS Production Planning and Control
| Sr. No. | Measure/Survey Item | I-CVI (relevance) | I-CVI (clarity) | Decision |
|---|---|---|---|---|
| Percent Plan Complete | ||||
| 1 | In order to understand the planning reliability of the project PPC is used. | 1.00 | 1.00 | Validated |
| 2 | PPC tracking is helpful for production control. | 1.00 | 1.00 | Validated |
| 3 | We use sticky notes/excel/software tools for PPC calculations. | 0.80 | 1.00 | Validated |
| 4 | The weekly meetings help to significantly improve the PPC over the period of time. | 1.00 | 1.00 | Validated |
| 5 | We monitor PPC on a daily basis. | 1.00 | 1.00 | Validated |
| S-CVI/AVE | 0.96 | 1.00 | ||
| Look Ahead Planning | ||||
| 6 | The lookahead plan helps to minimize the variability in the workflow. | 1.00 | 1.00 | Validated |
| 7 | Our weekly meetings assist to identify the constraints. | 1.00 | 1.00 | Validated |
| 8 | We analyse each possible constraint in the weekly meetings. | 1.00 | 1.00 | Validated |
| 9 | All the not-ready activities are made ready at least a week before their execution. | 1.00 | 1.00 | Validated |
| S-CVI/AVE | 1.00 | 1.00 | ||
| Reasons for Non-Completion | ||||
| 10 | We always analyse and monitor the reasons for the non-completion of activities. | 0.80 | 1.00 | Validated |
| 11 | We always take action to correct the cause for non-completion. | 1.00 | 1.00 | Validated |
| 12 | Our crews are trained and regularly monitored to avoid the non-completion of activities. | 0.80 | 1.00 | Validated |
| S-CVI/AVE | 0.87 | 1.00 | ||
| Weekly Work Plan | ||||
| 13 | Our crews only commit work that CAN be completed. | 1.00 | 1.00 | Validated |
| 14 | Our crews do not under/over commit the weekly tasks. | 1.00 | 1.00 | Validated |
| 15 | Our weekly meetings assist to foresee work plans. | 1.00 | 1.00 | Validated |
| 16 | We identify the level of cause at which countermeasures can be effective in preventing reoccurrence. | 0.80 | 1.00 | Validated |
| S-CVI/AVE | 0.95 | 1.00 | ||
| Tasks Anticipated | ||||
| 17 | We measure the performance of LAP with help of TA. | 1.00 | 1.00 | Validated |
| 18 | We measure the percent of tasks on the commitment plan anticipated before the execution week. | 1.00 | 1.00 | Validated |
| 19 | No tasks remain unidentified with the aid of the TA. | 1.00 | 1.00 | Validated |
| S-CVI/AVE | 1.00 | 1.00 | ||
| Tasks Make Ready | ||||
| 20 | Involvement of senior management helps remove all the constraints from the planned activities. | 0.80 | 1.00 | Validated |
| 21 | We use TMR to turn work that SHOULD be done into work that CAN be done. | 1.00 | 1.00 | Validated |
| 22 | We do root cause analysis for the not-ready activities. | 0.80 | 1.00 | Validated |
| S-CVI/AVE | 0.87 | 1.00 | ||
| Training | ||||
| 23 | Our crews are trained in the concept implementation of LPS. | 1.00 | 1.00 | Validated |
| 24 | All the project members (participants) share their inputs and lessons learned about lean implementation in the training sessions. | 0.80 | 1.00 | Validated |
| S-CVI/AVE | 0.90 | 1.00 | ||
| Planning Process | ||||
| 25 | LPS is a part of our standard planning process. | 1.00 | 1.00 | Validated |
| 26 | We use a designated format/report to convey the data with the planning team. | 1.00 | 1.00 | Validated |
| S-CVI/AVE | 1.00 | 1.00 | ||
Survey Items for Operational Performance
| Sr. No. | Measure/Survey Item | I-CVI (relevance) | I-CVI (clarity) | Decision |
|---|---|---|---|---|
| Cost | ||||
| 1 | Reduction in cost | 1.00 | 1.00 | Validated |
| S-CVI/AVE | 1.00 | 1.00 | ||
| Time | ||||
| 2 | Reduction in project duration | 1.00 | 1.00 | Validated |
| 3 | Improved productivity | 1.00 | 1.00 | Validated |
| S-CVI/AVE | 1.00 | 1.00 | ||
| Quality | ||||
| 4 | Conformance to project specification | 1.00 | 1.00 | Validated |
| 5 | Reduction in rework | 1.00 | 1.00 | Validated |
| S-CVI/AVE | 1.00 | 1.00 | ||
| Safety | ||||
| 6 | Improved Safety | 1.00 | 1.00 | Validated |
| S-CVI/AVE | 1.00 | 1.00 | ||
Appendix C. Calculations of CVI Values for Round-1
Survey Items of LPS Production Planning and Control
| Survey Items | Expert 1 | Expert 2 | Expert 3 | Expert 4 | Expert 5 | Expert 6 | Experts in Agreement | I-CVI | UA | |
|---|---|---|---|---|---|---|---|---|---|---|
| PPC 1 | 1 | 1 | 1 | 0 | 1 | 1 | 5 | 0.83 | 0 | |
| PPC 2 | 0 | 1 | 1 | 0 | 1 | 1 | 4 | 0.67 | 0 | |
| PPC 3 | 1 | 0 | 1 | 1 | 1 | 1 | 5 | 0.83 | 0 | |
| PPC 4 | 1 | 1 | 1 | 1 | 0 | 1 | 5 | 0.83 | 0 | |
| PPC 5 | 1 | 0 | 1 | 1 | 1 | 1 | 5 | 0.83 | 0 | |
| LAP 1 | 1 | 1 | 1 | 1 | 1 | 1 | 6 | 1.00 | 1 | |
| LAP 2 | 1 | 1 | 1 | 1 | 1 | 1 | 6 | 1.00 | 1 | |
| LAP 3 | 1 | 1 | 1 | 0 | 1 | 1 | 5 | 0.83 | 0 | |
| LAP 4 | 1 | 1 | 1 | 1 | 1 | 1 | 6 | 1.00 | 1 | |
| RNC 1 | 1 | 1 | 1 | 1 | 1 | 1 | 6 | 1.00 | 1 | |
| RNC 2 | 1 | 1 | 1 | 1 | 1 | 1 | 6 | 1.00 | 1 | |
| RNC 3 | 1 | 0 | 1 | 1 | 1 | 1 | 5 | 0.83 | 0 | |
| RNC 4 | 1 | 1 | 0 | 0 | 0 | 1 | 3 | 0.50 | 0 | |
| WWP 1 | 1 | 1 | 1 | 1 | 1 | 1 | 6 | 1.00 | 1 | |
| WWP 2 | 1 | 1 | 0 | 1 | 1 | 1 | 5 | 0.83 | 0 | |
| WWP 3 | 0 | 0 | 1 | 0 | 1 | 1 | 3 | 0.50 | 0 | |
| WWP 4 | 1 | 1 | 1 | 1 | 1 | 1 | 6 | 1.00 | 1 | |
| WWP 5 | 1 | 1 | 1 | 1 | 1 | 1 | 6 | 1.00 | 1 | |
| TA 1 | 1 | 0 | 1 | 1 | 1 | 1 | 5 | 0.83 | 0 | |
| TA 2 | 1 | 1 | 1 | 0 | 1 | 1 | 5 | 0.83 | 0 | |
| TA 3 | 0 | 1 | 1 | 0 | 1 | 1 | 4 | 0.67 | 0 | |
| TMR 1 | 1 | 1 | 1 | 0 | 1 | 1 | 5 | 0.83 | 0 | |
| TMR 2 | 1 | 1 | 1 | 0 | 1 | 1 | 5 | 0.83 | 0 | |
| TMR 3 | 1 | 0 | 1 | 1 | 1 | 1 | 5 | 0.83 | 0 | |
| TR1 | 1 | 0 | 1 | 1 | 0 | 0 | 3 | 0.50 | 0 | |
| TR2 | 1 | 1 | 1 | 1 | 1 | 1 | 6 | 1.00 | 1 | |
| TR3 | 1 | 0 | 1 | 0 | 1 | 1 | 4 | 0.67 | 0 | |
| S-CVI/Ave | 0.83 | |||||||||
| Proportion Relevance | 0.89 | 0.70 | 0.93 | 0.63 | 0.89 | 0.96 | S-CVI/UA | 0.33 | ||
| Average proportion of items judged as relevance across the two experts | 0.83 | |||||||||
Survey Items of Operational Performance
| Survey Items | Expert 1 | Expert 2 | Expert 3 | Expert 4 | Expert 5 | Expert 6 | Experts in Agreement | I-CVI | UA | |
|---|---|---|---|---|---|---|---|---|---|---|
| Cost 1 | 1 | 1 | 1 | 1 | 0 | 1 | 5 | 0.83 | 0 | |
| Cost 2 | 1 | 0 | 1 | 0 | 1 | 1 | 4 | 0.67 | 0 | |
| Time 1 | 1 | 1 | 1 | 1 | 0 | 1 | 5 | 0.83 | 0 | |
| Time 2 | 1 | 1 | 1 | 0 | 1 | 1 | 5 | 0.83 | 0 | |
| Qual 1 | 1 | 1 | 1 | 0 | 1 | 1 | 5 | 0.83 | 0 | |
| Qual 2 | 1 | 1 | 1 | 1 | 0 | 1 | 5 | 0.83 | 0 | |
| S-CVI/Ave | 0.81 | |||||||||
| Proportion Relevance | 1.00 | 0.83 | 1.00 | 0.50 | 0.50 | 1.00 | S-CVI/UA | 0.00 | ||
| Average proportion of items judged as relevance across the two experts | 0.81 | |||||||||