Construction Economics and Building
Vol. 23, No. 3/4
December 2023
RESEARCH ARTICLE
Adopting Qualitative Data in Conceptual System Dynamic Modelling: A Focus on Road Infrastructure Projects in Nigeria
Abba Tahir Mahmud1,*, Stephen O. Ogunlana2, W. T. Hong3, Ibrahim Yahaya Wuni4, Sani Rueben Akoh5
1 School of Civil Engineering and Surveying, University of Portsmouth, UK
2 Elim Project Systems Limited, Edinburgh, UK
3 School of Energy, Geoscience, Infrastructure and Society, Heriot-Watt University – Malaysia Campus, Putrajaya, Malaysia
4 Department of Architectural Engineering and Construction Management, King Fahad University of Petroleum and Minerals, Dhahran, Saudi Arabia
5 School of Science, Engineering and Environment, University of Salford, Manchester, UK
Corresponding author: Dr Abba Tahir Mahmud, University of Portsmouth, UK, Abba.mahmud@port.ac.uk
DOI: https://doi.org/10.5130/AJCEB.v23i3/4.8625
Article History: Received 26/04/2023; Revised 19/11/2023; Accepted 22/11/2023; Published 23/12/2023
Abstract
Qualitative data is pivotal in system dynamics (SD) modelling, especially during model conceptualization. While various forms of data exist, the mental databases of stakeholders, accessible through interviews, are considered most crucial. Nevertheless, a structured and systematic interview and data analysis process is imperative. While most established methods for systematically analysing qualitative data rely on grounded theory approach, this study introduces an innovative coding technique. This method combines the principles of thematic analysis, saliency analysis (an extension of thematic analysis) framework, case study approach, and key features of existing coding methods. This proposed approach emphasizes (i) coding data across all stakeholder groups, (ii) determining causal relationships from stakeholders’ causal attributions and transforming these relationships into causal maps, and (iii) establishing and maintaining explicit links between causal maps and their data source through a data source reference table and software. To demonstrate the practical application of this coding approach, it was applied to a study focusing on the cost performance of road infrastructure projects in Nigeria, where 16 semi-structured interviews were analysed. The findings indicate that the formulated coding approach provided a comprehensive, rigorous, and well-documented framework for coding qualitative data. This facilitated the development of a data-driven conceptual model that captures the intricate interplay of key determinants leading to cost overruns in road infrastructure projects in Nigeria.
Keywords
System Dynamics; Coding Framework; Model Conceptualization; Qualitative Data; Road Infrastructure Project; Dynamic Modelling
Introduction
Qualitative data is crucial in system dynamics (SD) modelling efforts (Kim and Andersen, 2012). The significance of this data is profound. As highlighted by Forrester (1992) and Sterman (2000), a vast amount of the information needed SD model development is derived from both mental and written databases of stakeholders. Conversely, the numerical database provides only a small fraction of this data. Luna‐Reyes and Andersen (2003) noted that qualitative data can be instrumental across all stages of the modelling process: conceptualisation, formulation, testing and implementation.
Interviewing stakeholders is one of the primary techniques for gathering qualitative data, especially for problem identification and model conceptualisation (DiCicco‐Bloom and Crabtree, 2006; Eker and Zimmermann, 2016). As emphasized by Luna‐Reyes and Andersen (2003), valuable insights about a problem can be obtained from stakeholders’ mental databases. However, the manner in which these interviews are conducted varies. For instance, stakeholders might initially be presented with preliminary causal loop diagrams (CLDs), to set the stage for further discussion or to be used in a non-confirmatory manner. They could also be directly asked about causal relationships to aid in developing CLDs, or more importantly, to inform the conceptualisation of a model (Eker and Zimmermann, 2016). Among the available interview techniques, semi-structured interviews offer an opportunity to elicit rich qualitative data about the interviewees’ mental models and underlying narratives, allowing them the freedom to elaborate on the topic of interest.
Before the studies of Eker and Zimmermann (2016), Kim and Andersen (2012), Turner, et al. (2013), and Yearworth and White (2013), numerous techniques were established for analysing qualitative data and extracting causal structures directly from data during the SD modelling conceptualisation phase (Kim and Andersen, 2012). Yet, a clear formal coding method that described and documented the systematic coding process- aimed at identifying causal structures from qualitative data to promote the generation of CLDs as a foundational step in SD modelling- was lacking (Eker and Zimmermann, 2016). The approaches adopted by Eker and Zimmermann (2016), Kim and Andersen (2012), and Turner, et al. (2013) were inspired by grounded theory and its associated data coding techniques, and also compatible with a particular research design considering some key elements of the research process. Their inclination towards the grounded theory approach emerged from its ability to develop a theory inductively, from qualitative data, through a well-structured process (Eker and Zimmermann, 2016). Moreover, these approaches have been systematically applied in diverse sectors, including Land use (Turner, et al., 2013), decision making in the UK housing sector (Eker and Zimmermann, 2016), and decision making in the United States financial sector (Kim and Andersen, 2012).
In this study, an alternative coding method was proposed, inspired by the principles of thematic analysis, saliency analysis (an extension of thematic analysis) framework and case study approach, and a synthesis of the core strengths of existing techniques, aiming to address their shortcomings. This newly devised method emphasizes (i) coding data across all stakeholder groups, (ii) determining causal relationships from stakeholders’ causal attributions and transforming these relationships into causal maps, and (iii) establishing and maintaining explicit links between causal maps and their data sources through a data source reference table and software. The application of this coding approach was then demonstrated in a study focusing on the cost performance of road infrastructure projects in Nigeria, where transcribed qualitative interview data were analysed to understand the primary determinants influencing poor cost performance.
Literature review
Case study: cost performance of road infrastructure projects in Nigeria
The construction industry, both globally and especially in the developing world, plays a crucial role in bolstering developmental and economic activities. In particular, roads contribute significantly to the gross domestic product (GDP) of Nigeria by harnessing diverse clusters of economic activities. Federal roads are the most preferred means of transportation in many emerging countries. In Nigeria, while they constitute only about 18% of the total national road network, they are responsible for the transportation of approximately 95% of all freight, vehicles, and people (Ogbu and Adindu, 2019). Road infrastructure construction remains one of the primary areas of construction investment in Nigeria. For example, about 229 Federal road projects, worth over ₦2.361 trillion, are currently ongoing across Nigeria (Federal Ministry of Works Nigeria, 2019). Despite the importance of roads and the significant financial commitment by the public sector, road projects in Nigeria are infamous for exceeding their planned cost and duration. Many of these projects, in all areas of the country, have experienced cost overruns ranging from 23.6% to about 199% (Federal Ministry of Works Nigeria, 2019).
Review of existing coding frameworks
The purpose of the coding framework, and its structured process, is to identify themes and their causal relationships from qualitative data, and eventually transform the causal relations into a CLD, and relate the CLD directly to the data source (DS). The linkage between the CLD and the DS is considered a very important element of the coding process, and of the development of a conceptual model, because it allows for explicit, reflective, and rigorous transformation of data segments into causal links, and eventually a CLD (Eker and Zimmermann, 2016). According to Eker and Zimmermann (2016), a systematic and rigorous method for analysing qualitative data for a conceptual SD model helps to add rigour to the resultant model, by preserving linkages between the CLD and the DS, which is an important step for building confidence in a model. Eker and Zimmermann (2016) also advocated the use of CAQDAS to make the link between the CLD and the DS more transparent. However, one limitation of CAQDAS is that external reviewers cannot access the database, making it challenging to access the researchers’ work. Accordingly, Kim and Andersen (2012) contended that there is a need to establish a link between the DS and the CLD, using a DS reference table to ensure transparency in the process.
Yearworth and White (2013), Kim and Andersen (2012), and Nguyen, Beeton and Halog (2015) stressed that the identification of a causal relationship should be grounded by a statement explicitly or implicitly showing the occurrence of a relationship between two codes/themes within the same paragraph in the DS. With this, you can easily see how the themes are potentially related by the paragraph context (Yearworth and White, 2013; Nguyen, Beeton and Halog, 2015). Furthermore, Eker and Zimmermann (2016) suggested that, as well as having a statement within a paragraph revealing a causal relationship, indicators such as “because”, “if”, “so as”, and “then” should be considered, in order to establish causal relationships amongst codes/themes within a segment of data, and also the researcher’s understanding of an expressed causal relationship.
The use of coding to develop SD models was originally illustrated by Repenning and Sterman (2002). Later, a formal coding technique, centred on the grounded theory approach, was introduced to the academic community of system dynamitists by Kim and Andersen (2012), and demonstrated the use of a systematic and rigorous process for the generation of CLDs based on qualitative textual data which is grounded in data. This technique has been methodically applied in numerous realms of studies, such as: land use (Turner, et al., 2013), decision making in the UK housing sector (Eker and Zimmermann, 2016), and environmental adaptation in industry (Nguyen, Beeton and Halog, 2015). However, the method advocated by Kim and Andersen (2012) was designed for coding and analysing synchronous data, which is based on shared context opinions from a group discussion. The coding approach is comprised of five main steps: (i) open coding for identification of themes from the data, (ii) identification of individual causal relationships, (iii) visualising the causal relationships in word and arrow diagrams, (iv) using axial coding to generalise and simplify the word and arrow diagrams, and (v) explicitly recording the links between the final CLD and the DS in a DS reference table. The technique helps in analysing the data systematically, and adds rigour by preserving the link between the CLD and the DS.
Later on, Turner, et al. (2013) modified the method of Kim and Andersen to overcome the long process of generating a causal model, and also to create an alternative design that would be compatible with other forms of data, e.g. asynchronous data. The method advocated by Turner, et al. (2013) was used to analyse asynchronous interview data, which is based on individual opinions. Turner, et al. (2013) combined steps (i) and (iv) of Kim and Andersen’s approach, and derived aggregated causal relationships from various stakeholder groups (i.e., groups based on stakeholders’ categorisation, instead of the individual causal relationships in Kim and Andersen’s method), to shorten the process of identifying variables. Furthermore, the approach omits the step of creating a DS reference table (which explicitly records the link between the causal relationships and the data source, and forms an essential step in Kim and Andersen’s method for building confidence in the model), contending that it is not critically important if the researcher is responsible for data collection (interviewer) and the coding process (coder), because he/she is in direct contact with the DS and can probe the interviewees’ intent during the interview process, and thus reduce the risk of bias (Turner, Kim and Andersen, 2013).
Yearworth and White (2013) also introduced a method for developing CLDs using textual data. This method relies on the utilisation of computer aided qualitative data analysis (CAQDAS) software to maintain close links between the causal relationships and the DS. This approach also suggests establishing a causal relationship when two codes or themes coexist within the same paragraph of the DS.
Also, Eker and Zimmermann (2016) formulated a method of developing CLDs explicitly from qualitative textual data. The approach synthesised the key strengths of the three (3) coding approaches advocated by Kim and Andersen (2012), Yearworth and White (2013), and Turner, et al. (2013), which have previously been described. The method advocated by Eker and Zimmermann (2016) focused on: establishing a causal relationship from the preliminary stages of coding, creating a generalized and simplified CLD without recording individual relationships to reduce time consumption during the process, and maintaining links between the final CLD and the DS by using CAQDAS.
In conclusion, while the reviewed coding approaches (though limited) focused on principles of grounded theory, there is a discernible gap in evaluating other theory-building paradigms, notably case study approach supported by thematic analysis framework. This consideration becomes salient in contexts like construction management.
Research Methodology
In the methods section, the data collection method is outlined. Additionally, the alternative coding framework formulated and employed to analyse transcribed qualitative data is described, as illustrated in a study on the cost performance of road infrastructure projects in Nigeria.
Data collection
The data collection process aligned with the approach used by Eker and Zimmermann (2016), as it leverages the diverse perspectives of stakeholders with a broad spectrum of experience and expertise in road development within Nigeria. This inclusive strategy enhances the information by capturing a comprehensive range of insights and reflections on the problem (Mahmud, Ogunlana and Hong (2020a); Mahmud, Ogunlana and Hong (2020b)). The qualitative data was collected using interviews. Specifically, qualitative data were collected through 16 semi-structured interviews with interdisciplinary stakeholders from the client, contractor, and consultant organisations involved in road infrastructure development in Nigeria, each having between 10 years and over 20 years of experience.
Sampling of respondents and interview process
The approach for selecting interview participants was influenced by similar technique adopted by Mahmud, Ogunlana and Hong (2020a) and Mahmud, Ogunlana and Hong (2020b). Interviewees were specifically chosen for their depth of experience and knowledge in the provision of road projects. The approach combined purposive sampling with a snowballing technique, aiming to access stakeholders that can provide the requisite information and ensuring diverse representation of stakeholders from different background. The purposive sampling method was preferred due to its ability to target stakeholders based on their specific expertise in road project development. However, some stakeholders were unreachable due to bureaucratic obstacles and other impediments (Mahmud, Ogunlana and Hong (2020a); Mahmud, Ogunlana and Hong (2020b). To overcome this challenge, snowballing approach was adopted as a complementary strategy to contact inaccessible stakeholders through referrals from those in the client and contractor organisations as suggested by Datta, et al. (2023).
To collect data, semi-structured interviews were adopted. These interviews followed a structured protocol, aligned with best practices for conducting qualitative based research as outlined by (Kvale and Brinkmann, 2009). This rigorous approach aimed to ensure the reliability and trustworthiness of the study’s findings (Sa’id, 2019). The interview protocol comprised of four main sections, exploring into: the nature of the prevailing problem, participants’ role within their organisations, their experiences in the realm of road infrastructure development, and their insights into the cost performance challenges facing road projects as detailed in Table 1. Participants were encouraged to shed light on the challenges facing road projects in Nigeria, drawing upon their firsthand experiences. Additional probing questions were formulated in response to their initial answer, facilitating the identification of codes, themes and determination of causal attributions. Each interview, lasting between 40 minutes to 1hr and 20 minutes, was audio recorded and subsequently transcribed, providing the foundational textual data for the overall analysis process.
Table 2 illustrates the distribution of participants across different organisations: 3 from the contractor organisation, 7 from the client organisation, and 6 from the consultant organisation. Each interview adhered to the same procedure and protocol, but additional probing was employed to gain clearer insights on relevant issues.
Formulated Coding framework
The objective of the formulated coding method is to directly link the CLD to the DS. Such a connection is essential in the coding process, allowing the researcher to transform qualitative data extracts into causal links and subsequently into CLDs with clarity, reflectiveness and rigor. Furthermore, it helps readers to evaluate the work of the researcher by examining the CLD, the DS and the entire process and thus gain some insights into their mental processes and indeed the conceptual modelling process.
The developed coding approach is based on the coding framework proposed by Turner, et al. (2013), which is adaptable with asynchronous data. However, slight modifications were made to better align with its fundamental elements. Additionally, the coding approach integrates key aspects of coding frameworks proposed by Kim and Andersen (2012), Eker and Zimmermann (2016), and Yearworth and White (2013). For instance, a computer aided qualitative data analysis software (CAQDAS), specifically Nvivo 12, was used to ensure that references between the final CLD and the original data sources were maintained, in line with the approaches of Eker and Zimmermann (2016), and Yearworth and White (2013). Furthermore, a DS reference table was also incorporated to strengthen the connection between the causal links, subsequent CLD and the DS, similar to the approach of Kim and Andersen (2012). To understand and elucidate the slight deviations and synthesis from the adopted coding approaches that formed the basis for the formulation of the new coding method, the framework advocated by Turner, Kim and Andersen (2013) and Eker and Zimmermann (2016) was adopted. This framework emphasizes six fundamental research design dimensions inessential when formulating an alternative coding approach. The modifications of the adopted coding approach (i.e., Turner, et al. (2013)) and the synthesis of other coding methods (i.e., Eker and Zimmermann (2016), Kim and Andersen (2012), and Yearworth and White (2013)), reflect the research design for the formulated coding framework, as presented in Table 3.
Note: 1: Turner, Kim and Andersen (2013); 2: Eker and Zimmermann (2016)
The first two dimensions focus on the characteristics of the stakeholder categories. In this study, communication was asynchronous as each stakeholder is interviewed independently, and multiple stakeholder groups, including clients, contractors, and consultants were represented. With these two dimensions, causal links were established, and CLDs were constructed from the collective interviews across all stakeholders and not from a specific group. This means that all interviews, regardless of the stakeholder groups, are considered in the coding process. Also, causal relationships were identified by assessing statements that reflects participants’ mental models expressing causal relations between two codes/themes within the same paragraph in a data item. The causal links derived from all the data items (individual interviews) were then merged to produce CLDs of different categories of determinants. These were subsequently integrated into a composite CLD illustrating the links between the various categories.
With regards to the two dimensions related to data collection, both the context setting, and data collection were conducted by the first author. The context was established through structured interview questions, allowing each interviewee the freedom to share their knowledge and insights on the problem context. Information relevant to the problem was extracted, while information beyond the scope of the study was discarded, based on steps (iii) and (iv) of the thematic analysis framework and elements of saliency analysis framework. Collecting the data by the first author facilitated a deeper understanding of the context.
As for the coder characteristics, the first author, who was also responsible for data collection analysed all the data. To minimize the risk of bias by a single coder and to ensure accurate data analysis, the second author reviewed the coding process. Moreover, the use of CAQDAS (i.e., Nvivo 12) allowed for clear referencing to the data sources and recording of the coders’ assumptions, enabling traceability of the coders’ interpretation of the data when required.
During the coding process, CAQDAS (Nvivo 12) was employed to code qualitative data from various sources (interview transcripts) into nodes (codes). Nvivo 12 facilitates the formation of relationships between different codes/themes and the linkage of these relationships to their data sources; thus, it records the causal relationships between different codes/themes and the codes/themes defining these relationships within the software’s database.
Unlike adopting the grounded theory approach (such as Eker and Zimmermann (2016), Kim and Andersen (2012) and Turner, et al. (2013)), the developed coding approach is grounded in the principles of thematic analysis, saliency analysis (an extension of thematic analysis), and case study approach (which is also oriented towards theory building) (Eisenhardt, 1989; Braun and Clarke, 2006), to analyse the transcribed interview data through the process of coding and retrieval of causal relationships explicitly from data. Thematic analysis, as advocated by Braun and Clarke (2006) relies on ‘coding’ of transcribed interview data and involves six main steps: (i) familiarising yourself with the data, (ii) generating the initial codes, (iii) searching for themes in the data, (iv) reviewing the themes, (v) defining and naming the themes, and (vi) producing a report (Braun and Clarke, 2006). Initially, codes are generated independently (in steps i and ii); later, in the second phase (i.e., steps iii-v of the coding process), related codes are organised into themes as patterns emerge (Rabinovich and Kacen, 2010). The case study approach, suitable for theory testing and theory development (Eisenhardt, 1989; Bryman, 2012), aligns with SD model conceptualisation (Ullah, 2012; Turner, et al., 2013; Mahmud, Ogunlana and Hong, 2020b).
The formulated coding method incorporates steps i-v of thematic analysis. It begins with the identification of the problem and establishing the system boundary through the generation of codes, the categorisation of these codes into themes, further analysis of the data to identify the key themes and the causal statements that reflect the mental models of the stakeholders (steps i-iv), and defining and naming the themes, i.e., identifying the essence of what the theme is about and identifying and establishing any relationships between the various themes (step v).
Table 4 outlines the coding steps of the formulated coding process, reflecting the thematic analysis core steps. The process begins with coding individual data items from all stakeholder groups to define the problem and establish the system’s boundary, generate codes and have a preliminary idea of the potential themes. In the second step, the codes generated are aggregated into refined themes, supported by relevant data extracts. Important themes are identified by considering both prevalence of occurrence and importance of information, using saliency analysis framework, to ensure that only information relevant to the problem is considered. In the third step, causal relationships are defined between themes/codes based on a causal statement between two codes/themes within the same paragraph originating from a stakeholder’s mental model. This step also generates coding charts from the identified causal relationships. Nvivo 12 was used to define the relationships and maintain references to the data. The fourth step entails transforming the coding charts into causal links, and subsequently into individual CLDs and a composite CLD. Finally, this step also creates a DS reference table to establish and maintain a link between the CLD and the DS.
Results
In this section, the formulated coding framework is applied to analyse data from 16 stakeholders involve in road projects development in Nigeria. This is to understand the intricacies of cost overrun risk determinants. The coding approach has been previously implemented in studies by Mahmud, Ogunlana and Hong (2020a) and Mahmud, Ogunlana and Hong (2020b).
Identifying codes and discovering themes in the data
This phase aligns with steps i, ii and iii of the thematic analysis framework introduced by Braun and Clarke (2006). It is instrumental in defining the problem and establishing the system’s boundary. An essential part of this step is to ensure that implicit concepts within the data extracts are coded, encompassing the entire scope of the dataset. During this phase, interview data is meticulously coded to identify the information relevant to the problem. The identified codes represent both verbatim terms from the interview transcripts and inferred concepts grounded in literature, leading to a comprehensive range of codes. For instance, an excerpt such as: “You know the project has been on and off for quite a few times, it really affected the progress of the project because the client is committed to a lot of ongoing projects all over the country. This is something that is peculiar to almost all public sector financed projects” is coded as “Uncertainty in progress” denoting “Delay in progress of work”. Conversely, some statements do not disclose a concept with clear references, prompting the derivation of concepts/codes from the existing empirical literature. For instance, the excerpt: “The contractors often have to keep to their commitment with other indirect costs and when they returned to site after a while, things have changed, the client then have to agree to review the contract so as to accommodate the significant changes to the prices of materials, labour and even equipment spare parts. All these have to be factored into the reviewed contract “is coded as “reviewing contract terms” which indicate upward revision of project contract due to pricing, aligning with the theme “Variation”.
As the analysis unfolds, patterned relationship of the various codes or codes of similar status begin to emerge, giving the coder preliminary insights into the potential themes. This process is iterative, with codes being revisited and refined to distil the core information that will inform subsequent stages of analysis. In doing so, the researcher/coder develops a preliminary understanding of the causal connections expressed by participants, a crucial step for identifying causal relationship in later stages. The coding process is facilitated by CAQDAS tools such as Nvivo 12, which provides robust features to link coded extracts with their respective codes reliably. This capability ensures traceability from the raw data to the emergent analytical constructs.
Categorising and aggregating codes into refined themes from all interview data
This stage aligns with steps iv and v of the thematic analysis framework introduced by Braun and Clarke (2006). It involves reviewing the codes generated in the initial step (step 1) to determine if they form a distinct theme. The codes and themes are organised hierarchically across three levels. The primary level, or parent node, represents the categories of the determinants of cost overrun such as the different determinant groups. The secondary level comprises child nodes that entails specific themes like “delay in payment to contractors”. The third level comprises sub-group of the child nodes which represents the coded information. In other words, the coded information referring to a concept such as “contractors financial challenges”, “inconsistent payment to contractors” and “untimely payment of completed works” are grouped to form a theme such as “delay in payment to contractors” (i.e., child nodes in secondary level) as depicted in Figure 1. Moreover, the related child nodes such as “delay in payment to contractors”, “delay in progress of work” etc. are clustered to form parent nodes that categorize the types of determinants, like “project management related determinants. The coding tree is developed iteratively, as illustrated in Table 5. Additionally, the codes and data extracts are continually revised, leading to the creation of refined themes from the aggregated relevant coded information.
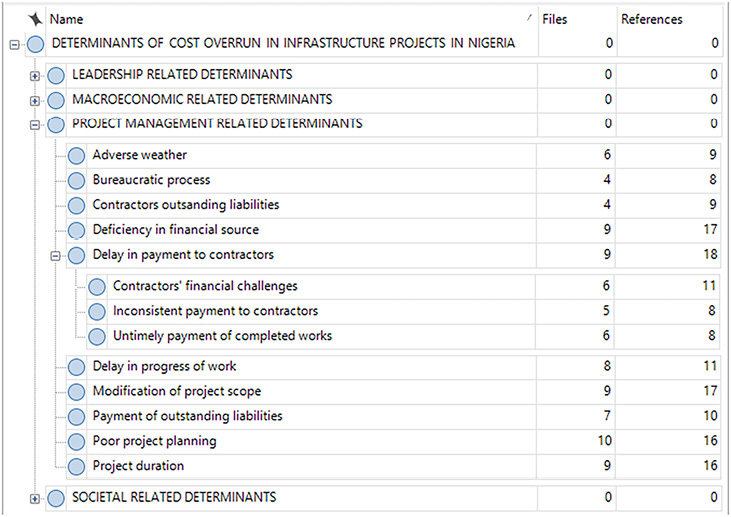
Figure 1. Nvivo screen that shows hierarchical grouping of themes


In the developed approach, saliency analysis framework advocated by Buetow (2010) was adopted to ensure that the analysis incorporates information that is both salient and frequent in the data. This aid in the identification of themes that are important and prevalent. For instance, statements (coded information) that highlighted the importance of a concept or issue such as “this is a major challenge”, “the main reason” and “this is a very big problem” are considered salient and highly important, regardless of their frequency of occurrence within the data. Consequently, codes that emerge frequently are noted as frequent. In contrast, themes that were not salient or prevalent were not considered for further analysis. An illustration of such emphasis on the theme “communities’ opposition to projects” is presented by the following statement: “One of the major challenges we are facing is the resistance from some communities. Some of the communities are not happy with the idea of providing some of the additional structures because they feel that their communities, properties and even their livelihood will be affected”.
Identifying causal relationships between aggregated themes
This phase aligns with steps iv and v of thematic analysis framework as outlined by Braun and Clarke (2006). It involves a detailed articulation of causal relationships from interviewees mental model, with the data undergoing thorough analysis to document any causal connections referenced within the DS. When determining a causal relationship between aggregated themes, a unit of analysis was considered- a distinct statement in the DS indicating a causal link between two codes, reflective of the participant’s mental model within the same paragraph. Such statements, usually providing insight into the system’s behaviour, is not constrained by the category of the determinants but is identified based on clear causal attributions present in the data. For instance, a causal relationship could be between a societal related theme and those related to project management, macroeconomic or leadership.
To establish and document the causal relationships and their connection to the DS, CAQDAS, specifically Nvivo 12 was used. This tool ensures that both the causal relationships and their associated data source references are preserved with the software. Such as organisation facilitates easy conversion of causal relationships to causal links and ultimately CLDs in the subsequent phase. Furthermore, Nvivo 12 is crucial for validating the representation of participants’ mental models through these identified relationships.
During the coding process, the researcher/coder identified indicators within the data- terms like “because”, “then”, “if”, “so”, and “so as” - which suggest causality related to the system’s behaviour, complemented by the researcher/coder’s overall understanding of the causal relationships articulated by the participants. For instance, a statement with indicators that infer a causal relationship (between project duration and fluctuation in prices of materials, labour and equipment) is shown below. “Participant 05” represents interviewee number 5 from a contractor organisation, and “PDn-FPMLE” represents the causal relationship between “project duration and fluctuation in prices of materials, labour and equipment”.
“Whenever we have significant time lag which often happen on most of the projects, we usually experience a rise in the prices of the resources because of the accompanying extension of time of delivering the project” [Participant 05_Co: PDn- FPMLE].
In addition to recording causal relationships with Nvivo 12, coding charts were developed based on the established causal relationships after further data analysis. Each chart was assigned a Reference Identification Codes (RIC), denoting thematic categories and associated causal themes), along with Data Source Identification (DS ID) codes, correlating to the causal relationships of the themes. Additionally, each chart lists the relevant information to the respective interviewee(s). Using these charts, data was broken down into segments, each encapsulating a single causal relationship within the same paragraph, along with supporting data extracts. This process reinforces the validity and transparency of the coding process. An example of such chart, illustrating the relationship between “adverse weather and delay in progress of work” along with RIC and DS ID code, and the data extracts that support the causal relationship, is presented in Table 6. “Participant 08_Cl”, the eight (8) interviewee from a client organisation, is associated with a code “PM: -AW-DPW”, signifying the identified causal connection between “adverse weather and delay in progress of work” within the category of project management related determinants.
| Data Source ID: [Participant 08_Cl]RIC: PM: -AW-DPW | |||
|---|---|---|---|
| Main Statement: There is always an impact on the progress of work whenever the rainy season sets in because there is the need to halt site operation to allow for the wet surface to dry off. | |||
| Causal structure | Cause variable: | Adverse weather | Project management related determinants |
| Effect variable: | Delay in progress of work | ||
| Relationship type: | Positive | ||
| Variable behaviour | Cause variable | Adverse weather | |
| Effect Variable | Further delay | ||
| Information Source: Comments observed from all the interviewees relevant to the causal relationship about the project management related determinants of cost overrun with indicators such as “then”, and the general understanding of a causal expression by the interviewee. Themes: Adverse weather, Delay in progress of work | |||
Supporting data extract
“The weather, even though in some regions like the south-west and south-south, slows the pace of work on site because, once it is raining particularly the kind of heavy downpour we experience when on site, there is no possible way we can lay the asphalt and in most cases this rain comes in heavily and can last for a day or more. That alone is a serious problem. It has significant impact on the project. Anytime it rains, then of course, we have to halt work at the site for that period even though, we projected and accommodated the likely impact of the rainy season earlier on” [Participant 08_Cl: AW-DPW].
Transforming the coding charts into CLDs
This phase involves converting the coding charts from step 3 into visual representations of causal links and, eventually CLDs. It is important to recognize that CAQDAS tools like Nvivo 12 do not facilitate the visualization of these relationships. Therefore, we utilize system dynamics modelling software such as Vensim, for this purpose. The coding charts, which detail individual causal relationships from the data., are methodically transformed into causal links. These links are then connected to create CLDs that encapsulated insights into the system’s structure and behaviour. To achieve this, each causal relationship defined in the coding charts is scrutinized individually to construct the individual causal links. These links, representing cause and effect relationships regardless of the determinant category, encapsulate the aggregated interpretations of the individual mental models regarding the determinants that influence cost overruns. For instance, Table 7 illustrates the conversion of coding charts into causal links that depict the relationship between “community opposition to projects and stakeholder involvement”.
| Causal Links | ||
|---|---|---|
| Community opposition to projects | +
|
Stakeholder involvement |
Additionally, Figure 2 illustrates the resultant CLD, focusing on societal related determinants. It is noteworthy that the dotted line connections in the diagrams signify interactions across different categories of determinants.

Figure 2. Transformation of causal links into CLD (societal related determinants)
Subsequently, a composite CLD is created by merging all the cause-and-effect representations, to understand the overall determinants influencing cost overrun in road infrastructure projects in Nigeria, as illustrated in Figure 3. This integrated network of relationships produced six feedback loops: four reinforcing (positive) loops and two balancing (negative) loops.
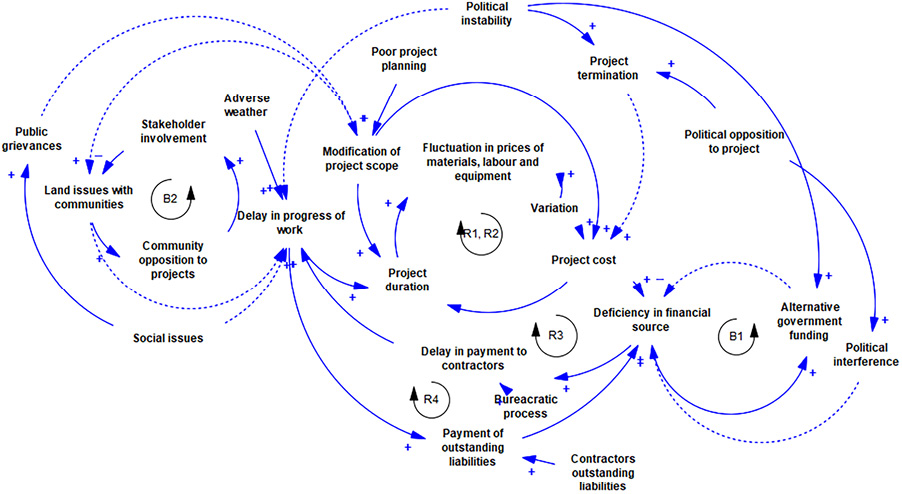
For instance, Balancing Loop B1 demonstrates the dynamics between deficiency in financial source and alternative government funding. This loop act to counteract the effect of Reinforcing Loop R3, which suggests that funding issues associated will be significantly improved. Loop B1 captures how funding challenges, intensified by a combination of backlog of contractors’ outstanding liabilities and political interference, creates a demand for alternative government funding the budgetary allocation to improve project financing. The need becomes especially pertinent when the government are inclined to provide financial support. Consequently, the introduction of this alternative funding source tends to alleviate the financial constraints of projects, thereby effectively closing the loop.
Retaining links between CLDs and data source
This final phase involves linking the CLD, created in step 4, to the relevant data sources. To establish a strong connection between the CLD and the DS, a DS reference table was created. This table reinforce the validity of the CLD by preventing any disconnection due to the data’s transformation into causal links and, subsequently CLDs. This phase is supported by initially establishing relationships in Nvivo 12 and associating them with the data sources, thereby maintaining consistent references. RICs are assigned to each data segment denoting a causal relationship, and DS ID codes are linked to the corresponding causal relations derived from the participants’ mental models. Subsequently, a DS reference table is created with columns representing all causal relationships, paired with their corresponding DS ID codes and RICs. This arrangement allows for the cross-referencing of causal links with their DS ID codes and RICs.
Although, there is no single best practice for constructing this table, ensuring transparent and systematic linkages is essential. To trace the origins of a CLD segment back to the DS, one would start with, identifying the causal relationship and category of determinants. Then, by referring to the DS ID code, the original data segment from the participant’s contribution can be located. Such a DS reference table not only guides to the specific data extracts that contributed to the CLD but also proves invaluable for tracking the representation of particular data segments within the CLD. For instance, Table 8 illustrates a DS reference table that details the causal connection between “adverse weather” and “delay in progress of work”, along with the relevant RICs and DS ID codes.
Conclusion
This study presents an innovative coding approach for SD model conceptualisation, which integrates the principles and elements of established coding frameworks, thereby harnessing their strengths. This approach anchors its coding process in the principles of thematic analysis, augmented by saliency analysis and case study approach to extract causal relationships explicitly from qualitative data and used CAQDAS and a DS reference table to ensure a transparent and strong linkage between the resultant CLD and original data sources. The framework was subsequently applied to analyse qualitative data from interviews with multidisciplinary stakeholders involved in road project development in Nigeria. This analysis facilitated the extraction of causal relationships, and thus develop a conceptual model capturing the intricate interplay of key determinants contributing to cost overrun in Nigerian road infrastructure projects.
The developed coding approach offers systematic, rigorous, and well-documented framework for coding qualitative data during model conceptualisation. It provides a transparent process by explicitly detailing how each data segment connects with the causal relationships and structures derived from it. This transparent connectivity between the DS and resultant CLD augments the credibility of the conceptual model, positioning it as a foundational step in the formal SD modelling process.
In the broader realm of knowledge contribution, the methodological rigor of the data analysis, utilizing the bespoke coding framework, offers a solid foundation for developing a credible theoretical model from qualitative data. This is achieved by a rigorous coding procedure that identifies causal attributions, and ultimately links the developed causal model directly to its originating data.
However, it is vital to acknowledge that this framework is specifically tailored for analysing qualitative data aimed at model conceptualisation. Future work will aim to extend its application to diverse sectors within Nigeria and internationally, applying the same coding framework to identify any parallels or disparities with this study’s findings. Additionally, this research direction aims to encourage the use of alternative theory-building approaches within the construction management research domain.
References
Braun, V. and Clarke, V., 2006. Using thematic analysis in psychology. Qualitative Research in Psychology, 3(2), pp.77-101. https://doi.org/10.1191/1478088706qp063oa
Bryman, A., 2012. Social Research Methods 4th ed. Oxford: Oxford University Publishing.
Buetow, S., 2010. Thematic Analysis and Its Reconceptualization as ‘Saliency Analysis’. Journal of Health Services Research & Policy, 15(2), pp.123-25. https://doi.org/10.1258/jhsrp.2009.009081
Datta, S.D., Sobuz, M.H.R., Nafe Assafi, M., Sutan, N.M., Islam, M.N., Mannan, M.B., Akid, A.S.M. and Hasan, N.M.S., 2023. Critical project management success factors analysis for the construction industry of Bangladesh. International Journal of Building Pathology and Adaptation, Vol. ahead-of-print No. ahead-of-print. https://doi.org/10.1108/IJBPA-01-2022-0006
DiCicco‐Bloom, B. and Crabtree, B.F., 2006. The Qualitative Research Interview. Medical education, 40(4), pp.314-21. https://doi.org/10.1111/j.1365-2929.2006.02418.x
Eisenhardt, K.M., 1989. Building Theories from Case Study Research. The Academy of Management Review, 14(4), pp.532-50. https://doi.org/10.5465/amr.1989.4308385
Eker, S. and Zimmermann, N., 2016. Using Textual Data in System Dynamics Model Conceptualization. Systems, 4(3), p.28. https://doi.org/10.3390/systems4030028
Federal Ministry of Works Nigeria, 2019. List of Ongoing Federal Highway Projects. Nigeria: Federal Ministry of Power Works and Housing Nigeria. https://worksandhousing.gov.ng/management/uploads_images/1562351340.pdf. [Accessed 19 September 2020].
Forrester, J.W., 1992. Policies, Decisions and Information Sources for Modeling. European Journal of Operational Research, 59(1), pp.42-63. https://doi.org/10.1016/0377-2217(92)90006-U
Kim, H. and Andersen, D.F., 2012. Building confidence in causal maps generated from purposive text data: mapping transcripts of the Federal Reserve. System Dynamics Review, 28(4), pp.311-28. https://doi.org/10.1002/sdr.1480
Kvale, S. and Brinkmann, S., 2009. InterViews: Learning the Craft of Qualitative Research Interviewing. Thousand Oaks, CA: Sage.
Luna‐Reyes, L.F. and Andersen, D.L., 2003. Collecting and analyzing qualitative data for system dynamics: methods and models. System Dynamics Review, 19(4), pp.271-96. https://doi.org/10.1002/sdr.280
Mahmud, A.T., Ogunlana, S.O. and Hong, W.T., 2020a. Understanding the Driving Factors of Cost Overrun in Highway Projects in Nigeria: A Systems Thinking Approach. In: A. Damci, C. Budayan and S. Ulubeyli, 6th International Project and Construction Management Conference (e-IPCMC2020). Istanbul Technical University, Istanbul, Turkey, 12-14 November, 2020.
Mahmud, A.T., Ogunlana, S.O. and Hong, W.T., 2020b. Understanding the Dynamics of Cost Overrun Triggers in Highway Infrastructure Projects in Nigeria. Journal of Financial Management of Property and Construction, in press. https://doi.org/10.1108/JFMPC-07-2020-0051
Nguyen, N., Beeton, R. and Halog, A., 2015. A systems thinking approach for enhancing adaptive capacity in small- and medium-sized enterprises: causal mapping of factors influencing environmental adaptation in Vietnam’s textile and garment industry. Environment Systems and Decisions, 35(4), pp.490-503. https://doi.org/10.1007/s10669-015-9570-5
Ogbu, C.P. and Adindu, C.C., 2019. Direct risk factors and cost performance of road projects in developing countries. Journal of Engineering, Design and Technology, 18(2), pp.326-42. https://doi.org/10.1108/JEDT-05-2019-0121
Rabinovich, M. and Kacen, L., 2010. Advanced relationships between categories analysis as a qualitative research tool. Journal of Clinical Psychology, 66(7), pp.698-708. https://doi.org/10.1002/jclp.20693
Repenning, N.P. and Sterman, J.D., 2002. Capability Traps and Self-Confirming Attribution Errors in the Dynamics of Process Improvement. Administrative science quarterly, 47(2), pp.265-95. https://doi.org/10.2307/3094806
Sa’id, A.N., 2019. A Framework for Collaborative Costing in the Uk Construction Industry. PhD, Nottingham Trent University.
Sterman, J.D., 2000. Business Dynamics: Systems Thinking and Modeling for a Complex World. New York, USA: McGraw-Hill.
Turner, B., Tedeschi, L., Gates, R., Nichols, T., Wuellner, M. and Dunn, B., 2013. Investigation into Land Use Changes and Consequences in the Northern Great Plains Using Systems Thinking and Dynamics. In: R. Eberlin and I.J. Martinez-Moyano, 31st International Conference of the System Dynamics Society. Cambridge, MA, USA, 21-25 July, 2013: System Dynamics Society.
Turner, B.L., Kim, H. and Andersen, D.F., 2013. Improving coding procedures for purposive text data: researchable questions for qualitative system dynamics modeling. System Dynamics Review, 29(4), pp.253-63. https://doi.org/10.1002/sdr.1506
Ullah, M., 2012. Enhancing the understanding of corruption through system dynamics modelling: a case study analysis of Pakistan. PhD, Department of Information Systems and Operations Management, University of Auckland.
Yearworth, M. and White, L., 2013. The uses of qualitative data in multimethodology: Developing causal loop diagrams during the coding process. European Journal of Operational Research, 231(1), pp.151-61. https://doi.org/10.1016/j.ejor.2013.05.002