Construction Economics and Building
Vol. 24, No. 4/5
December 2024
RESEARCH ARTICLE
Danish Contractor’s Application of the Budget: Identifying Purpose and Comparing the Budgets Application Level Across Job-Position
Søren Munch Lindhard
Department of the Built Environment, Aalborg University, Aalborg, Denmark
Corresponding author: Søren Munch Lindhard, Thomas Manns Vej 23, 9220 Aalborg,
sml@build.aau.dk
DOI: https://doi.org/10.5130/AJCEB.v24i4/5.8417
Article History: Received 17/10/2022; Revised 13/03/2023; Accepted 30/08/2024; Published 23/12/2024
Citation: Lindhard, S. M. 2024. Danish Contractor’s Application of the Budget: Identifying Purpose and Comparing the Budgets Application Level Across Job-Position. Construction Economics and Building, 24:4/5, 1–17. https://doi.org/10.5130/AJCEB.v24i4/5.8417
Abstract
The construction contractors compete in a low-profit industry, making cost-performance and the accuracy and application of the budget critical. Despite the importance of a highly effective cost management, how construction contractors apply the budget has only received little attention in research. To determine how construction contractors apply budgets, a questionnaire study has been conducted, which included 128 construction professionals from varying job-positions of whom 67 completed the survey, corresponding to 52.3%. The participants rated their budget application with regards to six categories. Afterwards a statistical analysis was applied to identify ranks, differences, and correlations between categories and across job-positions. A calculation of the Kendall’s Tau correlation revealed a positive ordinal correlation between the categories and their application, and a Friedman’s Rank test identified the following rank between the categories: managerial action, control, planning, motivation, communication and coordination. Finally, a multinomial regression analysis revealed that a higher hierarchical position entails a higher application of the budget for all categories but motivation. The new insights to budget application are highly relevant for construction professionals carrying out cost-management. The findings can be to make a better fit between application and the presentation of the budget, thereby strengthening the managerial capability of the budget.
Keywords
Contractors; Budget; Cost Management; Economy; Construction Management
Introduction
The profitability among construction contractors is in general low, compared to the manufacturing industry (Danmarks Statistik, 2022). In Denmark the profitability in the construction industry has been between 1.6 and 5.8 % for the last two decades with an average profitability at 3.9 % (Danmarks Statistik, 2022). The low profitability is caused by a high level of competition in the industry (Hillebrandt, Cannon and Lansley, 1995; Lo, Lin and Yan, 2007) and is one of the major causes of business failures (Mahamid, 2012). Additionally, Akintoye and Skitmore (1991) found that bigger companies tend to achieve a better financial performance due to improved managerial efficiency. Finally, Ling (2004), found that contractors being able to keep the budget on previous projects have a higher chance of keeping the budget on future projects. Ling (2004) found the same relationship with quality and time performance.
Wyke, Lindhard and Jensen (2024) studied cost and time overruns in Danish construction sites. They identified four primary latent factors influencing performance, one being a lack of project management. Improved managerial efficiency improves cost-, time- and quality performance, which seems relevant to the entire construction industry, considering its bad reputation with regard to construction project performance issues of cost-overruns, time-overruns and bad quality (Larsen, et al., 2018; Love, et al., 2019). There exist multiple causes and possible explanations to inefficient project management, one of them being inadequate planning, budgeting, and scheduling (Peel and Bridge, 1998; Salhab, et al., 2022). Budgeting, especially, is an issue. Contractors compete heavily on price. In order to win the tender, the contractor needs to be competitive on price. Determining an appropriate contribution margin is challenging because it is a trade-off between being high enough to maximize profit while still being low enough to maintain a possibility to win the bid (Yoon, Tamer and Hastak, 2015). In competitive bidding, the assumption is that the most cost-efficient contractor wins the tender, but most often it is just the most optimistic contractor, thus the contribution margin is low. The actual contribution margin will often be even lower than expected due to a tendency to underestimate the effects of project complexity, project dependencies and various risks (Yoon, Tamer and Hastak, 2015). Therefore, to ensure that the project remains profitable, the demand for well-functioning financial management is high.
Already from project start, the optimistic budget puts high pressure on project managers cost performance (Larsen, et al., 2015). The project manager is responsible for numerous different project related tasks, resulting all too often in an excessive workload (Love and Edwards, 2005). The high workload combined with the fact that economics is often outside the site- and project manager’s key competences can be a reason why budgeting and especially the budget follow-up is not given adequate focus (Lam, et al., 2001; Lam and Oshodi, 2015). Another downside is that most contractors do not have a link between the controlling process and the budget and cost-estimation process (Yismalet and Patel, 2018). Thereby the contractors fail in providing detailed feedback and learning from the pricing of subsequent bids, which decreases the accuracy and reliability of future project budgets. This is critical because construction contractors are in a highly competitive industry with low profitability and low room for error, making the accuracy of the budget and the estimation of costs critical (Elmousalami, 2020).
According to Peel and Bridge (1998), there is a positive relationship between the quality of the budget and the company’s economic performance. The contractors’ big issue with low returns and big budget overruns testify to inadequate budgeting, which needs to be improved (Estemadi, Koosha and Salari, 2018). This trend has persisted for at least two decades, where Mutti and Hughes (2002), previously found that poor budgeting and lacking control of finances is one of the major reasons for the high level of bankruptcies among construction contractors.
Therefore, as a first step, the present research explores how budgeting is currently applied in the industry. The archived knowledge can be used to create a fit between the design of the budget and how it is applied to thereby strengthen managerial capabilities of the budget and the cost performance of the company.
The budget is part of the internal financial management and contains a specification of the financial effects of the approved actions the company implements in upcoming periods, thus through the budget the company attempts to predict future accounts and ensure the company’s profitability. Budgeting consists of two primary phases: Preparation, and Execution. A construction company will develop multiple budgets with different foci. Of course an overall budget is needed, but each construction project will have its own budget.
It is vital to any company to be able to plan and to forecast their economic performance, both at company level and at project level (Abou-Ibrahim, et al., 2019). The budget preparation is an attempt to make such a plan. Often the budget is based on experiences from previous performances which, combined with industry forecasts and marked trends, are used to predict price- and activity levels summed up as a forecast to the expected economic performance. Douglas (1994) emphasizes the importance of the budgeting preparation itself. During the budgeting process future opportunities are revealed and evaluated in relation to possible risk and rewards; the result is the budget. In the budget, focus areas are carefully prioritized and resources are being deployed in relation to company objectives and goals. Thus, the budget creates an economic overview of the planned operations and its implications.
The budget preparation can be used as an instrument to create motivation, by involving the employees and giving them co-influence and responsibility for meeting the budget (Mahlendorf, Schäffer and Skiba, 2015). According to Arsalan, et al. (2018), this participative approach has a positive effect on budget and managerial performance.
After completing the preparation phase, the approved budget serves as an instrument to communicate the expectations to performance together with future initiatives and objectives (Joshi, Al-Mudhaki and Bremser, 2003). Moreover, the budget and its included performance measurements creates communication across branches of the company, where it provides guidance and discussions of activities and results (Melkers and Willoughby, 2005). The budgets prioritizing of resources and the associated and planned actions is the outset for the budget execution phase which includes coordination of future tasks. Applying the budget as an overall guideline helps the company to ensure common corporate goals.
The execution phase refers to the execution of the budget. In this phase the planned activities are completed in accordance with the assigned funds. To follow the performance, the budget is regularly compared with actual results to identify deviations from the budget (Joshi, Al-Mudhaki and Bremser, 2003). This way, the budget serves as an economical control mechanism. Continuously monitoring the budget, gives an early warning to economical deviation, which improves cost awareness and enables early managerial actions to correct and control the performance (Raghunandan, Ramgulam and Rahunandan-Mohammed, 2012). Therefore, budgetary control leads to improved financial performance (Adongo, 2013). Moreover, Willoughby and Melkers (2000) found that performance measurements like the budget is essential to support managerial actions and communication.
From the above description it is evident that the budget serves, besides the economical aspect, many other purposes. In the present research, the application of the budget has been divided into six key purposes: planning, managerial actions, control, coordination, communication, and motivation. The identified purposes align with Raghunandan, Ramgulam and Rahunandan-Mohammed (2012), Schack (2006), and Shim, Siegel and Shim (2012), who all argue to the different purposes of budgeting.
As revealed, the budget can be applied for many different purposes. The actual application depends on the manager and the approach to managing. The central elements in successful management are to ensure cost, time, and quality performance.
Chua, et al. (1997) found eight primary factors affecting budget performance: the most relevant includes number of organizational levels, project managers experience, design completion level, constructability, turnover rate, budget meeting frequency, frequency of budget updates and budget control system. There exists a link between cost performance and budget performance since budget performance basically is an estimate of comparing budgeted cost with actual costs (Chua, Kog and Loh, 1999). Iyer and Jha (2005) based on a series of success factors, identified the most important cost drivers related to the project manager’s competences. Sinesilassie, Tabish and Jha (2018) found that an increased experience level of the project manager increases understanding of the scope of work which improves cost performance.
Enshassi, Al-Najjar and Kumaraswamy (2009) highlights collaboration and coordination between project management and contractors as a key aspect of improving cost performance. This is in accordance with Anumba and Evbuowan (1999), who found that communication difficulties and disruptions during a construction project result in increased unnecessary expenditures and subsequent cost overruns. Frimpong, Oluwoye and Crawford (2003) finds that cost performance can be improved by improving project planning, controlling, and monitoring. Chua, Kog and Loh (1999) finds that the overall success of a project is a combination between the competences of the project manager, the monitoring and control efforts, the project characteristics, and contractual agreements. Finally, Sinesilassie, Tabish and Jha (2018) find that regular control meetings with focus on controlling and reviewing progress and creating room for discussion increases the chance for keeping within budget. In conclusion, improved budget management improves project economic performance (Peel and Bridge, 1998; Famakin and Saka, 2011; Wyke, Lindhard and Larsen, 2024).
Despite the well documented importance of a well-functioning budget (Chua, Kog and Loh, 1999; Frimpong, Oluwoye and Crawford, 2003) and its various application purposes, limited attention has been given to understanding how the budget is applied. Creating and understanding how the budget is applied is essential for both top management and the financial department, because it can serve as input to optimize the budget. This takes into consideration the effort which goes into cost estimation, to improve its planning, managerial and control capability, but also how the budget is presented to improve its coordination, communication and motivation capability. In general an improved understanding of budget application is helpful in creating a fit between the budget and its application, leading to improved profitability (Famakin and Saka, 2011).
The present study seeks to fill this research gap by identifying the overall application levels. Anecdotal evidence suggests that budget applications may depend on managerial position. Therefore, besides creating an overall baseline, the study aims to identify differences in application across management positions, i.e., site-managers (SM), project managers (PM), chief project managers (CPM) and heads of departments (HOD). Budget application is studied with outset in the previously identified purposes. Knowing how the budget is currently applied across management positions will create a basis for future studies looking in more detail into actual application and application patterns.
Method
The research consisted of four primary phases: 1) Identification of application purposes of the budget, 2) Constructing the survey, 3) Ensuring validity and 4) Analysing the results. The research methodology is illustrated in Figure 1.
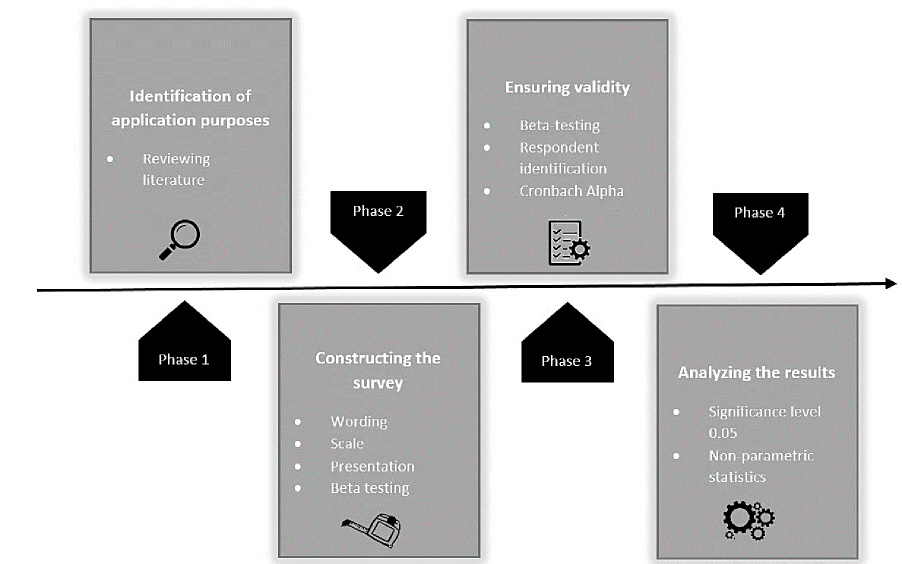
Figure 1. The research methodology
Throughout a literature review, six primary purposes of the budget were identified including: planning, managerial action, control, coordination, communication, and motivation. To determine how construction contractors apply budgets, an online survey was carried out. The questionnaire was designed as an explanatory approach to map the tendencies in the industry. In the survey the participants were asked to state their position (SM, PM, CPM or HOD), and to rate their budget application in relation to each of the six purposes. This design enables a cross comparison between job-position and the different application purposes and levels.
The questionnaire is designed with outset in the guidelines presented in Forza (2002). In the guidelines, Forza (2002) identifies four key areas which need to be considered: Wording, Scale, Presentation, and Respondent identification.
Wording relates to how the questions are phrased; thus, a consistent terminology is ensured, and value-laden or leading questions are avoided, with each question formulated in a similar way using a similar scale. The scale was chosen to be a five point Likert scale, plus a do-not-know option. The scale used the following categories: Not at all (1), to a very small extent (2), to a small extent (3), to a large extent (4), to a very large extent (5). To ensure that the survey was properly presented, a standardized template was applied. As a part of the process, the questionnaire was beta-tested by three test-respondents whereafter interpretation and presentation were discussed with the respondents individually.
The survey is conducted within the construction industry in Denmark. All respondents are identified and selected based on employment. In the survey two groups of companies are selected: one containing contractors with a yearly turnover above 1 billion DKR (approx. 150 million USD) one containing contractors with a yearly turnover below 1 billion DKR (approx. 150 million USD). The companies were randomly selected resulting in 9 ‘big’ contractors and 11 ‘small’ contractors.
The administration to every contractor were contracted by telephone and asked for relevant email addresses for SM, PM, CPM, or HOD. Seven of the contractors were not willing to give out contract information. From the other 13, contract information of between 1 and 17 relevant employees was received; this added up to 128 email addresses.
The questionnaire strategy follows the one presented in Akintoye and Macleod (1997). Thus, the study was carried out as follows: First, an open invitation was sent out, followed by four weekly reminders to the respondents who had not completed the survey. Of the 128 respondents participating in the survey 67 (52.3%) completed, 10 (7.8%) were discharged as inadequate, and 51 (39.8%) were uncompleted. Thus, the survey is above the critical response rate of 50 % identified by Flynn, et al., (1990).
Validity
Several initiatives have been implemented in the study to ensure high validity and trustworthiness of the study. Trustworthiness, according to Guba (1981), is dependent on four perspectives:
- Truth Value, which relates to the confidence in the ‘truth’ of the findings.
- Applicability, which refers to which extent the results can be applied in other settings.
- Consistency, which concerns the possibility of replicating the study.
- Neutrality, which focuses on eliminating external biases.
The applied techniques are shown in Table 1, the techniques take outset in Krefting (1991), which describe several different initiatives for improving validity.
Finally, the data reliability was tested using Cronbach’s Alpha test. A value above 0.7 signals a high validity of the results (Santos, 1999). The Cronbach’s Alpha test is presented in Table 2 below:
| Position | Cronbach’s Alpha |
|---|---|
| HOD | ,554 |
| CPM | ,715 |
| PM | ,909 |
| SM | ,851 |
| Total | ,854 |
The most important value is the total value, which is above 0.7, but to show that the data to each position still represents a high validity these are calculated as well. Therefore, the conclusion is that the results can be generalized even though results only referring to the HOD must be used with care.
Applied statistics
All statistics are calculated with a significance level at 0.05, as recommended by Fellows and Liu (2008) and by Ayyub and McCuen (2003).
Because the research is based on survey results, no parametric assumption can be made, thus data analysis is based on non-parametric statistics. Non-parametric tests focus on rank. To make statistical conclusions regarding the rank in application level based on the six purposes, the Friedman’s Rank test is applied. The Friedman’s Rank test can be used to identify differences in the rank of several different categories. A Kruskal-Wallis test by ranks is carried out to identify if differences in the application level exist between different job-positions. The Kruskal-Wallis test by ranks is used to compare several categories, but it only indicates that a significant difference exists, thus it is used to identify which categories there should be further investigated. Afterwards, the categories are compared pairwise to identify between which positions the significant difference lay. The pairwise comparison is carried out by using a Mann-Whitney test. Kendall’s tau was applied to identify correlations between the positions. Kendall’s tau is used to identify the relationship between two ordinal variables (like survey data). Finally, a regression analysis between the different positions is performed using a multinomial approach, which is preferred when comparing the application level across different positions.
Results
Ranking the six purposes
The overall application level of the budget is identified by testing for the actual rank of the six purposes (planning (PL), managerial action (MA), control (CT), coordination (CD), communication (CM), and motivation (MO)). The rank is calculated both overall but also with regard to the organizational position by conducting a Friedman’s rank test, see Table 3.
| PL | MA | CT | CD | CM | MO | ||
|---|---|---|---|---|---|---|---|
| HOD | Friedman | 3.75 | 5.46 | 4.46 | 2.00 | 2.96 | 2.38 |
| Rank | 3 | 1 | 2 | 6 | 4 | 5 | |
| CPM | Friedman | 4.05 | 4.48 | 4.16 | 2.70 | 2.32 | 3.30 |
| Rank | 3 | 1 | 2 | 5 | 6 | 4 | |
| PM | Friedman | 4.30 | 3.93 | 4.05 | 2.30 | 2.45 | 3.98 |
| Rank | 1 | 4 | 2 | 6 | 5 | 3 | |
| SM | Friedman | 3.65 | 4.38 | 4.04 | 2.62 | 2.54 | 3.77 |
| Rank | 4 | 1 | 2 | 5 | 6 | 3 | |
| Total | Friedman | 4.00 | 4.46 | 4.15 | 2.43 | 2.51 | 3.44 |
| Rank | 3 | 1 | 2 | 6 | 5 | 4 |
Table 3 shows the application of the budget in relation to position. The total ranking of the parameters reveals the budget is primarily used for management followed by control, planning, motivation, coordination, and communication as the subsequent ranks.
Based on the findings from the rank test, the identified differences have been tested using a Kruskal-Wallis test by ranks to identify which of the differences in rank between organizational positions are statistically significant. The test showed significant differences between different positions in relation to managerial action (sig .011), control (sig .032), coordination (sig .049) and communication (sig .046). Finally, to identify where the difference lay the position is compared pairwise using a Mann-Whitney U test. The results are shown in Table 4.
| PL | MA | CT | CD | CM | MO | |
|---|---|---|---|---|---|---|
| HOD vs. CPM | ||||||
| Mann-Whitney U | 93,000 | 102,000 | 125,500 | 125,000 | 92,500 | 110,000 |
| Z | -1,462 | -1,166 | -,248 | -,267 | -1,502 | -,837 |
| Sig. | .168 | .292 | .817 | .817 | .157 | .444 |
| HOD vs. PM | ||||||
| Mann-Whitney U | 130,500 | 45,000 | 74,500 | 79,500 | 65,500 | 116,000 |
| Z | -,055 | -3,278 | -2,155 | -1,942 | -2,469 | -,605 |
| Sig. | .958 | .001 | .037 | .058 | .015 | .582 |
| HOD vs. SM | ||||||
| Mann-Whitney U | 130,500 | 45,000 | 74,500 | 79,500 | 65,500 | 116,000 |
| Z | -,084 | -1,031 | -1,857 | -1,808 | -2,128 | -,675 |
| Sig. | .936 | .347 | .077 | .087 | .040 | .538 |
| CPM vs. PM | ||||||
| Mann-Whitney U | 175,500 | 140,000 | 151,000 | 153,000 | 181,000 | 226,000 |
| Z | -1,634 | -2,592 | -2,293 | -2,186 | -1,507 | -,398 |
| Sig. | .102 | .010 | .022 | .029 | .132 | .690 |
| CPM vs. SM | ||||||
| Mann-Whitney U | 115,500 | 123,000 | 91,500 | 92,500 | 113,500 | 138,000 |
| Z | -,992 | -,733 | -1,898 | -1,826 | -1,081 | -,179 |
| Sig. | .353 | .511 | .079 | .085 | .319 | .880 |
| PM vs. SM | ||||||
| Mann-Whitney U | 138,500 | 116,500 | 142,000 | 137,000 | 137,000 | 138,500 |
| Z | -,159 | -,940 | -,036 | -,212 | -,214 | -,161 |
| Sig. | .880 | .371 | .987 | .853 | .853 | .880 |
*The showed two-tailed significance levels are uncorrected; thus, the chance of the difference occurring simultaneously is lower
The Mann-Whitney U test presented in Table 4, revealed several incidents where the application of the budget is dependent on the position. When the Z score is negative the higher position is having a significantly higher application level, while a positive Z score is indicating the opposite (Field, 2009). Thus, all identified significant differences suggest that a higher position increases the application level of the budget. The revealed significant differences were:
- HOD vs. CPM: Managerial action, control, and communication
- HOD vs. SM: Communication
- CPM vs PM: Managerial action, control, and coordination.
Interrelationship between the six purposes
The interrelationships between the six purposes are investigated by conducting first a correlation test and then a multinomial regression analysis. In the correlation test, interrelationships are identified, while the regression analysis is used to pairwise identify the strength and actual relationships. Kendall’s Tau correlation coefficient was calculated to identify interrelationships between the different positions’ application of the budget. Kendall’s Tau is recommended when having a small dataset with multiple tied ranks (Field, 2009). The results can be seen in Table 5.
| PL | MA | CT | CD | CM | MO | Position | |||
|---|---|---|---|---|---|---|---|---|---|
| Kendall’s Tau | PL | Correlation | 1.000 | .399 | .307 | .256 | .218 | .316 | -.054 |
| Sig. (2-tailed) | . | .000 | .002 | .010 | .029 | .002 | .595 | ||
| MA | Correlation | .399 | 1.000 | .592 | .382 | .348 | .249 | -.268 | |
| Sig. (2-tailed) | .000 | . | .000 | .000 | .001 | .014 | .009 | ||
| CT | Correlation | .307 | .592 | 1.000 | .229 | .307 | .381 | -.280 | |
| Sig. (2-tailed) | .002 | .000 | . | .024 | .002 | .000 | .006 | ||
| CD | Correlation | .256 | .382 | .229 | 1.000 | .647 | .271 | -.240 | |
| Sig. (2-tailed) | .010 | .000 | .024 | . | .000 | .007 | .018 | ||
| CM | Correlation | .218 | .348 | .307 | .647 | 1.000 | .419 | -.261 | |
| Sig. (2-tailed) | .029 | .001 | .002 | .000 | . | .000 | .010 | ||
| MO | Correlation | .316 | .249 | .381 | .271 | .419 | 1.000 | .039 | |
| Sig. (2-tailed) | .002 | .014 | .000 | .007 | .000 | . | .704 | ||
| Position | Correlation | -.054 | -.268 | -.280 | -.240 | -.261 | .039 | 1.000 | |
| Sig. (2-tailed) | .595 | .009 | .006 | .018 | .010 | .704 | . | ||
The correlation test shows a significant negative correlation between position and the application of the budget in relation to: managerial action, control, coordination, and communication. The reverse correlation is caused by the data definition where increasing value equals decreasing position. Therefore, the results indicate a positive relation between application of the budget and increasing position. Moreover, it is found that all parameters are positively related; thus, increased application of the budget in relation to, for instance, managerial action, also leads to increased application of the budget in relation to planning, control, communication, coordination, and motivation.
The correlation values range is between -1 and 1, where -1 is a perfect negative correlation, 0 is no correlation, and 1 is a perfect positive correlation. Moreover, Cohen (1988) found that, a correlation value of 0.1 constitutes a small correlation, a correlation value of 0.3 constitutes a medium correlation, while a correlation value of 0.5 constitutes a high correlation. Thus, a high positive correlation is found between:
- Application of the budget to coordination and communication (.647)
- Application of the budget to control and management (.592)
Finally, a regression analysis between the different positions is performed. Because the dependent variable is categorical with five nominal values, a multinomial approach is taken to calculate the odds-ratio (OR) (Field, 2009). In a multiple approach each of the independent variables are calculated as a function of the dependent variable. Thus, the calculated coefficient expresses the degree of dependence between the independent and dependent variable. An OR above 1 is indicating a high likelihood of increased application while an OR below 1 is indicating a low likelihood of an increased application. The results are shown in Table 6.
| HOD vs. CPM | HOD vs. PM | HOD vs. SM | CPM vs. PM | CPM vs. SM | PM vs. SM | |
|---|---|---|---|---|---|---|
| PL | Low | Neutral | Neutral | High | High | Neutral |
| MA | High | 5.320 | 4.160 | 2.429 | High | Neutral |
| CT | Neutral | High | High | 2.580 | 2.815 | Neutral |
| CD | Neutral | High | High | 2.340 | 2.293 | Neutral |
| CM | High | 3.053 | 3.028 | High | High | Neutral |
| MO | Neutral | Neutral | Neutral | Neutral | Neutral | Neutral |
The regression analysis revealed nine significant paired relationships. The highest OR is between HOD and PM and tells us that the HOD is 5.320 times more likely to apply the budget for managerial action perspectives than the PM. Moreover, the regression analysis revealed a general tendency where increasing positions equals a general increased application of the budget. This with exception of the application of budget to ensure motivation, where it seems to be applied equally despite the position.
The OR is a calculation between the odds of two different outcomes. Thus, an OR of 1 indicates identical odds. An OR of 2.0 indicates a low effect, an OR of 3.0 indicates a moderate effect, while an OR of 4.0 or above is indicating a strong effect (Ferguson, 2009). Thus, a strong OR was found between:
- HOD vs. PM (Managerial action)
- HOD vs. SM (Managerial action)
Discussion
The budget is an important part of every contractor’s internal financial management. The application level of the budget across management positions has been examined in relation to six identified purposes: planning, managerial, control, coordination, communication, and motivation. A Friedman’s rank test between the six purposes revealed that the budget most often is used for managerial purposes, followed by control, planning, motivation, communication and finally coordination purposes.
Application levels
Managerial actions is the highest ranked category, with a Friedman score of 4.46. This finding is in accordance with Iyer and Jha (2005), which found that managements’ competences is the most influencing factor in relation to cost performance. Also, Wyke, Lindhard and Larsen (2024) highlight the importance of managerial performance finding that lack of management is one of the primary causes to low performance. A high performing management function has a high influence on a company’s profitability, and the ability for a construction project to meet budget-, time- and quality requirements (Cooke-Davies, 2004). The performances within these three parameters are often expressed as project success (Mir and Pinnington, 2014). The budget improves managerial performance by creating awareness of costs and quantities. Moreover, the budget follow-up helps in revealing cost or quantity deviations. A proactive and early detection of deviation is important for allowing corrective managerial actions. Inability to early detect and manage problems and deviation leads to project failure.
Control is found to be the second highest ranking category, with a Friedman score of 4.15. A budget fosters control when used to compare actual performance with budgeted performance. This process is important because it reveals deviations, based on which management needs to react by either updating the budget or making corrective actions. Therefore, budget control is the cornerstone in nearly all companies’ cost management approaches (Hansen, Nielsen and Özdemir, 2003).
Planning is the third highest ranking category, with a Friedman score of 4.00. Planning has three primary goals, according to Koteen (1997). First, the process of conducting planning helps a company in understanding its intentions, requirements, and goals. Second, it helps the company to prioritize resources by providing direction. Third, it provides guidance on how to meet the defined goals. Planning can be conducted in different levels of the organization (i.e., strategic, operational, and tactical); all are important to the profitability of the company (Donkor, Donkor and Kwarteng, 2018; Larsen, et al., 2015). The budget can, in all organizational levels, be used to meet Koteen’s three goals. The budget is a central part of the planning, where the budget preparation process includes discussion and prioritization of resources to future activities.
Ranked four is the use of budgets to create motivation, with a Friedman score of 3.44. Motivated employees are important because motivation increases work engagement (Macey, et al., 2009) which leads to increased performance. Motivating and engaging people in their work is complex. This is because the motivational factors are individual to each person. Some guidance can be found in expectancy theory, which states that people tend to act towards self-interest. Thus, to be motivated, an increased effort by an employee should improve the expected outcome to that person in a preferable way (Isaac, Zerbe and Pitt, 2001). Good leadership enhances job motivation; a good leader knows how and what motivates his employees. A participative budgeting approach will have a positive effect on some employees, while others get motivated by increased freedom and responsibility for keeping the budget, and others gets motivated by the job enlargement or job enrichment which follows from the increased responsibility and finally others get motivated by career development opportunities or awards and bonuses linked to their performance.
Ranked five is the budget when applied as an instrument to communicate, with a Friedman score of 2.51. The budget is the company’s overall financial plan, and it is important that it is used to communicate and inform all departments regarding their financial constraints. The ability to communicate and share information is essential for any company both horizontally on the same organizational level and vertically across hierarchical positions. The requirement for effective communication is especially high in construction, because PMs must deal with large amounts of information from various stakeholders (Alaloul, Liew and Zawawi, 2016). The budget is a precise and effective approach to communicate economical expectations.
Ranked six is the application of the budget as a coordination tool, with a Friedman score of 2.43. Coordination is a necessity for ensuring common corporate goals. Coordinating, making decisions and developing future actions from a common basis (i.e., the budget), ensures alignment between departments and links plans to actions; the budget is a major factor when coordinating and prioritizing future resources and tasks. The overall ability to coordinate tasks is essential in construction management where all stakeholders, to ensure a successful delivery, must efficiently coordinate their activities both before and during construction. The budget is an efficient management tool when applied as guidance during task coordination.
All six identified purposes are important to a company’s performance. Based on the Friedman’s rank test the purposes can, based on the overall score, be divided into three groups. The top-ranking purposes with a Friedman score of 4.00 or above (i.e., managerial action, control, and planning), the medium ranking purposes with a Friedman score between 3.00 and 4.00 (i.e., motivation) and the low-ranking purposes with a Friedman score below 3.00 (i.e., communication and coordination). Small deviations exist between the organizational positions, but the overall picture remains the same.
The budgets application to support the different purposes is in accordance with the literature and emphasizes the key purpose of the budget as being a financial instrument where the planning and controlling is done to create a sufficient basis for managerial decisions to lead the company in the right direction (Willoughby and Melkers, 2000; Frimpong, Oluwoye and Crawford, 2003; Sivabalan, et al., 2009; Uyar and Bilgin, 2011; Lidia, 2014); corresponding to the three high ranking purposes.
The current application level has an important implication for practitioners by providing relevant input to the budget preparation phase, as current application levels can be a basis from which new initiatives are launched to either change or to utilize the current application patterns. For instance, can its coordination and communication applicability be improved by putting more effort into the guide which defines how to meet the defined goals, by defining individual roles and goals, or by explaining and justifying the prioritization of resources and tasks. Ensuring that there is a fit between the budget and its application will lead to improved performance and profitability (Famakin and Saka, 2011).
Differences in application
The results show a positive relationship between the six purposes, where an increase in one will induce an increase in the other five. From this follows that increasing budget application will increase application with regard to all six purposes. The strongest correlation was found between application for coordination and communication (0.647) and control and managerial action (.592), which indicates that these purposes have a closer relationship.
Communication is a necessity for coordination and good coordination is a necessity for project success (Alaloul, Liew and Zawawi, 2016). The term coordination is, according to the Cambridge Dictionary (Cambridge University Press, 2021) ‘the act of making all the people involved in a plan or activity work together in an organized way’ while communication is defined as ‘to share information with others by speaking, writing, moving your body, or using other signals’. Using the budget to coordinate tasks entails the sharing of information, plans and even the budget itself, therefore, communication is a central part of the coordination of tasks and responsibilities. This verifies the strong relationship identified between these purposes.
A classical definition of control is Fayol’s (2013), ‘Control of an undertaking consists of seeing that everything is being carried out in accordance with the plan which has been adopted, the orders which have been given, and the principles which have been laid down. Its objective is to point out mistakes in order that they may be rectified and prevented from recurring’ while management by Fayol (2013) is defined as: ‘to forecast, and to plan, to organize, to command, to coordinate and to control.’ The managerial action itself is the actual decisions made to command, coordinate, and control (The Britannica Dictionary, 2024). From the definitions it becomes evident that a part of control is about management and vice versa. If the budget is applied to rectify and prevent mistakes it is simply used as a managerial instrument, which verifies the strong relationship identified between these purposes.
Additionally, the statistical analyses revealed that higher position in the organization entails a higher application level of the budget on all parameters but one. The budgets application to create motivation is equal between all positions. The biggest difference was found between HODs and SMs or PMs regarding applying the budget for managerial issues. Fruitticher, et al. (2006), in a case study, found that the application level of budgets varies and that budgets are applied for different purposes depending on industry. To this can be added that budget application also depends on the hierarchical position in the company, where a higher position entails a higher application level. Thus, the budget is a more central part of top management work-life than in a PMs. Top-management needs to be aware of the application differences when making the budget and ensure that it easily serves the functions needed by lower management.
Conclusion
The contractor’s application of the budget has been examined across management positions to identify current application levels and differences in application depending on the placement in the company’s hierarchy. The application levels were examined through a questionnaire survey completed by 67 construction professionals working as either SMs, PMs, CPMs or HODs. The study ranked the budgets primarily by application which revealed (1) managerial actions followed by (2) control, (3) planning, (4) motivation, (5) communication and (6) coordination, but differences exist across job positions. For instance, PMs do primarily apply budgets for planning. Moreover, a comparison of applications across the six purposes revealed a positive relationship between all purposes.
Finally, it is found that the application level depends on hierarchical position, where a higher position entails a higher application level of the budget with regard to its application to manage, control, plan, communicate and coordinate tasks or responsibility. Only the budget’s application level to foster motivation among employees is found not to be affected by job position.
The created knowledge has several practical implications to managers across hierarchical positions. First of all, it can initiate a debate regarding the purpose and application of the budget. Secondly, it can initiate a process to either modify the budget, to fit and support how it is currently applied, or new initiatives can be launched to change the current application and behaviour of the managers, to make the budget fit the application level, and to make the application level fit the task and responsibility. Thus, a better fit between the budget and the application can be achieved, which improves the managing power of the budget, leading to improved profitability.
The present research has identified the current application of the budget based on and limited to a questionnaire study. The primary limitation to the study is its geographical limitation. The study only involved Danish contractors. Determining the application level in other geographical regions needs to be considered in future studies. Moreover, the findings could be strengthened by increasing the number of respondents. In future research a case study approach can be applied to create more detailed knowledge to the actual application of the budget. Moreover, future research could investigate differences in application across large, medium, and small contractors, and the relationship between how the budget is applied and the cost-performance could be examined. This could help construction managers to adjust the budget or the budget application for optimizing the company’s economic performance.
References
Abou-Ibrahim, H., Hamzeh, F., Zankoul, E., Lindhard, S.M. and Rizk, L., 2019. Understanding the planner’s role in lookahead construction planning. Production Planning and Control, 30(4), pp.271-84. https://doi.org/10.1080/09537287.2018.1524163
Adongo, K.O., 2013. Budgetary control as a measure of financial performance of state corporations in Kenya. International Journal of Accounting and Taxation, 1(1) pp.38-57.
Alaloul, W.S., Liew, M.S. and Zawawi, N.A.W.A., 2016. Identification of coordination factors affecting building project performance. Alexandria Engineering Journal, 55(3), pp.2689-98. https://doi.org/10.1016/j.aej.2016.06.010
Akintoye, A. and MacLeod, M., 1997. Risk analysis and management in construction. International Journal of Project Management, 15(1), pp.31-38. https://doi.org/10.1016/S0263-7863(96)00035-X
Akintoye, A. and Skitmore, M., 1991. Profitability of UK Construction Contractors. Construction Management and Economics, 9(4), pp.311-25. https://doi.org/10.1080/01446199100000025
Anumba, C.J. and Evbuowan N.F.O., 1999. Taxonomy for communication facets in concurrent life-cycle design and construction. Computer-Aided Civil and Infrastructure Engineering, 14(1), pp.37-44. https://doi.org/10.1111/0885-9507.00128
Arsalan, S., Saudi, M.H.M., Susiani, R. and Adison, A., 2018. Effect of participative budgeting, organizational commitment and work motivation on managerial performance (survey of motor vehicle dealers in Bandung). International Journal of Engineering and Technology, 7(4.34), pp.240-44. https://doi.org/10.14419/ijet.v7i4.34.23898
Ayyub, B.M. and McCuen, R.H., 2003. Probability, Statistics, and Reliability for Engineers and Scientists. Washington: Chapman and Hall/CRC press LLC. https://doi.org/10.1201/9780429258329
Cambridge Dictionary, 2021. Cambridge, UK: Cambridge University Press.
Chua, D.K.H., Kog, Y C., Loh, P.K. and Jaselskis, E.J., 1997. Model for construction budget performance – neural network approach. Journal of Construction Engineering and Management, 123(3), pp.214-22. https://doi.org/10.1061/(ASCE)0733-9364(1997)123:3(214)
Chua, D.K.H., Kog, Y.C., and Loh, P.K., 1999. Critical Success Factors for Different Project Objectives. Journal of Construction Engineering and Management, 125(3), pp.142-50. https://doi.org/10.1061/(ASCE)0733-9364(1999)125:3(142)
Cohen, J., 1988. Statistical Power Analysis for the Behavioral Sciences. 2nd ed. New York: Academic Press.
Cooke-Davies, T., 2004. Consistently Doing the Right Projects and Doing Them Right - What Metrics Do You Need? In: PMI® Global Congress 2004—EMEA, Prague, Czech Republic, 19-21 June. Newtown Square, PA: Project Management Institute.
Danmarks Statistik, 2022. Danmarks Statistik, Nøgletal i procent for regnskabsstatistik for byerhver efter regnskabsposter, branche og tid (REGN5A). Available at: https://www.statistikbanken.dk/20107.
Donkor, J., Donkor, G.N.A. and Kwarteng, C.K., 2018. Strategic planning and performance of SMEs in Ghana: The moderating effect of market dynamism. Asia Pacific Journal of Innovation and Entrepreneurship, 12(1), pp.62-76. https://doi.org/10.1108/APJIE-10-2017-0035
Douglas, R.B., 1994. The budgeting process in a multinational firm. Multinational Business Review, 2(2), pp.59-63.
Elmousalami, H.H., 2020. Artificial Intelligence and Parametric Construction Cost Estimate Modeling: State-of-the-Art Review. Journal of Construction Engineering and Management, 146(1), p.03119008. https://doi.org/10.1061/(ASCE)CO.1943-7862.0001678
Enshassi, A., Al-Najjar, J. and Kumaraswamy, M., 2009. Delays and cost overruns in the construction projects in the Gaza Strip. Journal of Financial Management of Property and Construction, 14(2) pp.126-51. https://doi.org/10.1108/13664380910977592
Etemadi, S., Koosha, H. and Salari, M., 2018. A Goal Programming Capital Budgeting Model Under Uncertainty in Construction Industry. Scientia Iranica, 25(2), pp.841-51.
Famakin, I.O. and Saka N., 2011. Evaluation of the Capital Budget Practice of Contractors in the Construction Industry. Journal of Building Performance, 2(1), pp.26-32.
Fayol, H., 2013. General and Industrial Management. Eastford, CT: Martino Fine Books.
Fellows, R.F. and Liu, A.M., 2008. Research Methods for Construction. West Sussex, UK: Wiley-Blackwell Publishing.
Ferguson, C.J., 2009. An Effect Size Primer: A Guide for Clinicians and Researchers. Professional Psychology: Research and Practice, 40(5), pp.532-38. https://doi.org/10.1037/a0015808
Field, A., 2009. Discovering statistics using SPSS. London: Sage Publications.
Flynn, B.B., Sakakibara, S., Schroeder, R.G., Bates, K.A. and Flynn, E.J., 1990. Empirical research methods in operations management. Journal of Operations Management, 9(2), pp.250-84. https://doi.org/10.1016/0272-6963(90)90098-X
Frimpong, Y., Oluwoye, J. and Crawford, L., 2003. Causes of delay and cost overruns in construction of groundwater projects in a developing countries; Ghana as a case study. International Journal of Project Management, 21(5), pp.321–26. https://doi.org/10.1016/S0263-7863(02)00055-8
Forza, C., 2002. Survey research in operations management: a process-based perspective. International Journal of Operations and Production Management, 22(2), pp.152-94. https://doi.org/10.1108/01443570210414310
Fruitticher, L., Stroud, N., Laster, J. and Yakhou, M., 2005. Budget practices case studies. Managerial Auditing Journal, 20(2), pp.171-78. https://doi.org/10.1108/02686900510574575
Guba, E.G., 1981. Criteria for assessing the trustworthiness of naturalistic inquiries. Audiovisual Communication Review, 29(2), pp.75-91. https://doi.org/10.1007/BF02766777
Hansen, S.C., Otley, D.T. and Van der Stede, W.A., 2003. Practice developments in budgeting: an overview and research perspective. Journal of Management Accounting Research, 15, pp.95-116. https://doi.org/10.2308/jmar.2003.15.1.95
Hillebrandt, P., Cannon, J. and Lansley, S., 1995. The Construction Company in and out of Recession. London: Macmillan. https://doi.org/10.1007/978-1-349-24195-8
Isaac, R.G., Zerbe, W.J. and Pitt, D.C., 2001. Leadership and Motivation: The Effective Application of Expectancy Theory. Journal of Managerial Issues, 13(2), pp.212-26.
Iyer, K.C. and Jha, K.N., 2005. Factors affecting cost performance: evidence from Indian construction projects. International Journal of Project Management, 23(4), pp.283–95. https://doi.org/10.1016/j.ijproman.2004.10.003
Joshi, P.L., Al-Mudhaki, J. and Bremser, W.G., 2003. Corporate Budget Planning Control and Performance Evaluation in Bahrain. Managerial Auditing Journal, 18(9), pp.737-50. https://doi.org/10.1108/02686900310500505
Koteen, J., 1997. Strategic Management in Public and Non-Profit Organizations: Managing Public Concerns in an Era of Limits. Westport, CT: Greenwood Publishing Group.
Krefting, L., 1991. Rigor in Qualitative Research: The Assessment of Trustworthiness. The American Journal of Occupational Therapy, 45(3), pp.214-22. https://doi.org/10.5014/ajot.45.3.214
Lam, K.S. and Oshodi, O.S., 2015. The Capital Budgeting Evaluation Practices (2014) of Contractors in Hong Kong Construction Industry. Construction Management and Economics, 33(7), pp.587-600. https://doi.org/10.1080/01446193.2015.1073852
Lam, K.C., Runeson, G., Ng, S.T., Hu, T.S., Cheung, S.O. and Deng, Z.M., 2001. Capital Budget Planning Practices of Building Contractors in Hong Kong. Construction Management and Economics, 19(6), pp.569-76. https://doi.org/10.1080/01446190110054112
Larsen, J.K., Lindhard, S.M., Brunoe, T.D. and Jensen, K.N., 2018. The Relation between Pre-planning, Commissioning and Enhanced Project Performance. Construction Economics and Building, 18(2), pp.1-14. https://doi.org/10.5130/AJCEB.v18i2.5762
Larsen, J.K., Ussing, L.F., Brunoe, T.D. and Lindhard, S.M., 2015. The Project Management Process of Planning and Budgeting in Public Construction Projects. International Journal of Information Technology Project Management, 6(4), pp.20-33. https://doi.org/10.4018/IJITPM.2015100102
Lidia, T.G., 2014. Difficulties of the Budgeting Process and Factors Leading to the Decision to Implement this Management Tool. Procedia Economics and Finance, 15, pp.466-73. https://doi.org/10.1016/S2212-5671(14)00484-5
Ling, F.Y.Y., 2004. How project managers can better control the performance of design-build projects. International Journal of Project Management, 22(6), pp.477-88. https://doi.org/10.1016/S0263-7863(03)00113-3
Lo, W., Lin, C.L. and Yan, M.R., 2007. Contractor’s Opportunistic Bidding Behavior and Equilibrium Price Level in the Construction Marked. Journal of Construction Engineering and Management, 133(6), pp.409-16. https://doi.org/10.1061/(ASCE)0733-9364(2007)133:6(409)
Love, P.E.D. and Edwards, D.J., 2005. Taking the pulse of UK construction project managers’ health. Engineering Construction and Architectural Management, 12(1), pp.88-101. https://doi.org/10.1108/09699980510576916
Love, P.E.D., Sing, M.C.P., Ika, L.A. and Newton, S., 2019. The cost of performance of transportation projects: The fallacy of the Planning Fallacy account. Transportation research. Part A, Policy and Practice, 122(2019), pp.1-20. https://doi.org/10.1016/j.tra.2019.02.004
Macey, W.H., Schneider, B., Barbera, K.M. and Young, S.A., 2009. Employee Engagement: Tools for Analysis, Practice and Competitive Advantage. UK: Wiley-Blackwell. https://doi.org/10.1002/9781444306538
Mahamid, I., 2012. Factors affecting contractor’s business failure: contractors’ perspective. Engineering. Construction and Architectural Management, 19(3), pp.269-85. https://doi.org/10.1108/09699981211219607
Mahlendorf, M.D., Schäffer, U. and Skiba, O., 2015. Antecedents of Participative Budgeting – A Review of Empirical Evidence. Advances in Management Accounting, 25, pp.1-27. https://doi.org/10.1108/S1474-787120150000025001
Melkers, J. and Willoughby, K., 2005. Models of Performance-Measurement Use in Local Governments: Understanding Budgeting. Communication, and Lasting Effects. Public Administration Review, 65(2), pp.180-90. https://doi.org/10.1111/j.1540-6210.2005.00443.x
Mir, F.A. and Pinnington, A.H., 2014. Exploring the value of project management: Linking Project Management Performance and Project Success. International Journal of Project Management, 32(2), pp.202-17. https://doi.org/10.1016/j.ijproman.2013.05.012
Mutti, C.D.N. and Hughes, W., 2002. Cash flow management in construction firms. In: Proceedings of the 18th Annual ARCOM Conference for the Association of Researchers in Construction Management, 2-4 September 2002, University of Northumbria, pp.23-32.
Peel, M.J. and Bridge, J., 1998. How Planning and Capital Budgeting Improve SME Performance. Long Range Planning, 31(6), pp.848-56. https://doi.org/10.1016/S0024-6301(98)80021-6
Raghunandan, M., Ramgulam, N. and Rahunandan-Mohammed, K., 2012. Examining the Behavioural Aspects of Budgeting with particular emphasis on public sector/service budgets. International Journal of Business and Social Science, 3(14), pp.110-17.
Salhab, D., Møller, D.E., Lindhard, S.M., Hamzeh, F., Randrup, M. and Pilgaard, A., 2022. Accounting for variability: identifying critical activities as a supplement to the critical path. Journal of Construction Engineering and Management, 148(5), p.04022019. https://doi.org/10.1061/(ASCE)CO.1943-7862.0002266
Santos, J.R.A., 1999. Cronbach’s alpha: A tool for assessing the reliability of scales. Journal of Extension, 37(2), pp.1-5.
Shack, B., 2006. Applied Financial Management (Anvendt Økonomistyring). Jurist og Økonomforbundets Forlag.
Shim, J.K., Siegel, J.G. and Shim, A.I., 2012. Budgeting Basics and Beyond. Hoboken, New Jersey: John Wiley and Sons Inc. https://doi.org/10.1002/9781118106754
Sinesilassie, E.G., Tabish, S.Z.S. and Jha, K.N., 2018. Critical factors affecting cost performance: a case of Ethiopian public construction projects. International Journal of Construction Management, 18(2), pp.108-19. https://doi.org/10.1080/15623599.2016.1277058
Sivabalan, P., Booth, P., Malmi, T. and Brown, D.A., 2009. An exploratory study of operational reasons to budget. Accounting and Finance, 49(4), pp.849-71. https://doi.org/10.1111/j.1467-629X.2009.00305.x
The Britannica Dictionary, 2024. Available at: https://www.britannica.com/dictionary.
Uyar, A. and Bilgin, N., 2011. Budgeting Practices in the Turkish hospitality industry: An exploratory survey in the Antalya region. International Journal of Hospital Management, 30, pp.398-408. https://doi.org/10.1016/j.ijhm.2010.07.011
Willoughby, K.G. and Melkers, J.E., 2000. Implementing PBB: Conflicting Views of Success. Public Budgeting and Finance, 20(1), pp.105-20. https://doi.org/10.1111/0275-1100.00006
Wyke, S., Lindhard, S.M. and Larsen, J.K., 2024. Using Principal Component Analysis to Identify Latent Factors Affecting Cost and Time Overrun in Public Construction Projects. Engineering, Construction and Architectural Management, 31(6), pp.2415-36. https://doi.org/10.1108/ECAM-02-2022-0189
Yismalet, A.G. and Patel, D., 2018. A critical literature review on improving cost management practice and profitability of domestic contractors. International Journal of Engineering Technologies and Management Research, 5(1), pp.51-58. https://doi.org/10.29121/ijetmr.v5.i1.2018.48
Yoon, Y., Tamer, Z. and Hastak, M., 2015. Protocol to enhance profitability by managing risks in construction projects. Journal of Management in Engineering, 31(5), p.04014090. https://doi.org/10.1061/(ASCE)ME.1943-5479.0000339