Construction Economics and Building
Vol. 23, No. 3/4
December 2023
RESEARCH ARTICLE
Understanding Roofing Distributor Employee Job Perception to Address Recruitment and Retention of Workers
Jason Lucas*, Dhaval Gajjar, Georgia Loadholt, David Davis
Nieri Department of Construction, Development, and Planning, 2-136 Lee Hall, Clemson University
Corresponding author: Associate Professor Jason Lucas, Nieri Department of Construction, Development, and Planning, 2-136 Lee Hall, Clemson University, jlucas2@clemson.edu
DOI: https://doi.org/10.5130/AJCEB.v23i3/4.8315
Article History: Received 13/08/2022; Revised 12/09/2023; Accepted 27/10/2023; Published 23/12/2023
Abstract
The roofing industry faces a severe decline in workforce strength in all areas, including distribution. This study aims to collect and present workforce data that distributor companies can use to create an attractive company culture to strengthen their workforce. This study collected data via survey and analysed current workforce satisfaction, attraction, retention factors, and demographics of various roofing distributor companies. Findings yield that the overall work and the yearly compensation were crucial factors for attraction and retention to the industry. The study results illustrate the development of workforce needs in the affordability of benefits, work-life balance, and a defined career path. The importance of this study lies in the ability of distributor companies to understand how they are doing in terms of current employee satisfaction and what areas they may need to address when developing recruitment strategies for the next generation of workforce, Generation Z.
Keywords
Roofing; Distribution; Workforce Satisfaction; Attraction; Retention
Introduction
The construction industry is one of the largest employers in the United States. In 2021, over 733,000 employers employed over 7 million workers (AGC, 2022). The construction industry continues to grow exponentially, causing higher demand and advances for the supply chain and material distribution. Over the past five years, the revenue in the construction industry increased annually by 2.4%. In 2021, the construction industry (including material supply chain) revenue increased by 2.6% as the economy recovered from the COVID-19 pandemic (IBISWorld, 2022).
Construction demand is highly volatile in relation to government actions and macroeconomics; the workforce needs of construction fluctuate with business. There is a significant workforce shortage throughout the U.S. There are many contributors to this shortage; however, a growing workforce gap is one of the main contributors. Over the next ten years, 41% of the industry workforce will retire (NCCER, 2017). Many retiring workers hold critical leadership positions that demand highly skilled personnel. According to the 2022 Associated General Contractors (AGC) survey, 86% of the firms need help filling both craft and salaried professionals in the construction industry (AGC, 2022).
A significant portion of the workforce retiring creates a demand for a younger workforce and presents a difficult task to industry recruiters in fulfilling open jobs. Moreover, Millennials and Generation Z members do not view construction-related jobs as rewarding based on the perception that construction-related jobs are labour-intensive and the industry’s image is poor (Kim, Chang and Castro-Lacouture, 2020). This not only raises concerns about attracting workers but also retaining younger workers. In 2020, the U.S. construction industry experienced its highest annual quit rate, 27.8% (BLS, 2020). Since the retention rates are relatively low compared to other industry retention rates, retaining workers is a competitive advantage for construction-related industries as they would not have to train and develop new workers but be able to complete jobs more efficiently and economically (Chih, et al., 2016). However, to adequately retain workers, the industry must be knowledgeable of the workforce’s desires, including but not limited to attraction factors, retention factors, and workforce preferences. Therefore, the understanding of workforce retention has exponentially increased as a research topic within the past few years (Karakhan, Gambatese and Simmons, 2020; Clarke and Herrmann, 2019; Gajjar, et al., 2022; Bigelow, et al., 2021; Perrenoud, et al., 2020).
Workforce perception in the roofing industry has only been documented for roofing contractors (Gajjar, et al., 2022). Workforce demographics were studied throughout the roofing industry by Delvinne, et al. (2020), though they did not consider job satisfaction or workforce retention. Other studies have been conducted that looked at job satisfaction in electric and drywall workers (Bigelow, et al., 2017), gender differences in attraction and retention (Perrenoud, 2020), and generational or age differences (Zaniboni, et al., 2016), but there has been no previous research regarding the perception of the professionals in the distribution sector of the roofing industry. Understanding workers within a specific trade is important in creating effective recruiting and retention strategies. Generalizations should not be made between industry sectors (Bigelow, et al., 2017).
This study explores a gap in the current body of knowledge to better understand the perception of professionals in the distribution sector of the roofing industry. It will also assist the distributing companies in understanding and developing other strategies to attract and retain professionals, especially those of younger generations, within the roofing distribution sector. The study analyses the current workforce by looking at their experience level, education, compensation, satisfaction, and attraction and retention factors and their correlation. Additionally, these findings are reviewed against generational preferences to identify where the sector is doing well and where they may want to focus more of their efforts in future recruitment programs.
Literature review
The construction industry comprises multiple sectors, and the workforce shortages are more expansive than in one sector. Instead, they impact all aspects of the construction industry, including but not limited to general contractors, sub-contractors, manufacturing, and distributing. Distribution is an essential aspect of the construction industry since distributors are responsible for coordinating the procurement and sourcing of various construction materials between the manufacturers and the contractors. The material distribution sector accounts for one of the highest contributors in the construction industry, with 8% to 12% value-added and profits of 13% to 17% in the construction industry (Andersson, et al., 2020). However, distributors could see their value to the construction industry diminish if they cannot sustain a workforce.
A challenge that the construction industry consistently faces is low productivity. Over the past few decades, global labour productivity in construction has only increased by 1% annually compared to 2.8% of the world economy and 3.6% for manufacturing (Barbosa, et al., 2017). A skilled workforce shortage is one of the many factors challenging the construction industry’s productivity growth (Hasan, et al., 2018). Another identified area that affects construction productivity is other external factors (Dixit, and Sharma, 2020). One of the external factors to be assessed is the distribution industry and its correlation to construction production since supply chain management, or material distribution, is key to maintaining productivity.
Distributor workforce
One of the greatest evolutions to the distribution workforce is automation and technological advancements that reduce human workforce demand (Monroe, 2021). While this is a significant advancement, recruiting and retaining a human-based workforce for jobs that technology cannot replace is very important. Like the challenges mentioned above, the distribution sector must reevaluate the retention and attraction factors for a younger generation. Over the past few years, this distributor sector has seen significant workforce disruption, impacting the supply chain. This distribution workforce shortage is not expected to improve until at least 2023 (Marcello, 2021). Therefore, distributors must start taking action to curb the effects of the workforce shortage on the overall construction industry supply chain.
Distributors put forward a product or service for the user who demands it. Therefore, the distribution industry significantly impacts market supply. If the consumer requires the product or service, the distributor must make it available in the market. With that said, distributors must demonstrate significant levels of commitment in their relationships with consumers and suppliers. Research has identified many levels of commitment needed between a distributor and their counterparts. However, practical commitment requires unity among all involved (Kim, and Frazier, 1997). One of the most effective ways to generate agreement is through the workforce. A company’s workforce should align with its goals and collaborate to achieve them (Bhadury, Mighty and Damar, 2000). However, this is difficult for distributors due to the industry’s workforce shortage.
This workforce shortage dates back to the mid-1970s, creating the need for legislative action. In 1977, the Tax Reduction and Simplification Act was passed to combat workforce shortages in many industries, including distribution. The new Jobs Tax Credit offers a tax credit for companies that increase employment by greater than two percent from the previous year (Bishop, 1981). While this provision might have increased the workforce at the time, it has yet to sustain workforce growth and development. As the demand for distribution operations grows, so does the need for a strong distribution workforce. More recently, between 1998 and 2005, this demand generated an employment growth of 22.23% (Andreoli, Goodchild and Vitasek, 2013).
Distribution connects products and services to the end users and consumers via general and sub-contractors. The distributor is the intermediary between the manufacturer and the consumer, thus creating the supply chain. Like many processes, the supply chain adapts new technology to increase output. However, technology output is comparable to the input level (Kersting, 2006). Therefore, technology has not entirely replaced human work, and a strong workforce is still in great demand. Even more critical, the supply chain is susceptible and significantly affects the economy. COVID-19 has demonstrated the supply chain’s impact on the overall economy. COVID-19 highlighted a weakness in supply chain sustainability (Sarkis, 2020). When faced with a disaster, the supply chain can no longer sustain itself. At its peak during the COVID-19 pandemic, distribution companies fired more workers and exported less (Meier and Pinto, 2020). As the economy begins to reboot from the COVID-19 pandemic, there is a demand for workforce growth in all sectors. The shortage of workers in the distribution sector creates a domino effect on the construction industry because distributors cannot meet the industry’s demands. The need for more workers in distribution harms the delivery of products from the manufacturer to the consumer, thus creating budget and schedule overruns. Therefore, a strong workforce must be created to prevent more significant harm to industry success. To begin, a distribution company must first analyse the current professional’s perspective of the industry (Azeez, Gambatese and Hernandez, 2019). This includes but is not limited to perspective on job functions, satisfaction, and compensation (Bonilla, Gajjar and Sullivan, 2019). Given these factors influence industry attraction, they are essential to analyse to attract the younger workforce. Further, attention to detail in specific trades is more effective in recruiting and retention than a broader approach (Bigelow, et al., 2017).
Generation Z (Gen Z) – workforce preferences
The youngest generation entering the workforce is Generation Z (Gen Z). This generation comprises workers born during or after 1997 (Dimock, 2019) and those just starting to enter the current workforce. For any industry to successfully recruit this generation, it is important to understand their job preferences as they do not generally align with older generations that currently comprise most of the construction and distribution workforce.
One of the priorities documented in the literature that Gen Z looks for when choosing a career is the potential for work-life balance (Chan, et al., 2020; Metro, Harper and Bogus, 2021). This work-life balance plays a critical role in the workforce’s job satisfaction. Additionally, Gen Z emphasizes safety and organization effectiveness, fair rewards, resource adequacy, job tenure and promotion, and physical and mental health (Shan, et al., 2017).
Gen Z workers have been defined as self-reliant (Pichler, Kohli and Granitz, 2021) while also needing a community to bond with in a collaborative workplace (Maloni, Hiatt and Campbell, 2019). This generation identifies with a strong organizational structure and fears missing out, so working as part of a team can help combat that fear (Liu, et al., 2021). They are open to diversity and change, looking for a fast-paced, satisfying job that challenges their skills and grows them as an employee (Collisson, Eck and Harig, 2021). Growing up in a technologically savvy environment, they look for results in a fast-paced environment (Pichler, Kohli and Granitz, 2021). Lastly, having knowledge about different career opportunities linked with career growth has been identified as an attractor of Gen Z to an industry (Bigelow, et al., 2019).
Job satisfaction
Job satisfaction has been linked to organizational commitment. When job satisfaction through employee engagement is high, there tends to be a higher commitment level to that organization (Kim, et al., 2017). In a tight labour market, when most industries are looking for the same group of people to fulfill labour shortages, the market is competitive, and once someone is hired, the preference is to keep them with the company. Understanding factors of satisfaction can help with retaining employees.
Kian, et al. (2014) found job satisfaction and motivation to be among the most discussed topics in research when looking at organizational success factors. Motivation is summarized as having a similar meaning to drive, energize, and act with a worker’s desire to achieve something, thus being followed by the action to obtain the desire (Kian, et al., 2014). Job satisfaction is often explained as a “pleasurable emotional state” based on meeting one’s job’s values (Locke, 1976). Job satisfaction is also defined as the extent to which workers like or dislike their jobs (Spector, 1997).
Maslow (1970) observed a general pattern of recognition based on met needs and theorized that a person could not pursue the next higher need in the five-level hierarchy until the current need was satisfied. For example, the physiological need for shelter, food, and water must be met before a need for safety can be recognized. Maslow’s hierarchy has also been applied to job satisfaction theory because satisfaction occurs when one gets what they need, desire, want, expect, deserve, or deem to be entitled to (Thangaswamy and Thiyagaraj, 2017). As a person moves up, needs are met, and satisfaction is increased.
In contrast to Maslow’s theory, Herzberg, Mausner and Snyderman (1959) proposed a two-dimensional paradigm that affects people’s satisfaction with work by categorizing factors into motivators and hygiene. Herzberg argues that factors related to hygiene (e.g., company policies, working conditions, salary), when not present, can result in dissatisfaction, but when present, only lead to “neutrality” in satisfaction and do not result in motivation. The second dimension, a motivator (e.g., achievement, recognition, the work itself, responsibility), leads to satisfaction when they are present and conversely results in “neutrality” when they are not.
Several studies have argued that hygiene factors and motivators affect motivation and satisfaction. Yusoff, Kian and Rajah, (2013) identified hygiene factors as motivators for a younger generation of workers, while traditional motivators had more of a motivational response to older generations. Aziri (2011) supports that job satisfaction is based more on feelings and beliefs people hold about their work and that both hygiene factors and motivators raise motivation.
The Job Characteristics Model (JCM) extends beyond Herzberg’s theory and looks more closely at the aspects of the work and how that affects satisfaction and motivation (Blanz, 2017). The JCM consists of five (5) job dimensions (i.e., skill variety, task identity, task significance, autonomy, and feedback). These dimensions prompt three psychological states (i.e., experienced meaningfulness of the work, experienced responsibility for the outcome of the work, and knowledge of the actual results of the work activity). Once prompted, the physiological states lead to personal and work outcomes (i.e., high internal work motivation, high-quality work performance, high satisfaction with the work, low absenteeism and turnover). Österberg and Rydstedt (2018) analysed a series of review studies that indicated partial support for the JCM while noting that the job dimensions more strongly influence the attitudinal variables (job satisfaction and work motivation) more than the behavioural outcomes.
Worker attraction and retention factors
Much of the job satisfaction theory and sub-factors that feed into them align with factors of worker retention. Overall, job satisfaction has also been documented as one of the reasons for employee retention and helps reduce stress, absenteeism, and burnout (Aletraris, 2010).
Employees are attracted to a particular career by several factors. First, a family business can majorly impact attraction (Bigelow, et al., 2017). Salary has been found to attract a worker to a specific employer but is not as big of a factor for worker satisfaction and retention, especially when job responsibilities, stress level, and work-life balance are affected (Sharma and Bajpai, 2011). Compensation, exciting work, good work-life balance, job security, and job variety help attract workers, especially younger generations, to an industry (Bonilla, Gajjar and Sullivan, 2019). Factors of attraction and retention include training and career growth opportunities within the company (Bigelow, et al., 2019; Goh and Okumus, 2020). Creating a caring environment with a positive work culture has also been linked to retaining employees (Sedighi and Loosemore, 2012).
Prior studies have been done examining the workforce attraction and retention factors for electrical subcontractors (Bigelow, et al., 2021), management level of roofing contractors (Gajjar, Lucan and Davis, 2022), drywall subcontractors (Bigelow, et al., 2019), and attracting women to the construction industry (Perrenoud, Bigelow and Perkins, 2020). However, Bigelow, et al. (2017) identified that it is vital to understand workers in a specific trade to create effective recruiting and retention strategies for any industry sub-group based on a study that found differences between drywall and electrical workers.
For the current research, it is important to understand what the current workforce identifies as satisfying about their job. These characteristics that help retain them in the industry can be examined against what Generation Z is looking for in a job and indicate the industry’s preparedness to recruit and retain the younger generation.
Methodology
This study was conducted in partnership with the Roofing Alliance and the National Roofing Contractors Association (NRCA), as shown in Figure 1.
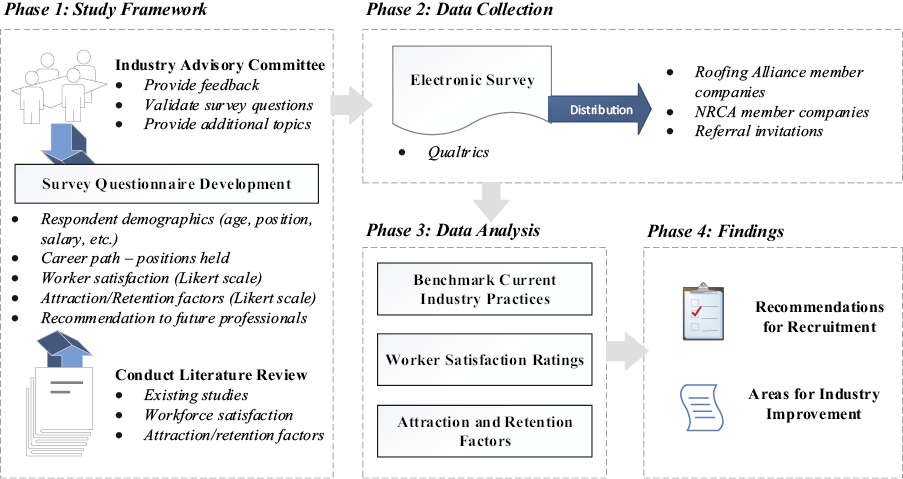
Phase 1: study framework
The professionals from the major companies within the Roofing Alliance and the NRCA served on an industry advisory committee for this research. The advisory committee provided feedback on developing the survey questionnaire and validated the study’s findings. Industry feedback and previously identified factors of employee satisfaction, attraction, retention, and workforce perception (Bigelow, et al., 2019; Bonilla, Gajjar and Sullivan, 2019; Chinyio, Suresh and Salisu, 2018; Zaniboni, et al., 2016; Gajjar, Lucas and Davis, 2022) were used to design the survey questionnaire. The advisory committee reviewed and pilot-tested the questionnaire. The survey was edited based on the committee’s feedback before being disseminated to the larger workforce. The researcher’s University Institutional Review Board reviewed and approved the protocol (IRB2023-0833) under exempt status before administering it.
The four main areas of the survey included:
1. Respondent Background – Basic demographic information of the respondent that included age, education, experience, and company location.
2. Job Position – Respondents were asked to provide information on their current position within the industry, position held, length of time at the position, salary, and benefits received.
3. Worker Satisfaction –Worker satisfaction with various aspects of their job and industry was gauged through Likert scale questions.
4. Attraction and Retention Factors – Select from a list of attraction and retention factors related to their choice of work in the roofing material distribution industry.
Phase 2: data collection
A self-administered electronic survey was sent to the Roofing Alliance member companies within the roofing material distribution sector. The survey was administered through Qualtrics. Qualtrics allows for the distribution and analysis of survey findings. Additionally, features were used within Qualtrics to help ensure the validity of the survey results. These include examining flagged responses. With a response pool of over 100 respondents, Qualtrics calculates the time to complete the survey and flags those responses that were completed in an abnormally short time. Additionally, allowing only one response per IP address minimized the chance for duplicate responses. Referral invitations were encouraged to reach the broadest possible population, so a response rate is difficult to calculate. Five hundred and eighty-six (586) respondents from across the United States completed the survey and were considered valid responses. The number of responses analysed for each section depended on the completeness of survey responses for those questions. For example, if a respondent failed to identify their age, their responses were removed from the age-based analysis.
The survey was organized into the following sections:
1. Part 1: Background Information: This section confirmed what sector of the industry the respondents worked in. Any response other than “Roofing Distributor” was removed from consideration and not included in the 586 respondents. Additionally, respondents were asked what state they worked in, the specialty sector of the industry, the geographical presence of the company they worked for, age, education, and time spent in the industry. Skip logic was used to allow for drilling down on the position. For instance, if “Management” were selected, typical management job titles were provided to choose from instead of those that would be sales or technical personnel. Additionally, the type of benefits offered by their employer and the ones they enrolled in were documented.
2. Part 2: Job Position: This section documented the current career status of the respondents and included the type of position they currently held, annual total salary, and length of time in the position. This information allowed for sorting respondents based on various factors to examine trends within the industry.
3. Part 3: Worker Satisfaction: Variables that other studies have identified as affecting worker satisfaction were listed. These include overall work being performed (nature of the work, etc.), work-life balance, benefits offered, affordability of benefits, job function, work impact/meaning to the greater good, a documented path for promotion (structure of career), career advancement opportunities being available, overall industry (image of, being a part of), job security, and job variety/diversity.
4. Part 4: Attraction and Retention Factors: The same factors that have been often associated with worker satisfaction play a role in attracting and retaining workers. The list was the same as from part three with the addition of a “Family Business,” meaning the family owned it or was involved in it, and “other.” The survey asked for what factors attracted the worker to the industry and then asked them to rank the selected factors. Similarly, the questions were rephrased to ask about what retains them.
Phase 3: data analysis
The data were analysed using the following methods:
1. Descriptive statistics: Descriptive statistics were used to analyse the yearly compensation based on age, education, experience, and position. The satisfaction factors were analysed using a Likert scale from 1 (very dissatisfied) to 5 (very satisfied) for the key factors that impact the professionals in the roofing distribution sector. The count data model was utilized to analyse the attraction and retention factors for the professionals in the roofing distribution sector.
2. Quantitative statistical analysis: Two types of statistical tests were performed:
a. Kruskal-Wallis Test: A non-parametric test followed by a post hoc test was performed to determine if there are statistically significant differences between yearly compensation for different education levels, years of experience, and overall satisfaction.
b. Spearman Correlation Efficient (r-value): A non-parametric correlation efficient test was performed to describe the relationship between yearly compensation and overall worker satisfaction and yearly compensation and years of experience.
Results and findings
Respondent demographics
Data for respondent demographics include age, education, experience, and position.
Age
The respondents’ ages were categorized into 5-year increments, ranging from 21 to 60 years. The “60+” category accounts for all respondents over 60. Out of five-hundred-and-eighty-six (586) respondents, three-hundred-and-six (306) responses were analysed when “age” was a variable. The remaining two-hundred-and-eighty (280) respondents did not provide their age. Table 1 shows the age categories and details the number of respondents per category, corresponding percentage, and weighted average yearly compensation per age category.
Forty-five (45) was considered the halfway point of a professional’s career, so the 41-45 category was used as a mid-point for comparison. 48% of the total respondents were 45 or younger, compared to 52% above 45. Respondents in the younger category reported a weighted average yearly compensation of $90,940, whereas respondents above 45 years of age reported $100,670, representing a 10.7% difference between the two populations. With the nature of the positions the respondents reported having, it is assumed they are salary or fixed hourly positions and not paid on rate of work (unit cost). Rate pay is rare for management and office-level positions in the distribution sector of the industry.
Education
Respondents were analysed based on their highest level of education. Five hundred and sixty (560) responses were collected and analysed. Table 2 shows the respondents into different categories based on their education level, corresponding percentages, and weighted average yearly compensation for each category. 45% of the respondents had at least a four-year college degree or greater (bachelor’s or master’s) and 55% had less than a four-year college degree (some high school, some college, vocational training, high school graduate, and associate degree). The weighted average yearly compensation for respondents with a four-year college degree or greater was $109,893. The respondents who did not have a four-year college degree or greater identified a weighted average yearly salary as $80,097 representing a 27.1% decrease from those with a college degree. Apprenticeships or other on-the-job training that may provide a baseline for greater compensation were not measured.
A Kruskal-Wallis Test was conducted to analyse if there are any significant differences in yearly compensation between different educational levels. The hypotheses tested for this test include:
H0: The distribution of compensation is the same across categories of education.
H.A.: The distribution of compensation is significantly different across categories of education.
The test revealed a significant difference between yearly compensation across education categories and hence rejected the null hypothesis, H(6) = 49.189, p = <0.001. The post hoc test indicated that yearly compensation for professionals with vocational training was significantly different when compared to professionals with high school diplomas (p = 0.023), some college credit (p = 0.009), bachelor’s degree (p < 0.001) and master’s degree (p < 0.001). Differences in yearly compensation were also found between professionals holding a bachelor’s or master’s degree and professionals holding an associate degree, high school diploma, and some college credit, p < 0.001. The results indicate that education does play a factor in yearly compensation.
Experience
Survey respondents provided the total number of years worked in the roofing industry. Years of experience were sorted into categories, each representing a five-year increment ranging from one to forty-one and greater. The study collected and analysed a total of five-hundred-and-forty-five (545) responses. Table 3 breaks down respondents by experience range and provides the average compensation for each.
| Experience Range | # of Respondents | % of Respondents | Average Compensation |
|---|---|---|---|
| 1 - 5 | 139 | 26% | $76,727 |
| 6 - 10 | 78 | 14% | $92,051 |
| 11 - 15 | 70 | 13% | $104,929 |
| 16 - 20 | 71 | 13% | $100,423 |
| 21 - 25 | 55 | 10% | $106,545 |
| 26 - 30 | 48 | 9% | $111,875 |
| 31 - 35 | 41 | 7% | $104,878 |
| 36 - 40 | 30 | 5% | $107,667 |
| 41 + | 13 | 2% | $95,385 |
Between 1-5 and 6-10 years of experience, there was a 16.6% increase in average compensation from $76,727 to $92,051. This increase was the highest among all the ranges. Average compensation peaks at its highest pay in the 26 – 30 range at $111,875. The minimum salary also increases with the increase in experience level.
A Kruskal-Wallis test was conducted to analyse if there are any significant differences in mean yearly compensation for different experience levels. The hypotheses tested for this test include:
H0: The distribution of yearly compensation is the same across categories of years of experience.
H.A.: The distribution of yearly compensation is significantly different across categories of years of experience.
A statistically significant difference was found in the compensation distributions across categories of years of experience, H(7) = 53.396, p = <0.001. The post hoc test indicated that professionals in the 1 – 5 experience range had a statistically significant difference in yearly compensation from professionals in every other experience range between 6 – 40, p < 0.001. A significant difference was also found between the yearly compensations of professionals in the 6-10 experience range and professionals in the 21-30 experience range, p = 0.008. Spearman’s rank correlation was computed to assess the relationship between years of experience and yearly compensation. There was a weak positive correlation between the two variables, r(543)=0.29, p<0.001 meaning the yearly compensation does tend to have some relationship with an increase in experience for the provided data (Akoglu, 2018).
Influence of education and experience on compensation
Within the construction industry, the years of experience and education alone and its correlation to compensation do not provide a complete analysis. Therefore, it is critical to simultaneously analyse the years of experience and education. Education level was classified into two categories: 4-year or more degree or less than a four-year degree. Next, the experience was categorized based on the respondents’ total years reported as working in the roofing distribution sector. Table 4 compares the education, average experience in years, and yearly compensation for both categories of respondents.
| Education Level | # of Respondents | Average Experience (Yrs.) | Yearly compensation ($) |
|---|---|---|---|
| Four-year or more | 249 | 13.5 | $106,988 |
| Less than four-year | 304 | 18.7 | $85,855 |
The average experience for professionals with a four-year or more degree was five (5) years less than those that have less than a four-year degree. However, the professionals’ yearly compensation with a four-year or more degree was $21,133 higher (19.8%) than those with less than a four-year degree. Therefore, professionals with a four-year or more degree had less experience, but higher yearly compensation compared to professionals with less than a four-year degree. Figure 2 represents the difference in the yearly compensation across different years of experience for four-year or more degrees compared to less than four-year degrees.
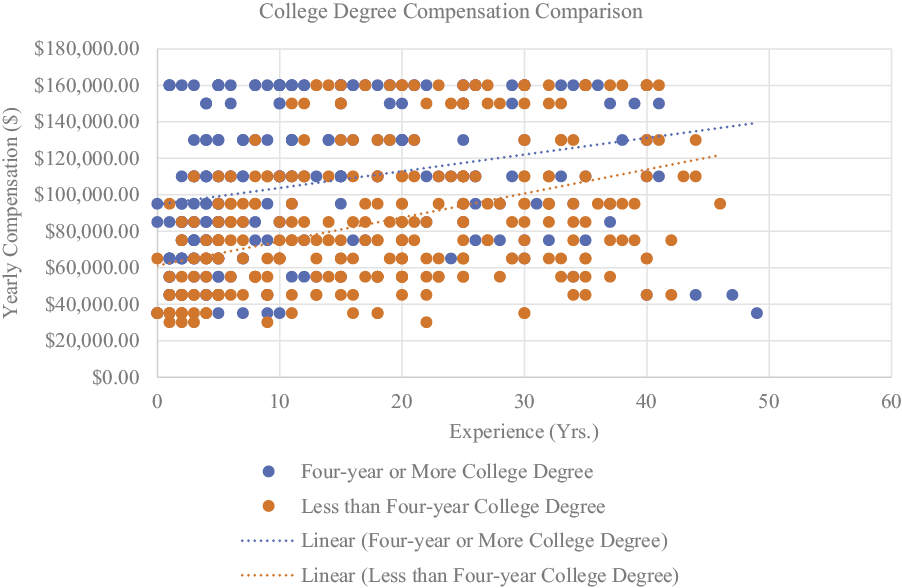
Figure 2. Effect of College Degree on Compensation
A Kruskal-Wallis test was conducted to analyse if there are any significant differences between yearly compensation across different categories of years of experience, separately, for professionals having a four-year or more college degree and for professionals having a less than four-year college degree. For professionals with a four-year or more college degree, the test results revealed a significant difference in yearly compensation across categories of years of experience, H(7) = 44.085, p = <0.001. A post hoc test indicated that there was a significant difference between the yearly compensation of professionals in the 0 - 5 years’ experience range and all other experience ranges from 6 - 35+, p < 0.001.
Similarly, for professionals with a less than four-year college degree, a significant difference was identified between yearly compensation across categories of years of experience, H(7) = 68.448, p = <0.001. A post hoc test identified that yearly compensation for professionals in the 0 – 5 years’ experience range once again differed with yearly compensations of every other experience ranging from 6 – 35+, p < 0.001. Based on the results, it can be seen that both education and experience can affect the yearly compensation of professionals. For the entire work period, the yearly compensation for both groups increased with the years of experience. Interestingly, the yearly compensation for a four-year or more college degree was consistently higher than those with less than a four-year degree no matter how many years of experience a worker had.
Position
Survey respondents were asked to identify their career path with their current and all previous positions and the yearly compensation for each. The survey provided a list of nine (9) different positions for the respondent to select from, including executive (owner, president, VP, director), project manager/estimator, safety manager, sales manager, assistant project manager, project engineer, technician, and administrative staff with an additional option to write in a position. Table 5 shows the number of respondents per position, corresponding percentage (out of 519 total responses), average years of experience, and average weighted yearly compensation.
Respondents identifying as holding an executive position had seven (7) years on average more experience in the sector compared to the lower project manager/estimator. Furthermore, there was a significant difference of $78,192 in the average weighted yearly compensation between these two groups. In general, the yearly compensation increased with each position as expected.
Attraction and retention factors
The survey identified twelve (12) attraction and retention factors for respondents to select from that attracted them to the roofing material distribution sector of the industry. The advisory industry committee and previously published research were used to generate the list of attraction and retention factors (Bigelow, Saseendran and Elliott, 2017; Bigelow, et al., 2019; Bonilla, Gajjar and Sullivan, 2018; Gajjar, Lucas and Davis, 2022). The respondents were asked to rank the factors to determine which had the most influence on them joining this industry sector. Understanding what attracts current employees to the industry helps companies understand attractive and not-as-attractive characteristics of the work. Additionally, matching these with current generational preferences from literature can help determine what characteristics of the work to highlight in recruiting material, as well as identifying if there are characteristics that do not align that might need to be addressed with revised business practices. Table 6 shows the respondents’ top-rated factors for both attraction and retention to the industry.
Overall type of work and experience, yearly compensation, and career advancement opportunities within the industry were the top three attraction factors. Affordability of benefits, roofing distribution being a family business, and work impact (or significance of the work) were the bottom three attraction factors. The top three retention factors were yearly compensation, overall work, and work-life balance. Family business, affordability of benefits, and job variety/diversity were the least three retention factors. Work-life balance was rated low as the attraction factor but was ranked highest in the retention factor.
Benefits analysis
The affordability of benefits was ranked lowest by the respondents as both the attraction and retention factor. Respondents were asked to identify the benefits offered by their company and the benefits they were enrolled in. The survey provided twelve (12) common types of benefits companies offer, as identified by the industry advisory committee. If a benefit was excluded from the survey, the respondent can write in the benefit. Five-hundred and fifty-six (556) responses were collected and analysed. Figure 3 shows the survey response percentages for benefits offered and benefits enrolled.
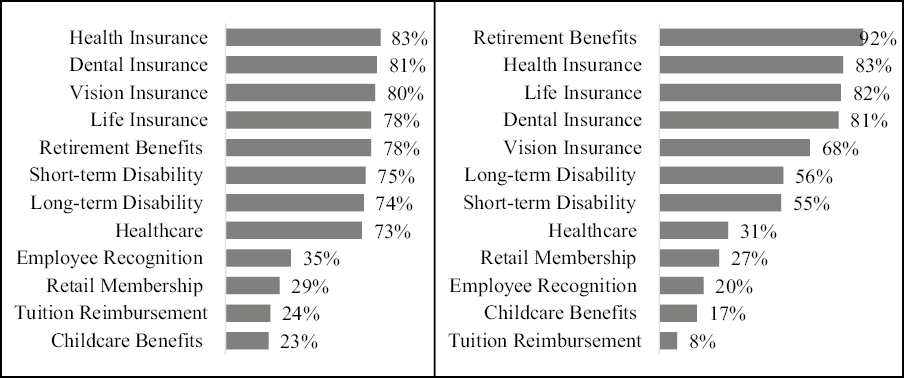
Figure 3. Benefits Offered / Enrolled
The top three benefits offered by the roofing distributor companies were health insurance (83%), dental insurance (81%), and vision insurance (80%). 92% and 83% of the respondents were enrolled in retirement benefits and health insurance plans when their company offered this benefit. It is important that companies provide benefit packages to increase employee attraction and retention. Overall, most of the roofing distributors offered decent benefits packages, and there was a higher percentage of enrolment in these basic benefits of retirement, health insurance, life insurance, dental, and vision insurance.
Satisfaction factors
To gain a deeper understanding of the distributor professional’s perspective regarding the industry, respondents rated specific satisfaction factors. The questions were phrased with a lead-in of “How satisfied are you with…” A Likert Scale of 1 to 5 (1 – Very Dissatisfied; 5 – Very Satisfied) was used for the measurement. Five hundred and fifty-five (555) responses were collected and analysed. Figure 4 shows a bar chart based on the data from survey respondents. The graph shows the positive versus negative favourability distribution for each topic area. A “neutral” response of three on the Likert scale is indicated as 0% on the favourability distribution scale, whereas a “very satisfied” response of five would be 100%. The weighted mean is also indicated.
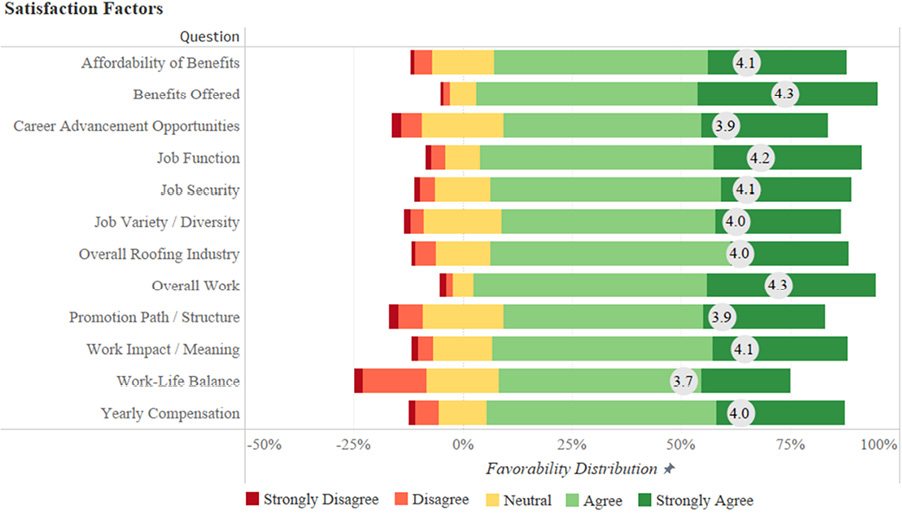
Researchers analysed respondents’ satisfaction with the above factors based on the weighted mean satisfaction. The top three satisfaction factors were benefits offered, overall work, and job function based on the weighted mean. No factor was overly negative, and all had a weighted mean over “neutral.” The bottom three satisfaction factors were work-life balance, promotion path/structure, and career advancement opportunities. This provides the roofing distributors with the factors that need to be focused on to improve further attraction and retention of roofing professionals in the distribution industry.
Overall satisfaction vs. yearly compensation
In the construction industry, there is a common assumption that an increase in yearly compensation is directly related to the rise in employee satisfaction. However, the study compared the average overall satisfaction to yearly compensation for the collected data to understand if this assumption is true. Figure 5 displays a scatter plot that graphs the respondents’ overall satisfaction and yearly compensation data.
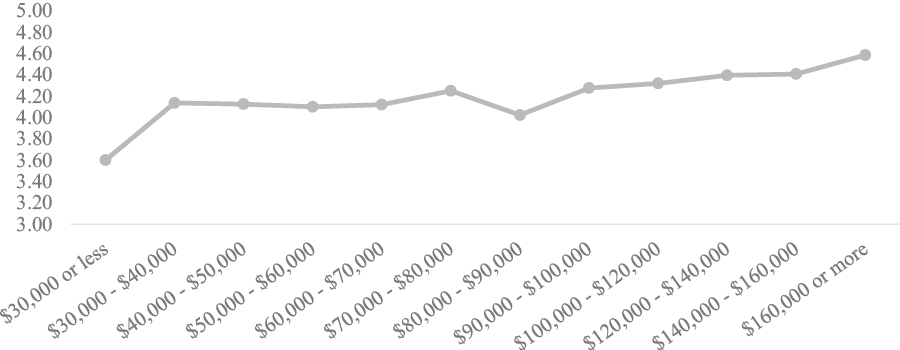
Figure 5. Compensation vs. Overall Satisfaction
Spearman’s rank correlation was computed to assess the relationship between yearly compensation and overall satisfaction. The two variables had a weak positive correlation, r(547)=0.24, p<0.001. The test suggests a weak positive relationship between overall satisfaction and yearly compensation. This is demonstrated graphically by seeing a gradual increase in satisfaction as compensation increases. There is an unusual drop in satisfaction in the compensation range of $80,000 - $90,000. Anecdotally, job responsibilities and stress related to a different position in the company may influence this drop. When asked regarding the recommendation for others considering a career in the roofing distribution sector, eighty-five percent (85%) of respondents said they would highly recommend working in this industry sector.
Discussion
Though not the focus of the study, information pertaining to the value of education in terms of how it affects overall compensation was examined. On average, those with four or more years of college made close to 20% more in annual salary than those with less than four years of college throughout their work career. On average, this equates to approximately $20,000 per year. Over a 40-year career, someone with a four-year degree or more could make over $800,0000 more than someone without. This aligns with Lobo and Burke-Smalley (2017), who identified that those with a four-year degree maintain higher compensation and higher salary growth than those who do not, and Kantrowitz (2007), who identified a significant return on investment for a four-year college education. This does not account for the fact that those with a four-year degree are likely to obtain a higher-level position earlier in their career, which could influence the lifetime salary to be significantly higher than those without a college degree. Salary and compensation are also a factor for job satisfaction and worker retention.
Overall work, yearly compensation, and career advancement opportunities were identified as the top three factors identified by the respondents as attracting them to the industry. The fact that people find the work satisfying and overall work meaningful works well for recruiting Gen Z workers as they desire fulfilling work (Ozkan and Solmaz, 2015; Chillakuri and Mahanandia, 2018). Additionally, they desire a career that has a visible path for promotion (Goh and Okumus, 2020), so having career advancement opportunities is a strength for the industry sector when it comes to recruiting Gen Z.
Yearly compensation, overall work, and work-life balance were identified as the top three reasons for respondents to stay in the distributor sector of the industry. As mentioned, overall work and the value of work is important to Gen Z. Another thing Gen Z looks for is work-life balance (Hampton and Welsh, 2019). Affordability of benefits was not listed high as an attraction or retention factor, however received a high rating of satisfaction. This is important since the younger generation desires good and affordable benefits (Hampton and Welsh, 2019).
Overall, in terms of satisfaction with the job, respondents currently working in the industry either agreed or strongly agreed. The factors of job security, good compensation, interesting work, good work-life balance, and job variety have been identified as important to Gen Z workers (Lanier, 2017; Hampton and Welsh, 2019). It is important to understand that just because current workers are satisfied with these individual factors does not mean that the Gen Z workers will be satisfied as they have different work preferences, however, understanding and having an awareness of what current professionals are feeling can help develop tools to better prepare the next generation (Azeez, Gambatese and Hernandez, 2019; Srour, Haas and Borcherding, 2006). The industry must understand the factors of career fulfillment in order to attract young talent into the industry (Bonilla, Gajjar and Sullivan, 2019).
Research limitations
One of the research limitations is the respondents. As shown in the demographics, very few younger-generation workers were included in the responses. This is also representative of the current industry since Gen Z workers are just starting to enter the workforce. Because of this, Gen Z workers were not isolated and examined for their preferences. Instead, their preferences and characteristics are identified in other literature and matched to the industry. It is possible that due to their generational perspectives they would have different views in where the industry is doing well and where it needs improvement, however the response pool did not allow for a generational analysis due to the lower number of respondents who would qualify as “Gen Z.”
Additionally, the means at which responses were solicited whereby partnering with the National Roofing Contractors Association (NRCA) and having them send out invitations to their membership. Though they are a national organization with national reach, it is possible that there are subpopulations that were not included in the representative sample. The responses were disproportionate from executive office and management staff and no technicians were included in the responses. Technicians, transportation and logistics, and warehouse staff may have different responses to the survey than those who responded.
Conclusion
The main objective of this study was to identify and analyse workforce data to benchmark the roofing industry in terms of employee satisfaction, attraction, and retention. The findings can allow distributor companies to create an attractive company culture to strengthen their workforce recruiting and retention efforts. A roofing industry-wide survey was drafted and delivered to roofing professionals. For this research, five-hundred-and-sixty roofing distributor professionals responded to the survey. The importance of this study lies in the ability of distributor companies to understand areas they are doing well in and identify areas that need to be improved. They can also incorporate the findings in developing recruitment material for new employees. This can allow the distributor companies to design specific programs that fit their needs. By taking into consideration areas of alignment and gaps between current characteristics of work and generational preferences, companies can customize their recruiting material to best attract the next generation of workers.
In this study, yearly compensation correlates to overall satisfaction. Therefore, the roofing distributor companies should maintain competitive salaries. Additionally, distributor companies should re-address their promotion path/structure and career advancement opportunities, as discussed earlier. Both factors received low satisfaction ratings from current employees. The future generations of the workforce are attracted to companies that can provide a clear career path and advancement. The distribution industry performs well in benefits offered, overall work, job function, and affordability of benefits. However, there is a need for further development in work-life balance, promotion path/structure, career advancement opportunities, and job variety/diversity. To remain competitive and strengthen their workforce, it is recommended that roofing distributor companies focus on this area of opportunity.
With the growing challenge of labour shortages throughout this and other industries, future workers have the upper hand when it comes to selecting a career, which makes it necessary for the roofing material distributors to understand what they are good at and where they should look to change. The workforce will not change their perception of the industry on their own; the industry must make the changes to better align with the worker’s preferences. The good news for roofing material distributors is that, according to the results found in this study, they are very strong in many aspects of attraction and retention for the current workforce. However, there needs to be a better understanding of how they can relate to the future workers they are competing to attract – Generation Z – those just now starting to enter the workforce.
Future research will contain a deeper exploration into how industry practices may need to change to better attract and align with the next generation of workers. It will also involve examining differences between the satisfactions of different generation groups currently within the workforce (e.g., Boomer vs. Generation X vs. Millennial). The current and future analysis findings will serve as a benchmark for companies working within this industry sector to examine their practices and potentially identify needed changes to grow and sustain their workforce.
Acknowledgments
This study was made possible by the support of the Roofing Alliance, the Foundation of the National Roofing Contractors Association, through funding of “Workforce Education and Retention Initiatives for the Roofing Industry.”
References
Akoglu, H., 2018. User’s Guide to Correlation Coefficients. Turkish Journal of Emergency Medicine, [e-journal] 18(3), pp.91–93. https://doi.org/10.1016/j.tjem.2018.08.001
Aletraris, L., 2010. How satisfied are they and why? A study of job satisfaction, job rewards, gender and temporary agency workers in Australia. Human Relations, [e-journal] 63(8), pp.1129–55. https://doi.org/10.1177/0018726709354131
Andersson, T., Biörck, J., Sjödin, E. and Mischke, J., 2020. The next normal in construction material distribution, [online] Available at: https://www.mckinsey.com/business-functions/operations/our-insights/the-next-normal-in-construction-material-distribution [Accessed 11 August 2022].
Andreoli, D., Goodchild, A. and Vitasek, K., 2013. The rise of mega distribution centers and the impact on logistical uncertainty. Transportation Letters, [e-journal] 2(2), pp.75-88. https://doi.org/10.3328/TL.2010.02.02.75-88
Associated General Contractors of America (AGC), 2022. Construction Data, [online] Available at: https://www.agc.org/learn/construction-data [Accessed 11 August 2022].
Aziri, B., 2011. Job Satisfaction: A Literature Review. Management Research And Practice, 3(4), pp.77-86.
Azeez, M., Gambatese, J. and Hernandez, S., 2019. What do construction workers really want? A study about representation, importance, and perception of U.S. construction occupational rewards. Journal of Construction Engineering and Management, [e-journal] 145(7), p.04019040. https://doi.org/10.1061/(ASCE)CO.1943-7862.0001669
Barbosa, F., Woetzel, J., Mischke, J., Ribeirinho, M.J., Sridhar, M., Parsons, M., Bertram, N. and Brown, S., 2017. Reinventing Construction: A Route to Higher Productivity [online] Available at: https://www.mckinsey.com/~/media/mckinsey/business%20functions/operations/our%20insights/reinventing construction through a productivity revolution/mgi-reinventing-construction-executive-summary.pdf [Accessed 11 August 2022].
Bhadury, J., Mighty, E.J. and Damar, H., 2000. Maximizing workforce diversity in project teams: a network flow approach. Omega, [e-journal] 28 (2), pp.143-53. https://doi.org/10.1016/S0305-0483(99)00037-7
Bigelow, B.F., Perrenoud, A.J., Rahman, M. and Saseendran, A., 2021. An Exploration of Age on Attraction and Retention of Managerial Workforce in the Electrical Construction Industry in the United States. International Journal of Construction Education and Research, [e-journal] 17(1), pp.3–17. https://doi.org/10.1080/15578771.2019.1611678
Bigelow, B.F., Perrenoud, A.J., Rahman, M. and Saseendran, A., 2019. An exploration of age on attraction and retention of managerial workforce in the electrical construction industry in the United States. International Journal of Construction Education and Research, [e-journal] 17(1), pp.3-17. https://doi.org/10.1080/15578771.2019.1611678
Bigelow, B.F., Zarate, V., Soto, J., Arenas, J. and Perrenoud, A., 2017. Attracting and retaining tradespeople, an evaluation of influencers on construction workers in two different trades in Texas. International Journal of Construction Education and Research, [e-journal] 15(3), pp.163-78. https://doi.org/10.1080/15578771.2017.1280103
Bigelow, B.F., Saseendran, A. and Elliott, J.W., 2017. Attracting students to construction education programs: An exploration of perceptions by gender. International Journal of Construction Education and Research, [e-journal] 14(3), pp.179-97. https://doi.org/10.1080/15578771.2017.1280101
Bishop, J., 1981. Employment in Construction and Distribution Industries: The Impact of the New Jos Tax Credit. In: S. Rosen, ed. 1981. Studies in Labor Markets. Chicago USA: University of Chicago Press. pp.209-46.
Blanz, M., 2017. Employees’ Job Satisfaction: A Test of the Job Characteristics Model Among Social Work Practitioners. Journal of Evidence-Informed Social Work, [e-journal] 14(1), pp.35-50. https://doi.org/10.1080/23761407.2017.1288187
Bonilla, A., Gajjar, D. and Sullivan, K., 2019. Study of Various Construction Job Functions to Address Workforce Challenge. Journal of the American Institute of Constructors, 44(01), pp.6-13.
Bureau of Labor Statistics (BLS), 2020. Table 18. Annual quits rates by industry and region, not seasonally adjusted. [online] Available at: U.S. Bureau of Labor Statistics https://www.bls.gov/news.release/jolts.t18.htm [Accessed 11 August 2022].
Chan, A.P.C., Chiang, Y.-H., Wong, F.K.-W., Liang, S. and Abidoye, F.A., 2020. Work–Life Balance for Construction Manual Workers. Journal of Construction Engineering and Management, [e-journal] 146(5), p.04020031. https://doi.org/10.1061/(ASCE)CO.1943-7862.0001800
Chih, Y.Y., Kiazad, K., Zhou, L., Capezio, A., Li, M. and D. Restubog, S.L., 2016. Investigating employee turnover in the construction industry: A psychological contract perspective. Journal of construction engineering and management, [e-journal] 142(6), p.04016006. https://doi.org/10.1061/(ASCE)CO.1943-7862.0001101
Chillakuri, B. and Mahanandia, R., 2018. Viewpoint: Generation Z entering the workforce: the need for sustainable strategies in maximizing their talent. Human Resource Management International Digest, [e-journal] 26(4), pp.34-38. https://doi.org/10.1108/HRMID-01-2018-0006
Chinyio, E., Suresh, S. and Salisu, J.B., 2018. The impacts of monetary rewards on public sector employees in construction. Journal of Engineering, Design and Technology, [e-journal] 16(1), pp.125-42. https://doi.org/10.1108/JEDT-12-2016-0098
Clarke, L. and Herrmann, G., 2019. Skill shortages, recruitment and retention in the house building sector. Personnel Review, [e-journal] 36(4), pp.509-27. https://doi.org/10.1108/00483480710752777
Collisson, B., Eck, B.E. and Harig, T., 2021. Introducing Gen Z psychology majors: Why they choose to major in psychology (and what they expect to learn). Scholarship of Teaching and Learning in Psychology, [e-journal] 9(3), pp.276-87. https://doi.org/10.1037/stl0000249
Delvinne, H.H., Hurtado, K., Smithwick, J., Lines, B. and Sullivan, K., 2020. Construction Workforce Challenges and Solutions: A National Study of the Roofing Sector in the United States. In: Asmar, M.E. et al., eds. ASCE, Proceedings of Construction Research Congress 2020: Safety, Workforce and Education. Tempe, Arizona, USA, 8-10 March 2020. Virginia, US: ASCE. pp.529-37. https://doi.org/10.1061/9780784482872.057
Dimock, M., 2019. Defining generations: Where Millennials end, and Generation Z begins. Pew Research Center. [online] Available at: https://www.pewresearch.org/fact-tank/2019/01/17/where-millennials-end-and-generation-z-begins/ [Accessed 9 November 2022].
Dixit, S. and Sharma, K., 2020. An Empirical Study of Major Factors Affecting Productivity of Construction Projects. In: Babu, K., Rao, H., Amarnath, Y., eds. Emerging Trends in Civil Engineering. Lecture Notes in Civil Engineering, 61. Singapore: Springer. https://doi.org/10.1007/978-981-15-1404-3_12
Gajjar, D., Lucas, J. and Davis, D., 2022. Understanding employee perception to promote management level workforce development for roofing contractors. International Journal of Construction Education and Research, [e-journal] 19(2), pp.221-38. https://doi.org/10.1080/15578771.2022.2049663
Goh, E. and Okumus, F., 2020. Avoiding the hospitality workforce bubble: Strategies to attract and retain generation Z talent in the hospitality workforce. Tourism Management Perspectives, [e-journal] 33(2020), p.100603. https://doi.org/10.1016/j.tmp.2019.100603
Hampton, D. and Welsh, D., 2019. Work Values of Generation Z Nurses. The Journal of Nursing Administration, [e-journal] 49(10), pp.480-86. https://doi.org/10.1097/NNA.0000000000000791
Hasan, A., Baroudi, B., Elmualim, A. and Rameezdeen, R., 2018. Factors affecting construction productivity: a 30 year systematic review. Engineering, Construction and Architectural Management, [e-journal] 25(7), pp.916-37. https://doi.org/10.1108/ECAM-02-2017-0035
Herzberg, F., Mausner, B. and Snyderman, B.B., 1959. The Motivation to Work. 2nd ed. New York: John Wiley & Sons.
IBISWorld, 2022. Construction Industry in the U.S. – Market Research Reports [online] Available at: https://www.ibisworld.com/united-states/market-research-reports/construction-industry/ [Accessed 11 August 2022].
Kantrowitz, M., 2007. The Financial Value of a Higher Education. NASFAA Journal of Student Financial Aid, 37(1), pp.19-27. https://doi.org/10.55504/0884-9153.1075
Karakhan, A.A., Gambatese, J. and Simmons, D.R., 2020. Development of assessment tool for workforce sustainability. Journal of Construction Engineering and Management, [e-journal] 146(4), p.04020017. https://doi.org/10.1061/(ASCE)CO.1943-7862.0001794
Kersting, W.H., 2006. Distribution System Modeling and Analysis, 2nd ed. Boca Raton: CRC Press. https://doi.org/10.1201/9781420006162
Kian, T.S, Yusoff, W.F.W., Rajah, S., Hussein, T. and Malaysia, O., 2014. Job Satisfaction and Motivation: What are the Differences Among the Two? European Journal of Business and Social Sciences, 3(2), pp.94-102. https://doi.org/10.6007/IJARBSS/v3-i11/319
Kim, K. and Frazier, G.L., 1997. Measurement of distributor commitment in industrial channels of distribution, Journal of Business Research, [e-journal] 40(2), pp.139-54. https://doi.org/10.1016/S0148-2963(96)00284-6
Kim, W., Kim, J., Wo, H., Park, J., Jo, J., Park, S.H. and Lim, S.Y., 2017. The Relationship between work engagement and organizational commitment: Proposing research agendas through a review of empirical literature. Human Resource Development Review, [e-journal] 16(4), pp.350-76. https://doi.org/10.1177/1534484317725967
Kim, S., Chang, S. and Castro-Lacouture, D., 2020. Dynamic Modeling for Analyzing Impacts of Skilled Labor Shortage on Construction Project Management. Journal of Management in Engineering, [e-journal] 36(1), p.04019035. https://doi.org/10.1061/(ASCE)ME.1943-5479.0000720
Lanier, K., 2017. 5 Things H.R. professionals need to know about Generation Z. Strategic H.R. Review, [e-journal] 16(6), pp.288-90. https://doi.org/10.1108/SHR-08-2017-0051
Lobo, B.J. and Burke-Smalley, L.A., 2017. An empirical investigation of the financial value of a college degree. Education Economics, [e-journal] 26(1), pp.78–92. https://doi.org/10.1080/09645292.2017.1332167
Locke, E.A., 1976. The Nature and Causes of Job Satisfaction. In: Dunnette, M.P., ed. Handbook of Industrial and Organizational Psychology. Chicago: Rand McNally, pp.1297-1350.
Lui, H., Liu, W., Yoganathan, V. and Osburg, V., 2021. COVID-19 information overload and generation Z’s social media discontinuance intention during the pandemic lockdown. Technological Forecasting and Social Change, [e-journal] 166(2021), p.120600. https://doi.org/10.1016/j.techfore.2021.120600
Maloni, M., Hiatt, M.S. and Campbell, S., 2019. Understanding the work values of Gen Z business students. International Journal of Management Education, [e-journal] 17(3), p.100320. https://doi.org/10.1016/j.ijme.2019.100320
Marcello, J., 2021. 7 Steps to Offset the Distributor Labor Shortage. MDM Distribution Intelligence, Operations, [blog] 29 September. Available at: https://www.mdm.com/blog/tech-operations/operations/7-steps-to-offset-the-distribution-labor-shortage/ [Accessed 11 August 2022].
Maslow, A.H., 1970. Motivation and Personality. 2nd ed. New York: Harper and Row.
Meier, M. and Pinto, E., 2020. Covid-19 Supply Chain Disruptions. Discussion Paper No. 239, German Research Foundation. [online] Available at: https://www.wiwi.uni-bonn.de/bgsepapers/boncrc/CRCTR224_2020_239.pdf [Accessed 11 August 2022].
Metro, K., Harper, C. and Bogus, S.M., 2021. Factors Affecting Workforce Resilience in Public Transportation Agencies. Journal of Management in Engineering, [e-journal] 37(4), p.04021018. https://doi.org/10.1061/(ASCE)ME.1943-5479.0000920
Monroe, W., 2021. Learning to live with the manufacturing and distribution labor shortage. SupplyChainDive, Operations Management, [blog] 18 October. Available at: https://www.supplychaindive.com/spons/learning-to-live-with-the-manufacturing-and-distribution-labor-shortage/608196/ [Accessed 11 August 2022].
National Center for Construction Education and Research (NCCER), 2017. Inside the Industry: Broadening Our Horizon: The Search for Talent. The Cornerstone: A Construction Publication for Workforce Development Professionals, Fall/Winter, pp.26-31. [online] Available at: https://www.nccer.org/docs/default-source/pdfs/nccer-cornerstone-fall-winter-2017-final.pdf [Accessed 11 August 2022].
Österberg, J. and Rydstedt, L., 2018. Job satisfaction among Swedish soldiers: Applying the Job Characteristics Model to newly recruited military personnel. Military Psychology, [e-journal] 30(4), pp.302-10. https://doi.org/10.1080/08995605.2018.1425585
Ozkan, M. and Solmaz, B., 2015. The Changing Face of the Employees – Generation Z and Their Perceptions of Work (A Study Applied to University Students). 4th World Conference on Business, Economics and Management (WCBEM), Procedia Economics and Finance, [e-journal] 26(2015), pp.476-83. https://doi.org/10.1016/S2212-5671(15)00876-X
Perrenoud, A.J., Bigelow, B.F. and Perkins, E.M., 2020. Advancing Women in Construction: Gender Differences in Attraction and Retention Factors with Managers in the Electrical Construction Industry. Journal of Management in Engineering, [e-journal] 36(5), p.04020043. https://doi.org/10.1061/(ASCE)ME.1943-5479.0000808
Pichler, S., Kohli, C. and Granitz, N., 2021. DITTO for Gen Z: A framework for leveraging the uniqueness of the new generation. Business Horizons, [e-journal] 64(5), pp.599–610. https://doi.org/10.1016/j.bushor.2021.02.021
Sarkis, J., 2020. Supply chain sustainability: learning from the COVID-19 pandemic. International Journal of Operations & Production Management, [e-journal] 41(1), pp.63-73. https://doi.org/10.1108/IJOPM-08-2020-0568
Sedighi, F. and Loosemore, M., 2012. Employer-of-choice characteristics in the construction industry. Construction Management and Economics, [e-journal] 30(11), pp.941–50. https://doi.org/10.1080/01446193.2012.694458
Shan, Y., Imran, H., Lewis, P. and Zhai, D., 2017. Investigating the Latent Factors of Quality of Work-Life Affecting Construction Craft Worker Job Satisfaction. Journal of Construction Engineering and Management, 143(5), p.04016134. https://doi.org/10.1061/(ASCE)CO.1943-7862.0001281
Sharma, J.P. and Bjapai, N., 2011. Salary Satisfaction as an Antecedent of Job Satisfaction: Development of a Regression Model to Determine the Linearity between Salary Satisfaction and Job Satisfaction in a Public and a Private Organization. European Journal of Social Sciences, 18(3), pp.450-61.
Spector, P.E., 1997. Job satisfaction: Application, assessment, causes, and consequences. London: Sage. https://doi.org/10.4135/9781452231549
Srour, I.M., Haas, C.T. and Borcherding, J.D., 2006. What does the construction industry value in its workers? Journal of Construction Engineering and Management, [e-journal] 132(10), pp.1053-58. https://doi.org/10.1061/(ASCE)0733-9364(2006)132:10(1053)
Thangaswamy, A. and Thiyagaraj, D., 2017. Theoretical concept of job satisfaction – a study. International Journal of Research – Granthaalayah, [e-journal] 5(6), pp.464-70. https://doi.org/10.29121/granthaalayah.v5.i6.2017.2057
Yusoff, W.F.W., Kian, T.S. and Rajah, S., 2013. Employee Satisfaction and Citizenship Performance among Generation X and Y. In: Proceedings of International Business Information Management Association Entrepreneurship Vision 2020: Innovation, Development Sustainability, and Economic Growth. Kuala Lumpur, Malaysia, 25-26 March 2013. pp.1099-1111.
Zaniboni, S., Truxillo, D.M., Rineer, J.R., Bodner, R.E., Hammer, L.B. and Krainer, M., 2016. Relating Age, Decision Authority, Job Satisfaction, and Mental Health: A Study of Construction workers. Work, Aging and Retirement, [e-journal] 2(4), pp.428-35. https://doi.org/10.1093/workar/waw006