RESEARCH ARTICLE
The log mean divisia index based carbon productivity in the Australian construction industry
Lingfeng Liang1, Xiancun Hu1, Linda Tivendale1, Chunlu Liu1*
1 School of Architecture and Built Environment, Deakin University, 1 Gheringhap Street, Geelong, VIC 3220, Australia.
Construction Economics and Building, Vol. 17, No. 3, September 2017
© 2017 by the author(s). This is an Open Access article distributed under the terms of the Creative Commons Attribution 4.0 International (CC BY 4.0) License (https://creativecommons.org/licenses/by/4.0/), allowing third parties to copy and redistribute the material in any medium or format and to remix, transform, and build upon the material for any purpose, even commercially, provided the original work is properly cited and states its license.
Citation: Liang, L., Hu, X., Tivendale, L. and Liu, C. 2017. The log mean divisia index based carbon productivity in the Australian construction industry. Construction Economics and Building, 17:3, 68-84. http://dx.doi.org/10.5130/AJCEB.v17i3.5544
ISSN 2204-9029 | Published by UTS ePRESS | ajceb.epress.lib.uts.edu.au
*Corresponding author: Chunlu Liu, School of Architecture and Built Environment, Deakin University, 1 Gheringhap Street, Geelong, VIC 3220, Australia. Email: chunlu@deakin.edu.au
DOI: http://dx.doi.org/10.5130/AJCEB.v17i3.5544
Article History: Received 22/05/2017; Revised 12/08/2017; Accepted 05/09/2017; Published 21/09/2017
Abstract
Environmental protection and economic growth are two indicators of sustainable global development. This study aims to investigate the performance of environmental protection and economic growth by measuring carbon productivity in the construction field. Carbon productivity is the amount of gross domestic product generated by the unit of carbon emissions. The log mean Divisia index method is used to investigate influential factors including carbon intensity, energy intensity and regional adjustment that impact on changes of carbon productivity. The study utilises a range of data from the Australian construction industry during 1995-2004 including energy consumption, industry value added and carbon dioxide equivalent consumption. The research indicates carbon productivity in the Australian construction industry has clearly increased. Energy intensity plays a significant positive role in promoting carbon productivity, whereas carbon intensity and regional adjustment have limited influence. Introducing advanced construction machinery and equipment is a feasible pathway to enhance carbon productivity. The research method is generic and can be used to measure other performance indicators and decomposing them into influential factors.
Keywords
Carbon productivity, construction industry, decomposition, log mean Divisia index
Introduction
Global environmental protection has been an emerging challenge for sustainable development in most countries. Greenhouse gas (GHG) emissions are the main contributor to driving environmental change while carbon dioxide and carbon dioxide equivalent (CO2-e) emissions account for 80% of the contribution to global warming (Lashof and Ahuja, 1990). The large carbon dioxide consumption has dominated most environmental issues such as environmental pollution and global warming. Although some communities appeal for government action on GHG emissions, most countries fear that a reduction of energy consumption will reduce economic growth. Therefore, the serious challenge for most countries and organisations is to improve production and reduce carbon emissions simultaneously. For instance, the Carbon Disclosure Project (CDP) aims to take critical action to develop a truly sustainable economy by understanding and measuring the environmental impact from investors, companies, and cities (CDP, 2017).
Productivity is defined as the ratio of output created per input unit (Grönroos and Ojasalo, 2004). In the construction industry many kinds of productivity, such as total factor productivity (Li and Liu, 2010), energy productivity (Hu and Liu, 2016a), capital productivity (Raouf, 1994) and labour productivity (Li and Liu, 2012) have been applied to assess construction growth. On the other hand, carbon productivity has been researched widely in a range of industries (e.g. Meng, Liu and Gao, 2014; Long, Shao and Chen, 2016), but there is a lack of carbon productivity research in the construction industry. This research therefore, measures construction-sector carbon productivity in Australian states and territories, and analyses these measurements using the decomposition method to determine the influential factors.
The aim of this research is to provide a method to measure carbon productivity and identify influential factors that promote carbon productivity. The paper will firstly discuss the literature related to the concept of carbon productivity and the log mean Divisia index (LMDI) decomposition method. Introduced secondly will be the research method to measure and decompose carbon productivity. Application of the research method in the Australian construction industry to measure carbon productivity will then be used to analyse the influential factors, and finally, carbon productivity in the Australian construction industry will be discussed.
Literature review
CARBON PRODUCTIVITY
Carbon productivity is an effective conceptual theory used to measure various carbon emissions in economic regions over a period of time (Enkvist, Naucler and Oppenheim, 2008). The concept of carbon productivity is defined as the amount of Gross Domestic Product (GDP) generated per unit of carbon emissions, which represents the value of per unit carbon emissions output (Kaya and Yokobori, 1997). Shao et al. (2014) stated that the carbon productivity concept would investigate the performance of industrial value added per unit of carbon emissions. According to Siew (2015), carbon productivity can be considered as a performance reporting/ranking criteria of the relationship between economic growth and environmental sustainability, similar to Global Reporting Initiative, DPSIR framework, and SA8000. Increasing carbon productivity would improve economic growth and reduce carbon emissions at the same time (Dedrick, 2010). Carbon productivity improvement can assist other productivity indicators such as capital productivity and multi-factor productivity (Hu and Liu, 2016b). Stern and Jotzo (2010) found that higher carbon productivity in most cases would help developing countries produce more economic benefits. Therefore, higher carbon productivity would improve environmental performance. He et al. (2010) estimated carbon productivity corresponding to economic growth, and stated that the carbon productivity concept would be useful to investigate the effort and effectiveness for global climate change in a particular region. Therefore, improving carbon productivity can promote low-carbon and eco-industrial development, and consequently benefit sustainable development.
The carbon productivity concept and measurement has been widely studied, though not specifically in the construction industry. Peng and Zhao (2012) studied the convergence of carbon productivity in China’s regional level and found the GDP, industry structure, energy intensity, and consumption structure had a significant influence. Meng, Liu and Gao (2014) investigated the Chinese provinces’ economic growth using the decomposition method to analyse the carbon productivity impact. Shen (2014) promoted the industrial improvement of carbon productivity combined with capital and labour factors. Long, Shao and Chen (2016) researched China’s industrial carbon productivity using spatial panel data models. Gao and Zhu (2016) developed a technological process to promote carbon productivity in China’s industrial sectors. Wang et al. (2016) evaluated carbon productivity change-indicators in 37 major countries and regions. Pan and Zhang (2011) calculated carbon productivity in China’s regions using the indices technique. Therefore, carbon productivity measurements and analysis could be conducted for the construction industry.
Carbon productivity is an important key to assessing the indicators of a country’s performance, and will help the construction industry increase production and reduce CO2-e emissions (Hu and Liu, 2016b). The decomposition method can investigate the elements influencing carbon productivity to explore the contribution of carbon productivity changes for future analysis (Ang and Choi, 1997). Hu and Liu (2016b) measured carbon productivity in the Australian construction industry and analysed two indicators that influence carbon productivity changes. The two indicators were technological innovation and regional adjustment. However, Hu and Liu (2016b) did not consider the impact of energy consumption. Meng, Liu and Gao (2014) showed that energy consumption is an important influence on carbon productivity change. Therefore, energy consumption will be considered for carbon productivity analysis in this study.
INDEX DECOMPOSITION ANALYSIS (IDA) METHODS AND THE LOG MEAN DIVISIA INDEX (LMDI)
A decomposition analysis generally allows evaluation of environmental issues. It has been widely used to investigate the contributing factors that influence energy consumption changes, and carbon emission changes (Ang, 1995). For example, Sun (1999) investigated the change of aggregate carbon emissions and Alcantara and Duro (2004) researched energy intensities in Organization for Economic Co-operation and Development (OECD) countries. The decomposition methods primarily include structural decomposition analysis, index decomposition analysis (IDA) and production-theoretical decomposition analysis. IDA as a form of statistical decomposition analysis can be used to analyse measurement indicators by application of various index numbers. IDA can be used to decompose the index of energy consumption (Liu et al., 2007) and to track carbon emissions (Xu and Ang, 2013). Generally, IDA can determine the effect of indicators and particular industry structure changes according to applied index numbers (Lin and Du, 2014). In IDA, it is important to understand that the decomposition process begins with the identification of a study period, determining the measures or production levels and finally choosing the particular level of disaggregation for each activity (Schymura and Voigt, 2014). The IDA framework is displayed in Figure 1. The IDA methods can be divided into the methods linked to the Laspeyres index and the methods linked to the Divisia index. Compared to the methods linked to the Divisia index, the methods linked to the Laspeyres index frequently produce large residual and larger estimation defects (Ang, 2004). In the IDA methods, the developed indices linked to the Divisia index include the LMDI, arithmetic mean Divisia index, Tornqvist index, Sato-Vartia index and Vartia I index. Ang (2004) states that the LMDI method is the preferred IDA method for policymaking in energy studies. The LMDI method has been widely used in multiple industries to measure industry productivity and to identify key factors that influence its performance. The LMDI method can be used to decompose the changes in carbon emissions (Meng and Niu, 2012). Park and Shim (2015) investigated GHG consumption factors using the LMDI method and found that the structure effect made a significant contribution to reducing emissions. Achour and Belloumi (2016) studied the influencing factors of energy consumption in Tunisian transportation sector using the LMDI method and pointed out that improving transport energy intensity exerts a positive effect on saving energy. Moreover, the LMDI method has been used to investigate the carbon productivity concept. For instance, Sun et al. (2016) analysed the electric carbon productivity in China’s industrial sector and Zhao and Gao (2013) investigated the generalized carbon productivity index in China.
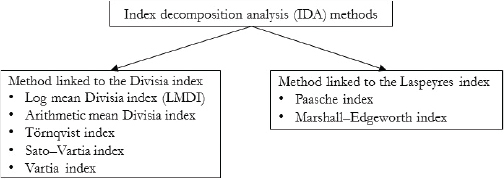
Figure 1 The framework of the IDA methods
Recently, the LMDI method has been recognised in the construction field. Lin and Liu (2015) investigated CO2 emissions in China’s construction industry using LMDI and showed that reducing carbon dioxide emissions can improve the carbon intensity in China’s regions. Hu and Liu (2016b) measured carbon productivity in the Australian construction industry with the results indicating that technological innovation played a significant role in influencing carbon productivity. This study will explore three influential factors in carbon productivity changes using the LMDI method, namely carbon intensity, energy intensity, and regional adjustment. The critical reasons for selecting this method include its strong theoretical foundation, high adaptability and the capacity to develop a suitable decomposition, where no unexplained, residual term performs in the decompositions (Jung et al., 2012). Moreover, the LMDI method is a preferred method for the decomposition of incomplete datasets (Xu et al., 2016).
Decomposition of carbon productivity based on the log mean Divisia index
Carbon productivity (CP) can be presented as the ratio between gross value added (Y) and total carbon emissions (C) (Meng and Niu, 2012), which is expresed as:
In Equation (1), i(i = 1,···,n) is the number of industry components or regional industrial sectors. In this study, Ci is the total carbon emissions of the ith regional sector, Ei is the total energy emissions of the ith regional sector, Yi is the Australian construction gross value added in ith regional sector and Y is the total value added of Australian states and territories. Thus,  is identified as the effect of Carbon Intensity (CIi) of the ith regional sector, which is reflected as the change of energy structure in the particular regional sector. Also,
  represents the ratio of total energy inputs to value added in the construction industry, which is identified as Energy Intensity (EIi).
  represents the change of value-added ratio of a particular region compared to the total construction industry value added, which is identified as the change in Regional Adjustment (RAi). The CP will change with time, inversely proportional to the changes of CIi, EIi and RAi. Hence, Equation (1) can be represented and defined as:

The change of this function with time t is presented as:
In Equation (3),  represents the change of carbon emissions intensity (CIi) for each component in ith regional sector. The
  term will result in the change of energy emissions intensity (EIi) in the regional sector. The
  term represents the gross value-added change in the whole construction industry. Therefore, the relative change in CPt from time-period x to x+1 is:
Equation (3) resolves the necessary discrete data (Ang and Choi, 1997). The result can reject the decomposition residuals when using the LMDI algorithm, which can use the arithmetic mean weight scheme in the calculation (Meng and Niu, 2012). It can represent the influence of  . Therefore, the arithmetic mean weight can be written as
  , where
  . It is defined that
  , which is the limit of
  . Therefore, Equation (4) can be written as follows:


To summarize, the three factors, namely Carbon Intensity Change (CIC), Energy Intensity Change (IEC) and Regional Adjustment Change (RAC) will change the CP. Equations (5a), (5b) and (5c) represent the change of CI, EI, and RA, respectively. In this decomposition, Equations (5a), (5b) and (5c), the relation between the factors and CP is inversely proportional, thus larger CIC, EIC, and RAC results in CP from period x to period x+1.
Carbon productivity and decomposition factors in the Australian construction industry
The research will focus on the construction industry at Australia’s state level from 1995 to 2014. The data of gross value added were collected from the Australian National Accounts: State Account, which represents the goods and value products from the construction industry. Energy consumption was collected from Australian Energy Statistics. The carbon dioxide equivalent data were collected from the Australian Department of Environment and Energy. The carbon dioxide equivalent includes carbon dioxide (CO2), methane (CH4), nitrous oxide (N2O), hydrofluorocarbons (HFCs), perfluorocarbons (PFCs) and sulphur hexafluoride (SF6). In this study, the construction industry in each state and territory are namely New South Wales (NSW), Victoria (VIC), Queensland (QLD), Western Australia (WA), South Australia (SA), Tasmania (TAS), and the Northern Territory (NT). The data in the Australian Capital Territory is considered within the data in New South Wales data as that is how the statistics are collected.
CARBON PRODUCTIVITY CHANGES
Table 1 shows the CP changes in the Australian construction industry for each state from 1995 to 2014. The CP change is the ratio change of gross value-added to carbon emissions between two dates. From the average values, it can be seen that all construction industries in Australia displayed evident increased carbon productivity in the research period. The highest CP change is in the NT achieving 17.5% yearly on average. The NT also demonstrated strong fluctuations over the entire research years due to drastic changes in the size of the construction market. For instance, the construction value-added decreased from 2,113 million in 1999, to 983 million in 2001, then increased to 2,401 million in 2005, decreased to 1,515 million in 2011and finally increased again to reach 3,942 million in 2014. The construction industry in WA, QLD, SA, TAS and VIC improved in average values in the research period, with the increasing values of 8.7%, 5.6%, 5.1% 4.7% and 3.0%, respectively. The construction industry in NSW showed the least increase with an average improved value of 1.0% yearly.
Additionally, many studies (e.g. Li and Liu, 2010; Hu and Liu, 2016a) have noted significant productivity growth in the Australian construction industry. In this research, the Australian construction industry improved its performance in green production from 1995 to 2014, as proved by measuring carbon productivity while considering carbon emissions and construction output.
CARBON INTENSITY CHANGES
Carbon intensity changes represent changes of energy consumption, which, in turn, reflect changes in carbon emissions. Table 2 shows the carbon intensity changes in each state of the Australian construction industry during 1995-2014, calculated using Equation (5a). Carbon intensity had a weak negative influence on CP changes during 1995-2014 in the total Australian construction industry as shown with the mean values in Table 2. In other words, the energy consumption in the whole construction industry did not demonstrate obvious changes from 1995 to 2014. In particular, the NT and TAS showed minimal fluctuations during the whole research period, followed by SA and WA. VIC demonstrated a negative influence in CP changes from 2001 to 2012 while NSW and QLD showed negative influences in 1995-2000 and again from 2006-2011. More specifically, the worst results in Australia were shown in NSW from 2002 to 2005 where the average negative ratio of carbon intensity of 4.8%, hindered the construction industry in that state. Although the construction sector indicated a positive influence in 2013-2014, promoting the use of clean energy is a critical challenge for the whole construction sector.
ENERGY INTENSITY CHANGES
Energy intensity represents the ratio of total energy consumption inputs to value added outputs, which indicates the efficiency level of energy consumption. Table 3 shows energy intensity changes in each state of the Australian construction industry during 1995-2014, calculated using Equation (5b). In contrast to carbon intensity changes in Table 2, energy intensity changes in Table 3 showed (with the exception of TAS at 1.000) a positive influence on CP changes by observing the mean values from 1995 to 2014.
This efficiency improvement in energy consumption promotes the development of CP in the Australian construction industry. The most positive influence is in QLD, where the average increase ratio is 1.9% over the entire research period. The average ratios in VIC and NSW are 1.1% and 1.0% respectively while energy intensity changes in SA and the NT showed weak positive influence on CP changes with respective mean values of 0.4% and 0.2%.
REGIONAL ADJUSTMENT CHANGES
Regional adjustment represents the value-added ratio of a particular regional industry to the total construction industry. Table 4 shows the regional adjustment changes during 1995 to 2014 in the Australian construction industry, calculated by Equation (5c). It can be seen that regional adjustment did not play a crucial role in CP changes in the Australian construction industry, by observing that average values are all nearly 1.000, especially in SA. Regional adjustment had a slight positive influence in CP changes in NSW, VIC and TAS while a minimal negative influence is seen in the NT, QLD and WA. Therefore, from 1995 to 2014, production in the construction industries across states did not display marked influence on CP changes in Australia.
Developing carbon productivity in the Australian construction industry
Figure 2 shows the average values of the decomposition factors of CI, EI, and RA in the construction industry in each of Australia’s states and territory during 1995-2014. A value higher than 1.000 indicates the decomposition factor plays a positive function in the CP changes. Less than 1.000, on the contrary, implies a negative influence. Firstly, EI promoted the CP development in all construction sectors, most notably in QLD, which indicates energy consumption efficiency has been significantly enhanced in the Australian construction industry. Secondly, CI delayed the CP development in all sectors, particularly in NSW, which indicates energy consumption should be improved in order to promote CP development. Thirdly, RA had a positive effect on CP in NSW and VIC but had a negative effect in WA and QLD. It can be concluded that construction scale and engineering works promoted the advancement of CP in NSW and VIC, but not in WA and QLD. The three decomposition factors showed only a small influence on CP changes in TAS, SA and the NT.

Figure 2 Mean LMDI by region during 1995-2004
Figure 3 shows the annual mean LMDI in the Australian construction industry from 1995 to 2014. It can be generally seen that EI is above the other three indices and CI is below the other indicators in most of the research periods. The RA fluctuations are less obvious during this research period. This further verifies that the changes of EI, CI and RA had positive, negative and weak influences on CP changes respectively. For instance, the introduction of the Goods and Services Tax (GST) in 2000-01 had a major negative impact on EI, which led to the decrease of CP (Hu and Liu, 2016b). From 1995 to 2005, all indices showed noticeable variations especially in 2002-2003. According to Energy Account 2006-07 (ABS, 2009), the use of natural gas increased from 2 PJ in 2002 to 3 PJ in 2003, which could produce the sharp decrease for CI during 2002-03. From 2005 to 2014, the performance of the four indices is relatively stable. However, it should be noted that the function of EI was in decline from 2010-11. How to improve energy efficiency further will be a challenge in the Australian construction industry.

Figure 3 Annual mean LMDI in the Australian construction industry
In the construction industry, the barriers that hinder sustainability programs are complex and multifaceted, such as “capital cost concern”, “potential barriers to competitiveness”, “needing to show a positive rate of return”, “need a practical implementation”, and “not sure how to do it or measure it” (Yates, 2014). As mentioned in Wong (2013), carbon reduction policies, strategies and technologies were not initially put forward, nor implemented, in conventional construction projects in Australia. It is only recently that the carbon emissions-related initiatives such as reducing construction waste, and complying with the green-star ratings have been disseminated in the Australian construction industry. In this study, improving carbon productivity as a combination of production outputs and environmental protection was measured and investigated in the Australian construction industry. The first measure is the implementation of carbon intensity improvement, which seems more difficult in the construction sector. The improvement of energy consumption pattern indicates not only the development and use of clean energy but also the innovation and updating of machinery and equipment. Secondly, the decrease of energy intensity, which has also been discussed in ABS (2009), supported the development of carbon productivity. These factors demonstrate that the construction sector has introduced advanced machinery and equipment (Hu et al., 2017), which expanded gross value added and reduced energy consumption in construction. The current challenge is to revolutionise machinery and equipment to utilise clean energy. Finally, the regional adjustment had a very limited influence in affecting CP changes. Regional adjustment as a macro influence factor, which embodies construction scale diversities among regions and the change of types of construction projects, could be vulnerable to government policies such as taxes, market and financial incentives (Hu and Liu, 2016b). More construction industry-specific emission reduction policies and various phase reduction targets are expected, to further mitigate construction emissions (Lu et al., 2016). Therefore, enhancing energy-technology innovation, updating advanced machinery and equipment, and expanding construction scale are indispensable factors in developing carbon productivity in the construction sector.
Conclusions
To conclude, this paper investigated the CP performance and influence indicators in the Australian construction industry. The paper applied the LMDI decomposition method to analyse three factors that would affect CP performance, namely carbon intensity, energy intensity and regional adjustment. Carbon productivity showed significant development in the Australian construction industry in each state and territory. Carbon intensity showed a negative influence on CP change in NSW, VIC and QLD, with a more limited negative influence in WA, SA, TAS and the NT. Energy intensity played a significant positive role in promoting CP improvement in all states except TAS without affecting any changes. Regional adjustment showed positive influences in NSW and VIC and limited influence in other states and the NT. The innovation and application of clean energy in the construction industry hindered the improvement of CP. Encouraging CP changes in the whole construction industry is hampered by lack of regional coordination and engineering works that are heavy users of energy. However, the Australian construction industry has introduced advanced construction machinery and equipment, which led to the improvement of carbon intensity and further development of CP in the research period.
Three main contributions have been achieved in this study. Firstly, carbon productivity measurement can help the construction industry to improve sustainable development through combining environmental protection and economic growth. Secondly, the LMDI method has been applied to decompose the influencing factors in CP changes. This is the first identification of the influencing factors of carbon intensity, energy intensity, and regional adjustment in the construction field. Thirdly, measures for promoting carbon productivity are established, which could be of value to other national construction industries. Introducing advanced construction machinery and equipment is a feasible and frequent pathway. Improving energy consumption patterns, construction scale and engineering types, are other implementable methods. More importantly, the research method is generic and can be used to measure other performance indicators, decomposing them into appropriate factors. For instance, the sustainability performance could be measured and investigated for worldwide cities and companies, using the LMDI method and the data of CDP, if appropriate data is available. The method has been developed investigating a series of influencing factors in environmental issues (e.g. Chong et al., 2017; Ma et al., 2017). The limitation of this study is that the results and recommendations have not been tested and verified in practice. Further work could apply new methods such as Data Envelopment Analysis to analyse the results and then identify practical measures to enhance carbon productivity in construction.
DECLARATION OF CONFLICTING INTEREST The author(s) declared no potential conflicts of interest with respect to the research, authorship, and/or publication of this article. FUNDING The author(s) received no financial support for the research, authorship, and/or publication of this article.
References
ABS, 2009. 4604.0 - Energy Account, Australia, 2006-07. Canberra: Australian Bureau of Statistics.
Achour, H. and Belloumi, M., 2016. Decomposing the influencing factors of energy consumption in Tunisian transportation sector using the LMDI method. Transport Policy, 52, pp. 64-71. https://doi.org/10.1016/j.tranpol.2016.07.008
Alcantara, V. and Duro, J.A., 2004. Inequality of energy intensities across OECD countries: a note. Energy Policy, 32, pp. 1257-160. https://doi.org/10.1016/S0301-4215(03)00095-8
Ang, B., 1995. Decomposition methodology in industrial energy demand analysis. Energy, 20, pp. 1081-95. https://doi.org/10.1016/0360-5442(95)00068-R
Ang, B., 2004. Decomposition analysis for policymaking in energy:: which is the preferred method? Energy policy, 32, pp. 1131-39. https://doi.org/10.1016/S0301-4215(03)00076-4
Ang, B. and Choi, K.-H., 1997. Decomposition of aggregate energy and gas emission intensities for industry: a refined Divisia index method. The Energy Journal, 18(3), pp. 59-73. https://doi.org/10.5547/ISSN0195-6574-EJ-Vol18-No3-3
CDP, 2017. About us. The Carbon Disclosure Project, [online] Available at: https://www.cdp.net/en [Accessed: 15 August 2017].
Chong, C., Liu, P., Ma, L., Li, Z., Ni, W., Li, X. and Song, S., 2017. LMDI decomposition of energy consumption in Guangdong Province, China, based on an energy allocation diagram. Energy, 133, pp. 525-44. https://doi.org/10.1016/j.energy.2017.05.045
Dedrick, J., 2010. Green IS: concepts and issues for information systems research. Communications of the Association for Information Systems, 27, pp. 11-18.
Enkvist, P., Nauclér, T. and Oppenheim, J.M., 2008. Business strategies for climate change. McKinsey Quarterly, 2, p.24.
Gao, W. and Zhu, Z., 2016. The technological progress route alternative of carbon productivity promotion in China’s industrial sector. Natural Hazards, 82, pp. 1803-15. https://doi.org/10.1007/s11069-016-2271-7
Grönroos, C. and Ojasalo, K., 2004. Service productivity: Towards a conceptualization of the transformation of inputs into economic results in services. Journal of Business Research, 57, pp. 414-23. https://doi.org/10.1016/S0148-2963(02)00275-8
He, J., Deng, J. and Su, M., 2010. CO2 emission from China’s energy sector and strategy for its control. Energy, 35, pp. 4494-98. https://doi.org/10.1016/j.energy.2009.04.009
Hu, X., and Liu, C., 2016a. Energy productivity and total-factor productivity in the Australian construction industry. Architectural Science Review, 59(5), pp. 432-44. https://doi.org/10.1080/00038628.2015.1038692
Hu, X. and Liu, C., 2016b. Carbon productivity: a case study in the Australian construction industry. Journal of Cleaner Production, 112, pp. 2354-6232. https://doi.org/10.1016/j.jclepro.2015.10.042
Hu, X., Si, T. and Liu, C., 2017. Total factor carbon emission performance measurement and development. Journal of Cleaner Production, 142, pp. 2804-15. https://doi.org/10.1016/j.jclepro.2016.10.188
Jung, S., An, K.J., Dodbiba, G. and Fujita, T., 2012. Regional energy-related carbon emission characteristics and potential mitigation in eco-industrial parks in South Korea: Logarithmic mean Divisia index analysis based on the Kaya identity. Energy, 46(1), pp. 231-41. https://doi.org/10.1016/j.energy.2012.08.028
Kaya, Y. and Yokobori, K., 1997. Environment, energy and economy; strategies for sustainability. United Nations Publications.
Lashof, D.A. and Ahuja, D.R., 1990. Relative contributions of greenhouse gas emissions to global warming. Nature, 344, pp. 529-31. https://doi.org/10.1038/344529a0
Li, Y. and Liu, C., 2010. Malmquist indices of total factor productivity changes in the Australian construction industry. Construction management and economics, 28, pp. 933-45. https://doi.org/10.1080/01446191003762231
Li, Y. and Liu, C., 2012. Labour productivity measurement with variable returns to scale in Australia’s construction industry. Architectural Science Review, 55, pp. 110-18. https://doi.org/10.1080/00038628.2012.677587
Lin, B. and Du, K., 2014. Decomposing energy intensity change: A combination of index decomposition analysis and production-theoretical decomposition analysis. Applied Energy, 129, pp. 158-65. https://doi.org/10.1016/j.apenergy.2014.04.101
Lin, B. and Liu, H., 2015. CO2 mitigation potential in China’s building construction industry: A comparison of energy performance. Building and Environment, 94, pp. 239-51. https://doi.org/10.1016/j.buildenv.2015.08.013
Liu, L.-C., Fan, Y., Wu, G. and Wei, Y.-M., 2007. Using LMDI method to analyze the change of China’s industrial CO2 emissions from final fuel use: an empirical analysis. Energy Policy, 35, pp. 5892-5900. https://doi.org/10.1016/j.enpol.2007.07.010
Long, R., Shao, T. and Chen, H., 2016. Spatial econometric analysis of China’s province-level industrial carbon productivity and its influencing factors. Applied Energy, 166, pp. 210-19. https://doi.org/10.1016/j.apenergy.2015.09.100
Lu, Y., Cui, P. and Li, D., 2016. Carbon emissions and policies in China’s building and construction industry: Evidence from 1994 to 2012. Building and Environment, 95, pp. 94-103. https://doi.org/10.1016/j.buildenv.2015.09.011
Ma, M., Yan, R., Du, Y., Ma, X., Cai, W. and Xu, P., 2017. A methodology to assess China’s building energy savings at the national level: An IPAT–LMDI model approach. Journal of Cleaner Production, 143, pp. 784-93. https://doi.org/10.1016/j.jclepro.2016.12.046
Meng, M. and Niu, D., 2012. Three-dimensional decomposition models for carbon productivity. Energy, 46, pp. 179-87. https://doi.org/10.1016/j.energy.2012.08.038
Meng, M., Niu, D. and Gao, Q., 2014. Decomposition analysis of Chinese provincial economic growth through carbon productivity analysis. Environmental Progress and Sustainable Energy, 33, pp. 250-55. https://doi.org/10.1002/ep.11762
Pan, J. and Zhang, L., 2011. Research on the regional variation of carbon productivity in China. China Industrial Economics, 5, pp. 47-57.
Park, N.-B. and Shim, S., 2015. Decomposition Analysis of Energy Consumption and GHG Emissions by Industry Classification for Korea’s GHG Reduction Targets. Environmental and Resource Economics Review, 24, pp. 189-224. https://doi.org/10.15266/KEREA.2015.24.1.189
Peng, W.-q. and Zhao, K., 2012. Study on Convergence of Carbon Productivity in China. Journal of Xi’an University of Finance and Economics, 5, p.5.
Schymura, M. and Voigt, S., 2014. What drives changes in carbon emissions? An index decomposition approach for 40 countries. An Index Decomposition Approach for, 40, pp. 14-38. https://doi.org/10.2139/ssrn.2459410
Shao, C., Guan, Y., Wan, Z., Guo, C., Chu, C. and Ju, M., 2014. Performance and decomposition analyses of carbon emissions from industrial energy consumption in Tianjin, China. Journal of Cleaner Production, 64, pp. 590-601. https://doi.org/10.1016/j.jclepro.2013.08.017
Shen, F., 2014. The approach of improving environmental quality for the industrial interactive development of producer services and manufacture industry. Computer Modelling and New Technologies, 18, p.1021.
Siew, R.Y., 2015. A review of corporate sustainability reporting tools (SRTs). Journal of environmental management, 164, pp. 180-95. https://doi.org/10.1016/j.jenvman.2015.09.010
Stern, D. I. and Jotzo, F., 2010. How ambitious are China and India’s emissions intensity targets? Energy Policy, 38, pp. 6776-83. https://doi.org/10.1016/j.enpol.2010.06.049
Sun, J., 1999. Decomposition of Aggregate CO₂ Emissions in the OECD: 1960-1995. The Energy Journal, pp. 147-55.
Sun, W., He, Y. and Gao, H., 2016. An Electric Carbon Productivity Analysis of China’s Industrial Sector Using Multi-Dimensional Decomposition. Polish Journal of Environmental Studies, 25, pp. 1699-707. https://doi.org/10.15244/pjoes/61959
Wang, K., Xian, Y., Wei, Y.-M. and Huang, Z., 2016. Sources of carbon productivity change: A decomposition and disaggregation analysis based on global Luenberger productivity indicator and endogenous directional distance function. Ecological Indicators, 66, pp. 545-55. https://doi.org/10.1016/j.ecolind.2016.02.034
Wong, P., 2013. In search of carbon reduction drivers and practices for the construction projects in Australia. In SB13 Singapore: Realizing Sustainability in the Tropics (pp. 142-49). Research Publishing. Raouf, A., 1994. Improving capital productivity through maintenance. International Journal of Operations & Production Management, 14, pp. 44-52.
Xu, S.C., He, Z.X., Long, R.Y., Chen, H., Han, H.M. and Zhang, W.W., 2016. Comparative analysis of the regional contributions to carbon emissions in China. Journal of Cleaner Production, 127, pp. 406-17. https://doi.org/10.1016/j.jclepro.2016.03.149
Xu, X. and Ang, B.W., 2013. Index decomposition analysis applied to CO 2 emission studies. Ecological Economics, 93, pp. 313-29. https://doi.org/10.1016/j.ecolecon.2013.06.007
Yates, J., 2014. Design and construction for sustainable industrial construction. Journal of Construction Engineering and Management, 140(4), B4014005. https://doi.org/10.1061/(ASCE)CO.1943-7862.0000683 and https://doi.org/10.1061/(ASCE)CO.1943-7862.0000683
Zhao, G.-h. and Gao, W., 2013. Comprehensive Evaluation of Generalized Carbon-productivity Index in China’s Industrial Sector Based on Frontier Analysis Methods. Chinese Journal of Management Science, 1, pp. 31-6.